Higher DTU utilization indicates that the Azure SQL Database is consuming more resources than expected.
This metric is provided for Azure Database and Azure Managed Instance monitoring.
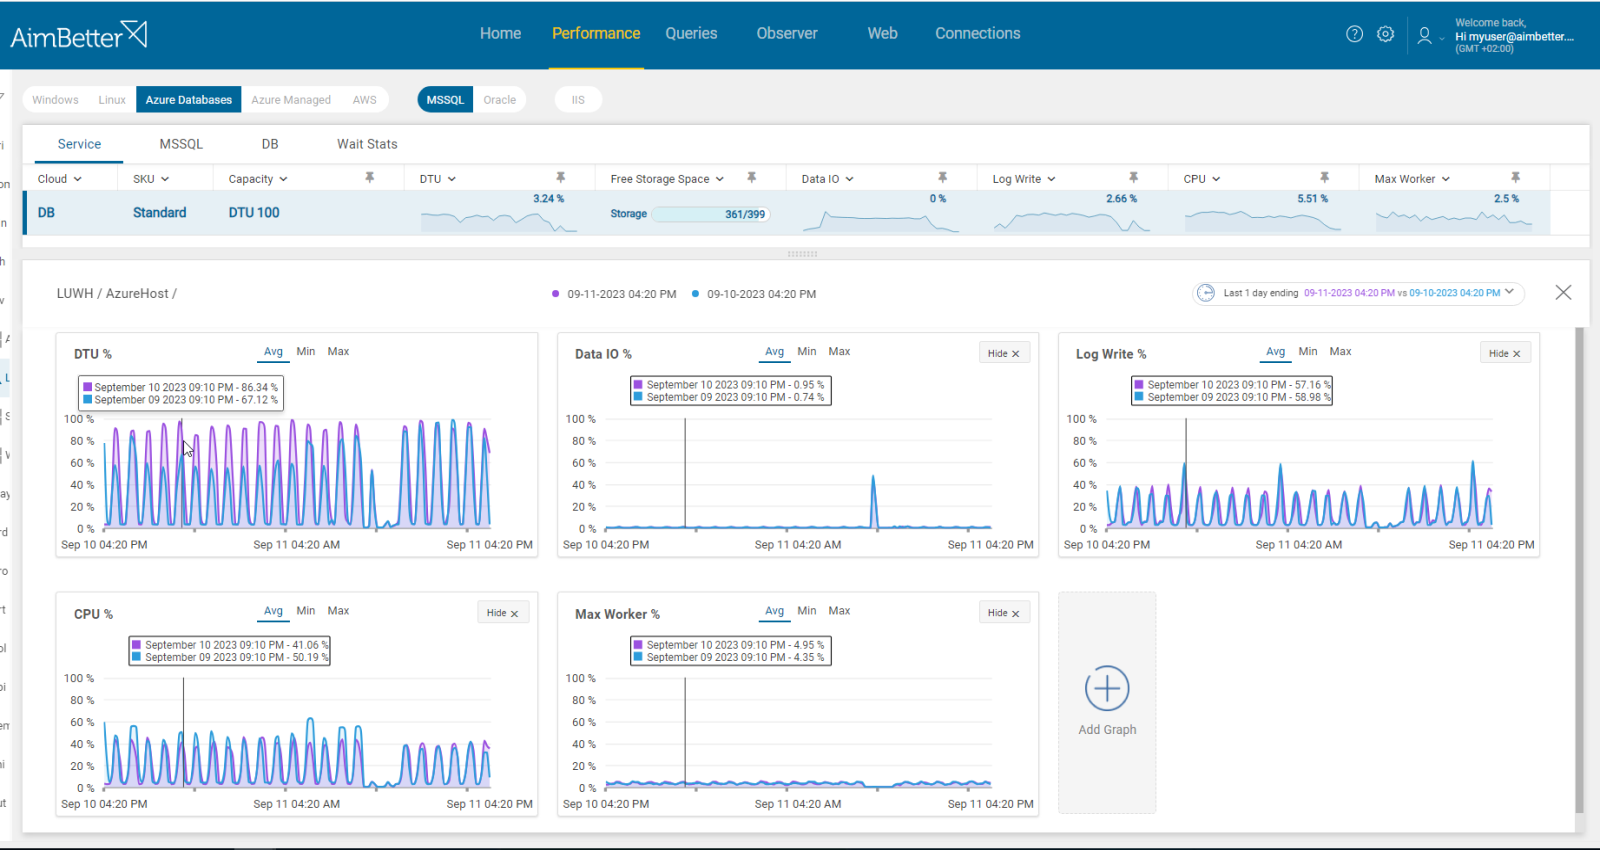
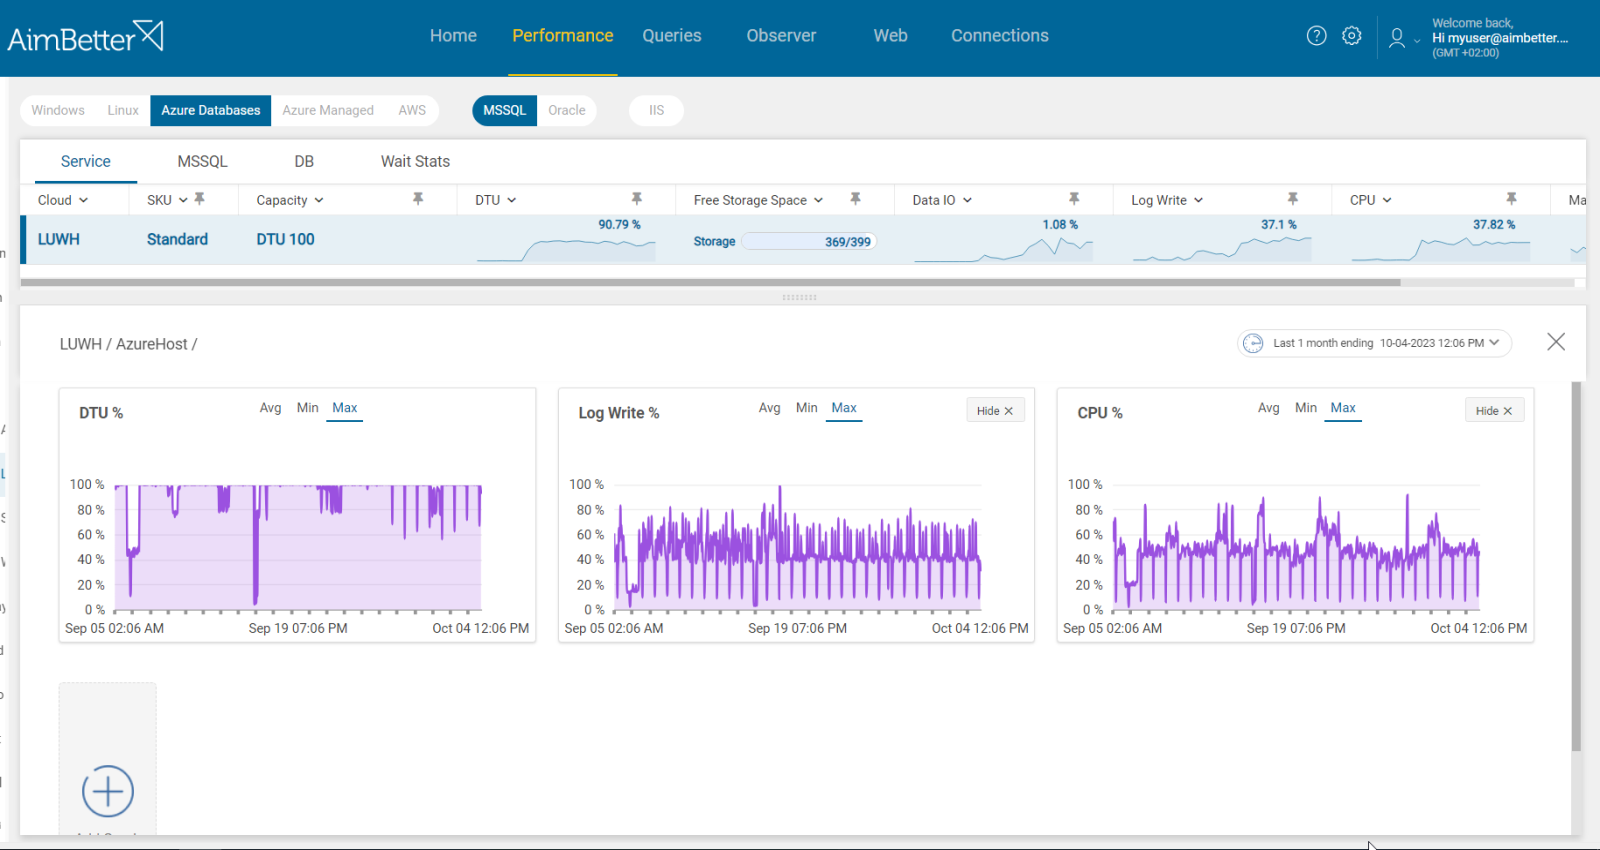
A DTU (Database Transaction Unit) is a bundled performance metric in Microsoft Azure SQL Database, representing a blend of CPU, memory, and I/O resources. It simplifies performance planning by providing a single, scalable unit for estimating the performance level of an Azure SQL Database.
In AimBetter, the resources that affect the DTU values are provided in detail: Data I/O, Log Write, and CPU Utilization. A higher value may indicate overload on the cloud due to intensive performance.
Data I/O measures the percentage of reads and writes that are utilized to the maximum possible from the database’s storage data files.
Log write is a measure of the amount of data written to the transaction log, in percentage, out of the possible writing to the database log at once.
CPU (Central Processing Unit) measures the total task load performed by the cloud instance. The impact of the SQL instance’s workload is shown in percentage.
By closely monitoring these metrics and taking appropriate optimization actions, you can ensure that your database operates efficiently.
Find out how you can save hours of work when investigating the root cause of this issue.
Symptoms :
Operations are running slower than usual, routine operations are performing less well, and users complain about slowness while working with the business applications.
Impact: High
When the DTU is higher, and there is a demand for more tasks to be performed, it might lead to a bottleneck and affect the performance of the database instance and the related applications.
Expected behavior :
For optimal performance, we recommend that the Azure DTU should be less than 70%. However, this demand might be different based on business demand.
Possible causes of high DTU:
1- Queries are too complex. Priority: High
Poor-performing queries can cause high CPU and memory utilization, which in turn can cause high DTU utilization. This might happen because these queries are too complex, missing indexes, have inefficient execution plans, or have inefficient code.
This can include missing or outdated statistics, inappropriate use of joins or subqueries, unnecessary sorting or grouping, or inefficient use of functions
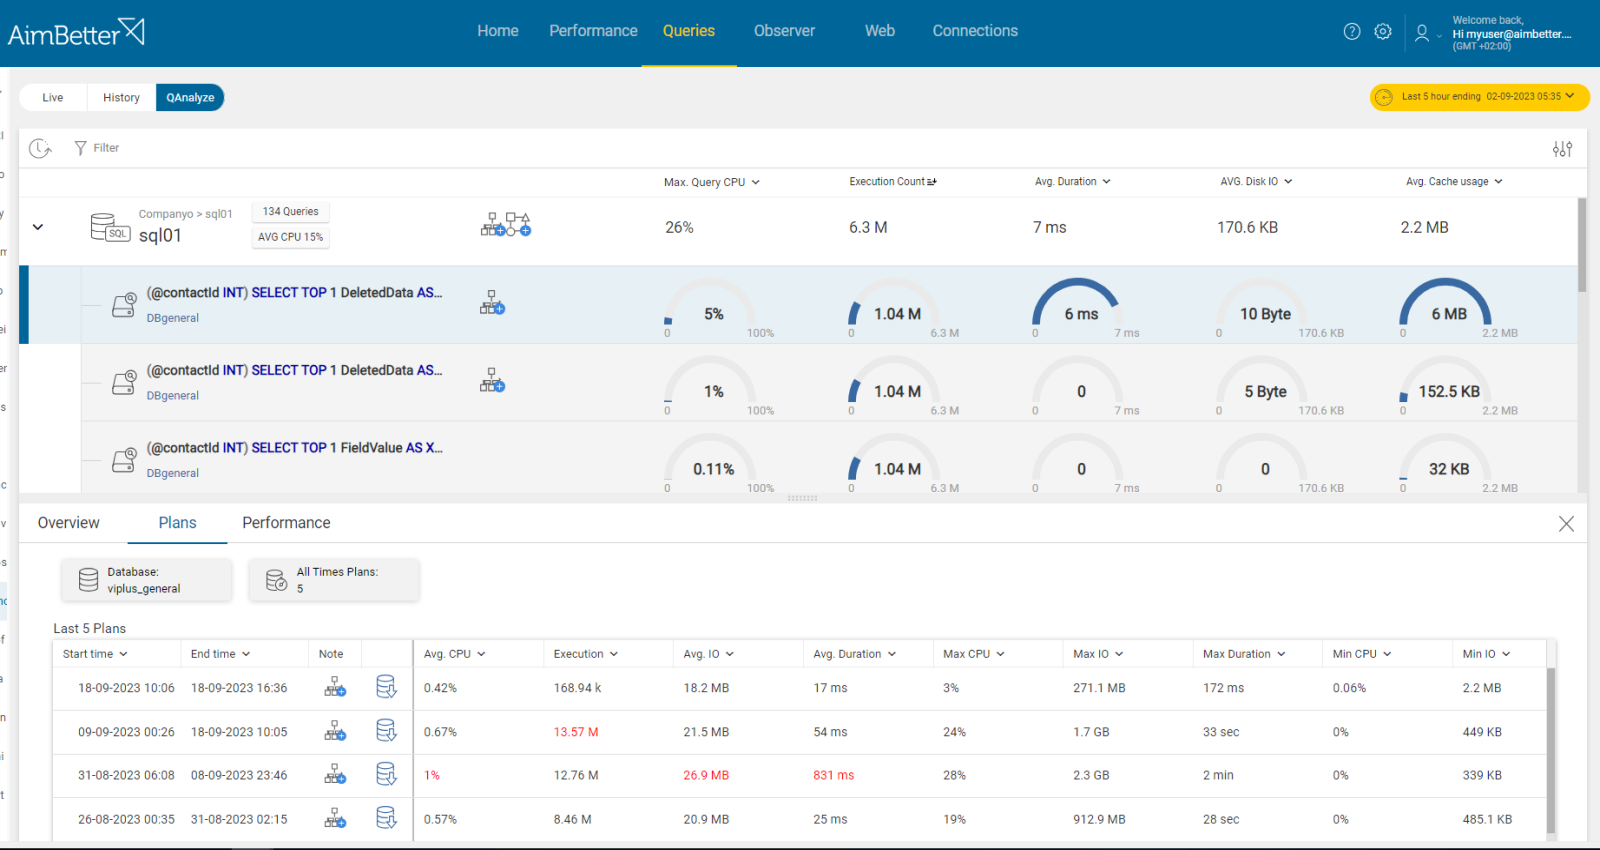
Execution plans provide valuable insights into how the queries are being processed and help identify areas of inefficiency.
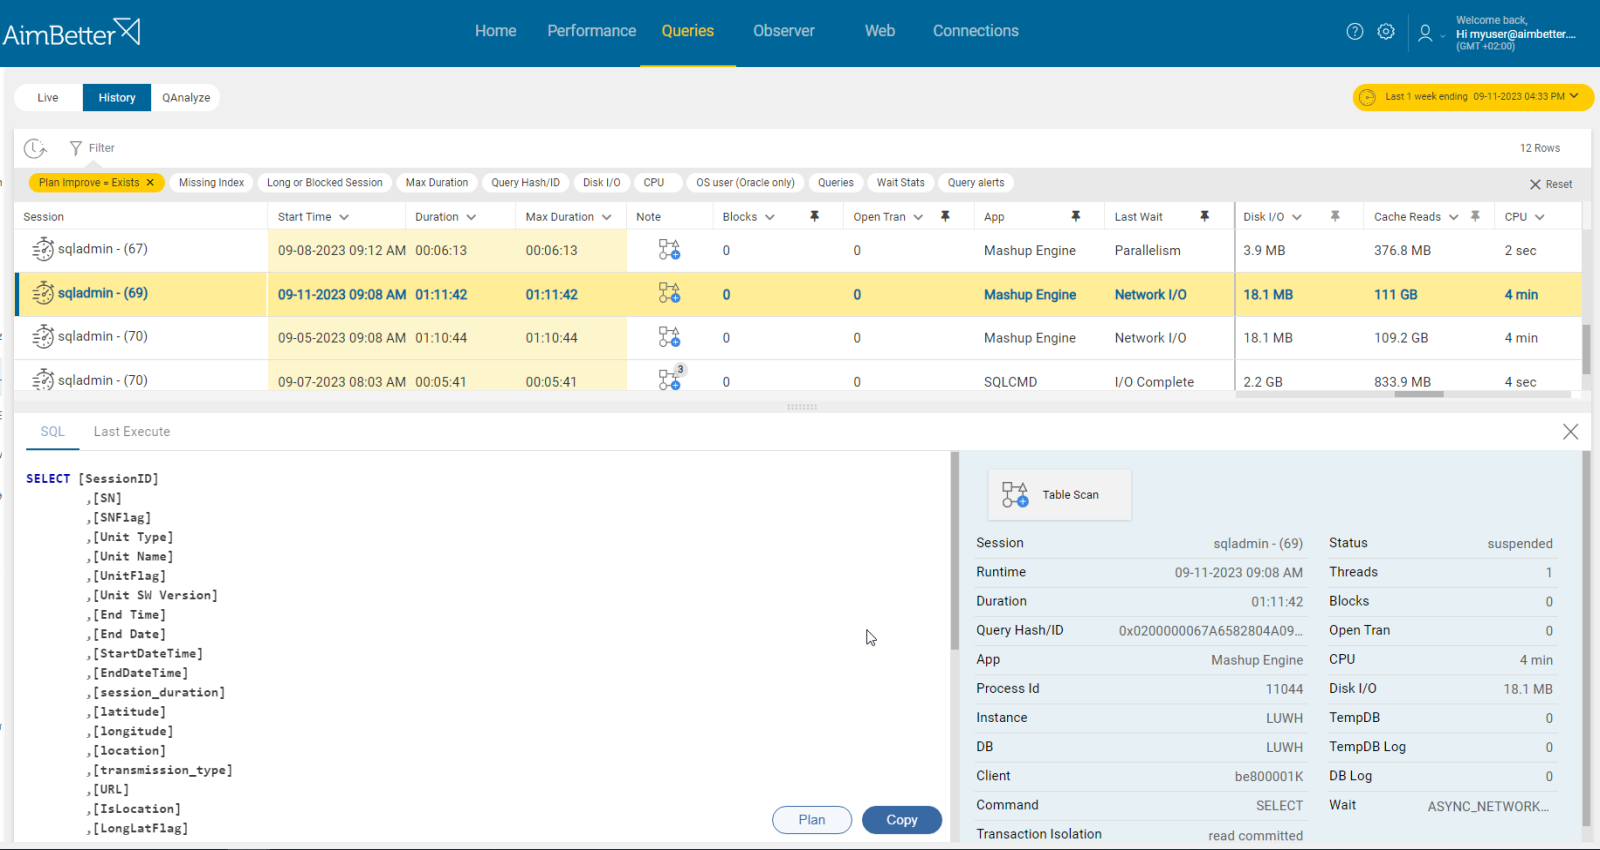
Problem identification:
Identify which queries are running long and whether there is increased DTU usage. Check indexing and query execution plan.
- Use the Azure portal to monitor DTU consumption and performance metrics regularly. Look for periods of high DTU usage. You should also look for which resource is specifically highly utilized: CPU, Data I/O, or Log Writes I/O, so you know what to track when looking for problematic queries.
- Use Azure’s Query Performance Insights tool to analyze queries and their performance. Before doing this, it would be better to focus on a specific resource that seems to be overutilized.
- Other option is using DMVs which will help hint about queries that utilize resources.
- Out of these queries- you need to identify those that run at the same time as the DTU usage gets higher and which queries have complex query code.
- You have to use other programs, such as SSMS, to view and analyze the execution plan. Try investigating it and looking for complex operations.
Recommended action :
Try optimizing queries according to the exact cause of their complexity. Before making these changes, consult a DBA who understands the data model.
- Make sure you are using proper indexes; add or delete indexes if possible and needed.
- Break complex queries into more simple steps.
- Investigate the query’s execution plan and look for heavy tasks and loads of data.
- Review your application code for inefficiencies.
- Make sure to track any changes done by using proper monitoring.
2- Increased Volume and Activity. Priority: Medium
Higher traffic or workload might cause higher DTU utilization. This might be a spike or a stable high utilization, and you should know how to distinguish between these two.
When more queries are running than usual or are too intense for current system resources, it will result in higher DTU utilization. When data modifications happen at a higher rate or frequent transactions happen, it results in overload.
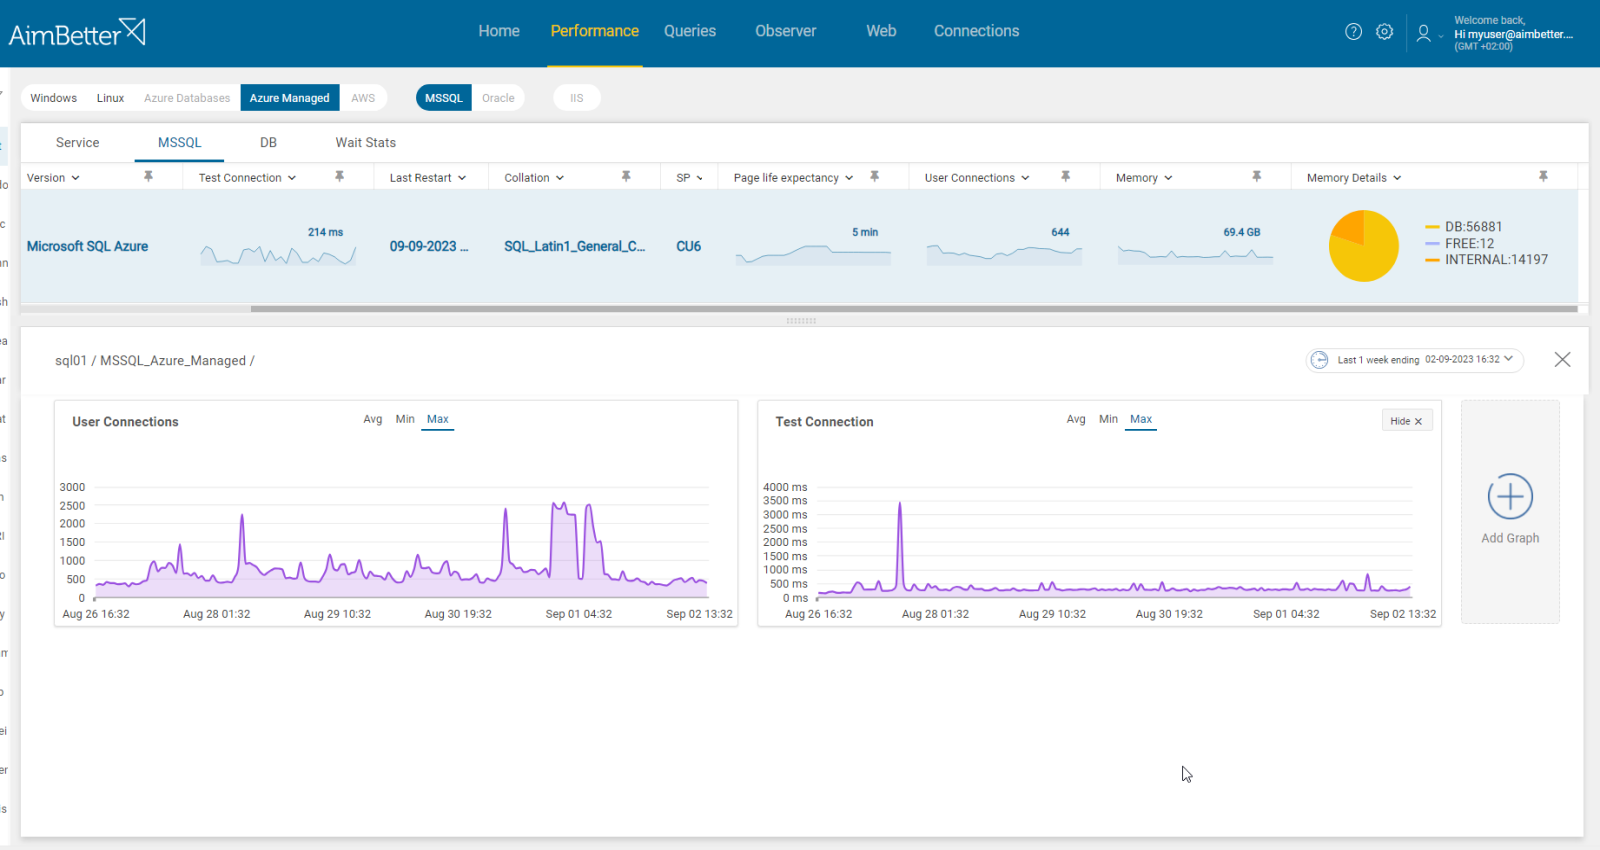
Higher utilization might also occur if the general user’s activity increases due to a higher number of open connections at once.
Problem identification:
Identify patterns of increased Azure activity related to database activity. You should track more queries running than usual involved with a higher user connection count.
- Check via Azure Portal if the number of queries or database connections has increased (compared to past connections).
- Use Query Performance Insights to monitor queries’ performance to identify inefficient ones. Compare past and present performance.
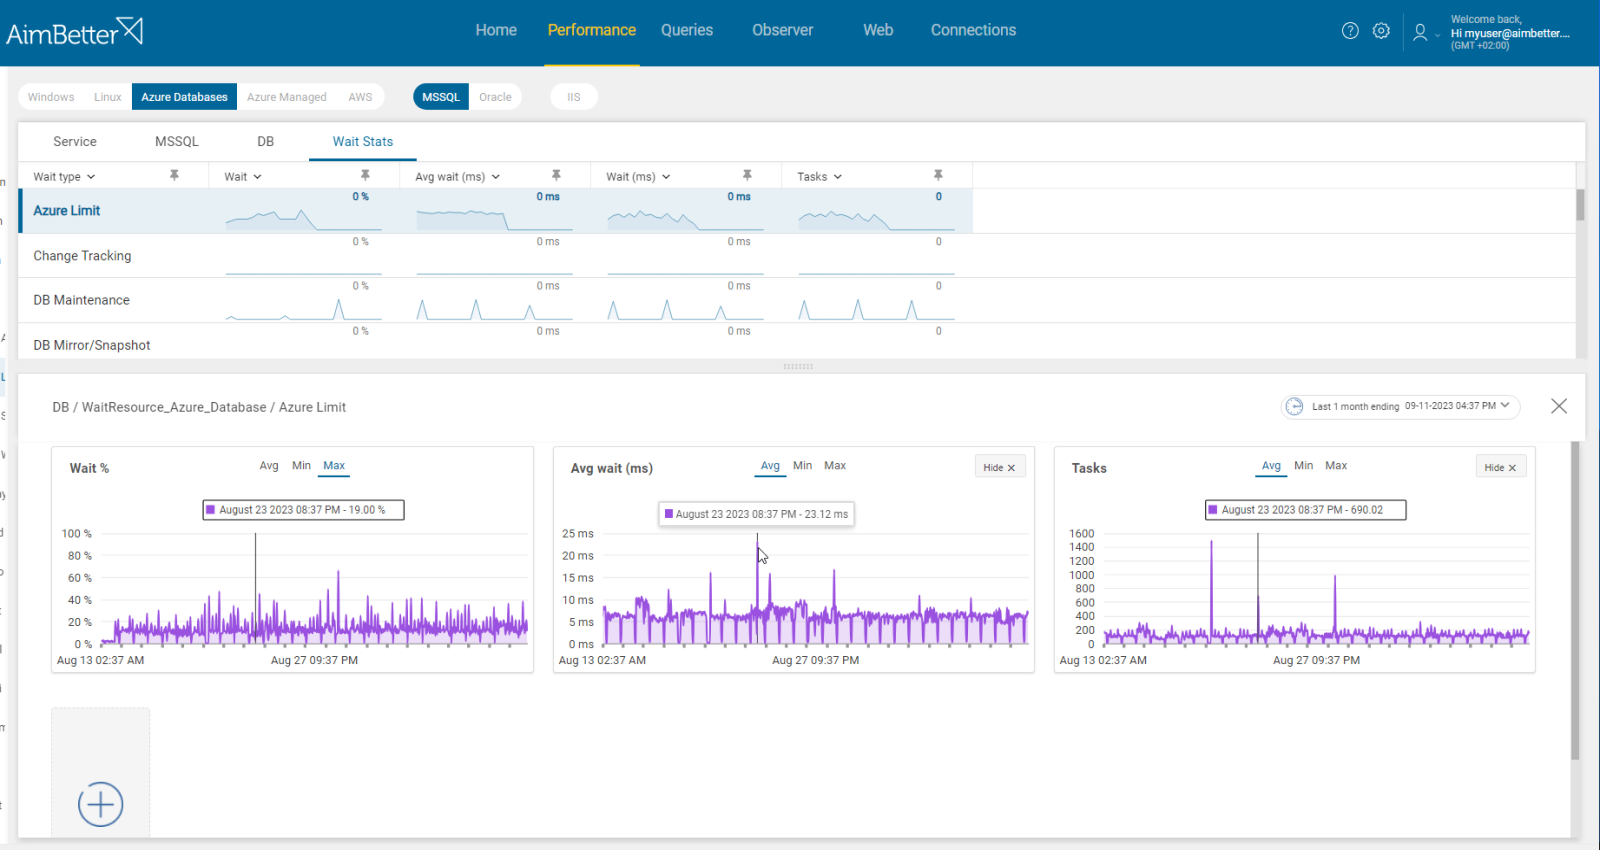
- Check Azure Log Analytics in order to track unusual database activity which might indicate increased activity.
- Try using DMVs to identify queries and which ones seem to be the new ones that increase the total activity of the database engine. Out of these, you should identify which queries caused the DTU to be higher. Take into account that it’s mostly used for live queries only.
Recommended action :
In some cases, it will be just enough to prioritize tasks again and delay those that are not urgent to lower activity times.
Ensure that you are not opening more connections than necessary.
If you have concluded that queries seem to be simple or that all tasks are highly prioritized, proceed to the next cause. You should decide if upgrading the current tier of Azure resources available to your database environment is the only solution.
3- The current version does not fit system demands. Priority: Low
After checking that the cause seems not to be queries’ complexity or higher activity, probably this cause should be taken into account. If your Azure is experiencing high DTU utilization and you can’t solve that- consider checking if upgrading the tier or resources would be an appropriate solution.
Azure has several service tiers and performance levels – these impact the maximum azure DTU available.
Problem identification:
Identify routine performance involved with high DTU utilization constantly.
- Use the Azure portal to monitor DTU consumption and performance metrics regularly. Look for periods of high DTU usage and check whether the overload is temporary or routine.
- Use Query Performance Insights to monitor queries’ performance to see if they are inefficient. If a query seems to be efficient yet the DTU values are still high, then it’s probably not the problem’s source.
- Check Azure Log Analytics in order to make sure the database activity is usual.
- Take into account that Azure doesn’t automatically recommend or alert you to upgrade your Azure service tier. However, you might use the Azure Advisor service to get best practice recommendations that can hint you about this issue.
Recommended action :
Regularly monitor your database performance using Azure Monitor and Query Performance Insights.
The selected service tier and performance level (Basic, Standard, Premium) impact the available DTUs.
Before deciding to upgrade your tier, which is a costly solution, you should carefully consider performance requirements—maybe lowering the work demand or dividing it differently would help.
Else, you can implement Azure Autoscale. It can automatically scale your resources in or out based on defined rules.
4- Open transactions for more time than needed. Priority: Low
In cases when transactions remain open for too long, it might hold onto resources and cause an overload on the system. You can read more in the article SQL Queries Open Transaction.


