Transactions are committed by SQL when successful or rolled back when not (if they encounter errors or are explicitly canceled).
Unless a resource they need is locked, they shouldn’t be idle.
When transactions are committed, their changes are written to the log files. As long as the oldest transaction among the transactions in memory is open, the log file(s) continue to grow, and the newer committed transactions remain in the log file(s) and do not get cleared. This is one of the main causes for running out of disk space.
Find out how you can save hours of work when investigating the root cause of this issue.
Symptoms :
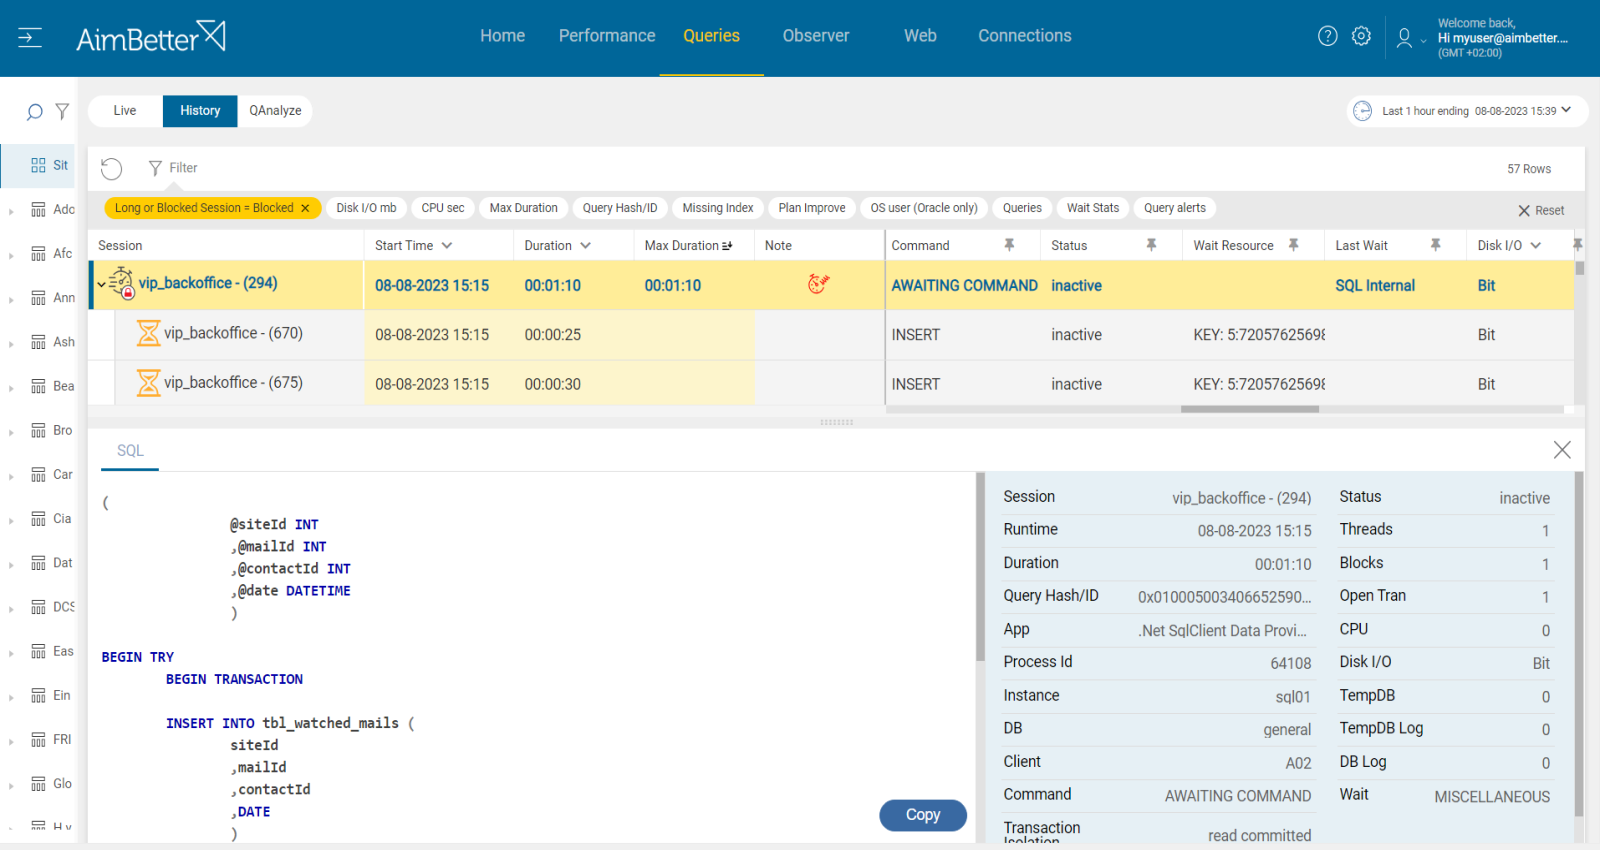
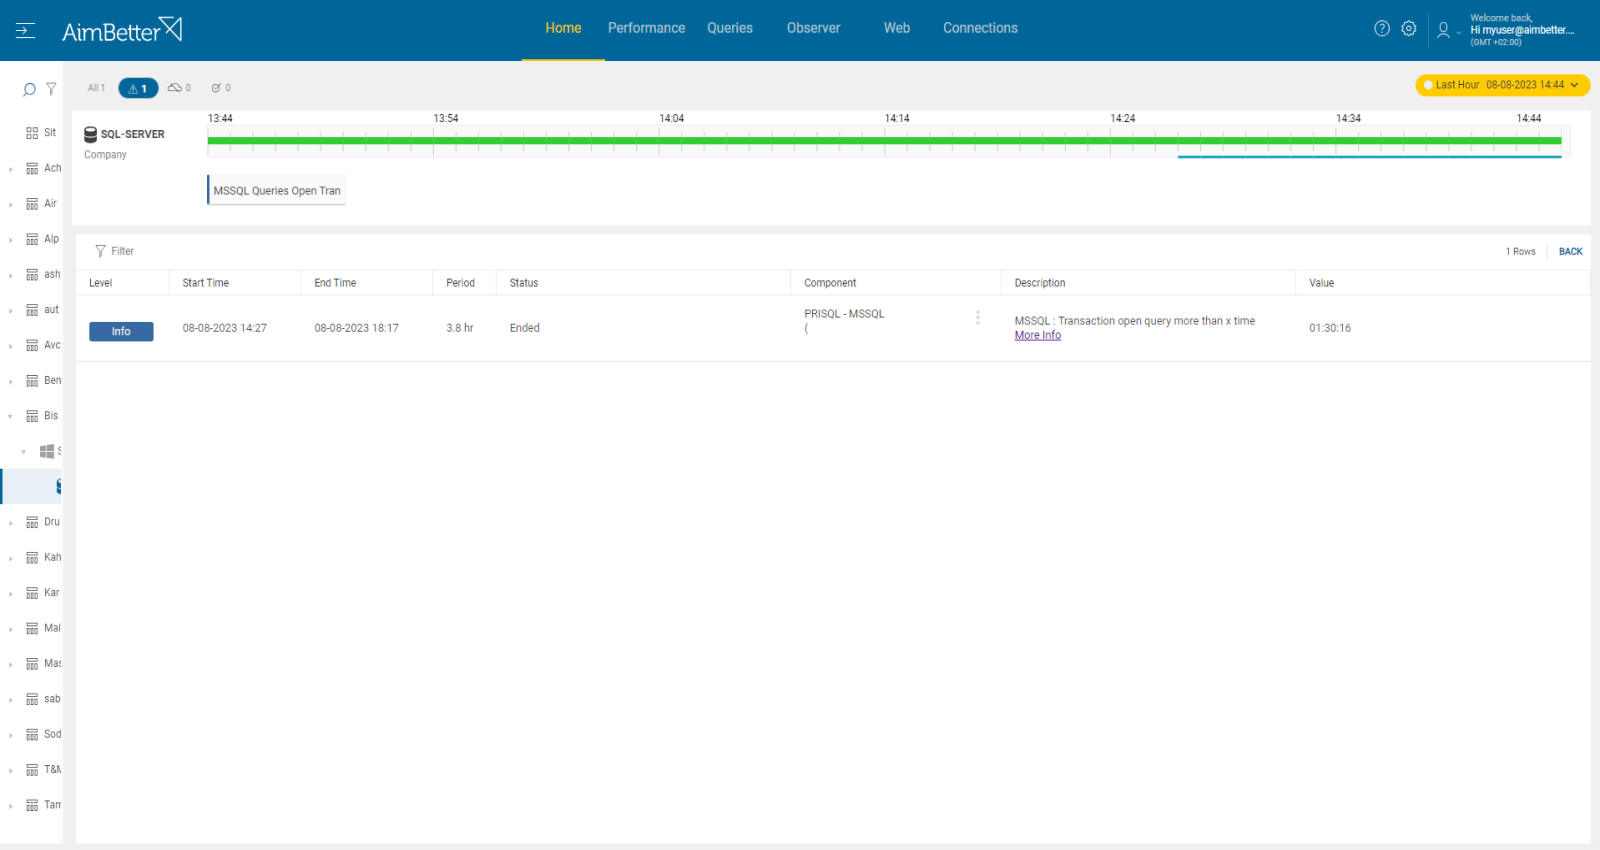
A transaction is not committed and not rolled back, remaining open and idle and using resources that could have been freed up for other processes. SQL functions are running slower, affecting user response times and degrading performance.
Impact: Medium
Slow SQL responses will degrade the user experience, resulting in poor organization operations efficiency.
Other queries that depend on the not-yet-committed transaction will use data that is not up to date, and errors might be caused.
In some cases, log files keep inflating, leading to full disks.
Expected behavior :
SQL imposes no absolute limits on the time needed to commit any query. For this reason, use past performance and current behavior to set appropriate threshold levels to handle all possible cases.
Possible causes of open transactions:
1- Something prevented the transaction from being committed. Priority: High
Transactions might remain open and be prevented from being committed by several possible causes:
- Transactions can read uncommitted data and, if not handled properly, leave the transaction open.
- In cases when a transaction holds locks on resources (rows or tables), it might cause blocking to other transactions and remain open for an extended time.
- If the application does not handle exceptions properly or crashes suddenly, it might fail to commit or roll back transactions, leaving them open.
- Failure in coordination between distributed transactions, which involves multiple nodes from different sites, can lead to open transactions.
Problem identification:
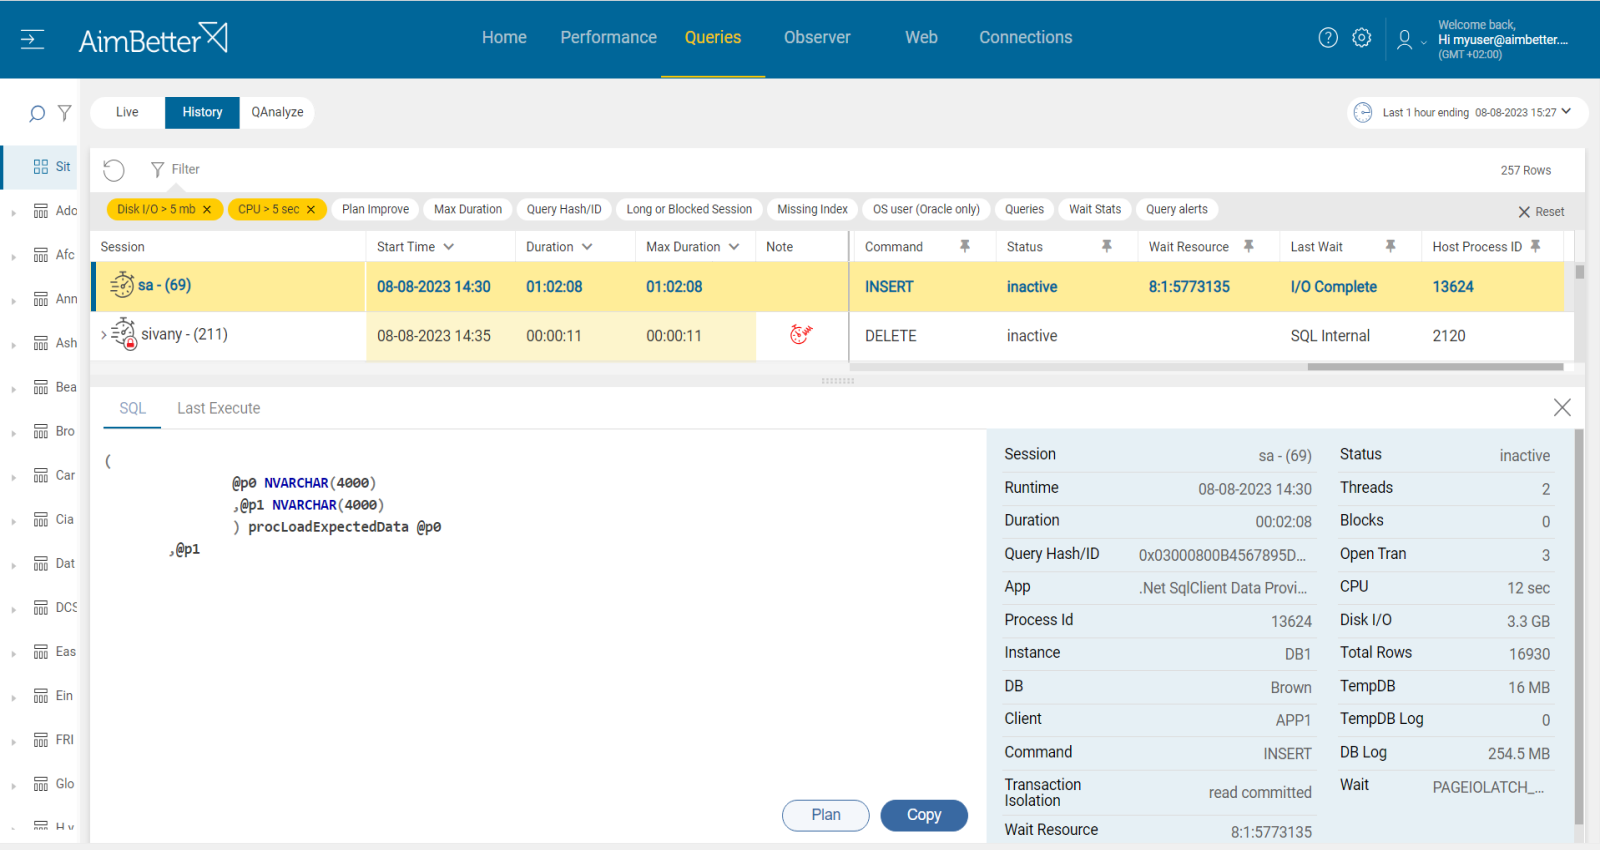
Identify a query with an open transaction that is running longer than expected and its cause (see above possibilities).
- Use tracking tools (such as SQL Server Profiler for SQL Server, for Oracle you can use Enterprise Manager or Automatic Workload Repository) in order to identify queries transaction isolation with read uncommitted. It may take you some time since you have to prioritize these events (by duration or resources) and make sure you have all details needed.
- Check if the transactions are blocking or blocked queries by using different DMVs (Dynamic Management Views) or V$ views (dynamic performance views). You can analyze the queries, locks, and resource usage to determine the cause of the blocking. Take into account that you don’t have historical data to compare with.
- Depending on the situation, you might need to optimize the queries.
- Check for application logs, event viewer (for Windows OS), or journalctl and /var/log/, views (For Linux), or error logs of the SQL server or Oracle in order to track application errors involved with open transactions in the period of time that the transactions are open.
Recommended action :
Check what else is running that might block the resources needed by the open transaction.
Use appropriate isolation levels to balance concurrency and transaction duration.
Analyze the application error logs and investigate how to prevent the errors from occurring again.
2- Inefficient query design or indexing Priority: High
Inadequate query code may result in inefficient data access. Queries that are not properly optimized with inefficient query execution plans (including missing indexes) can lead to poor performance, increased resource usage, and keep transactions open for long periods. If COMMIT or ROLLBACK statements are missing in the query code, transactions will remain open.
Problem identification:
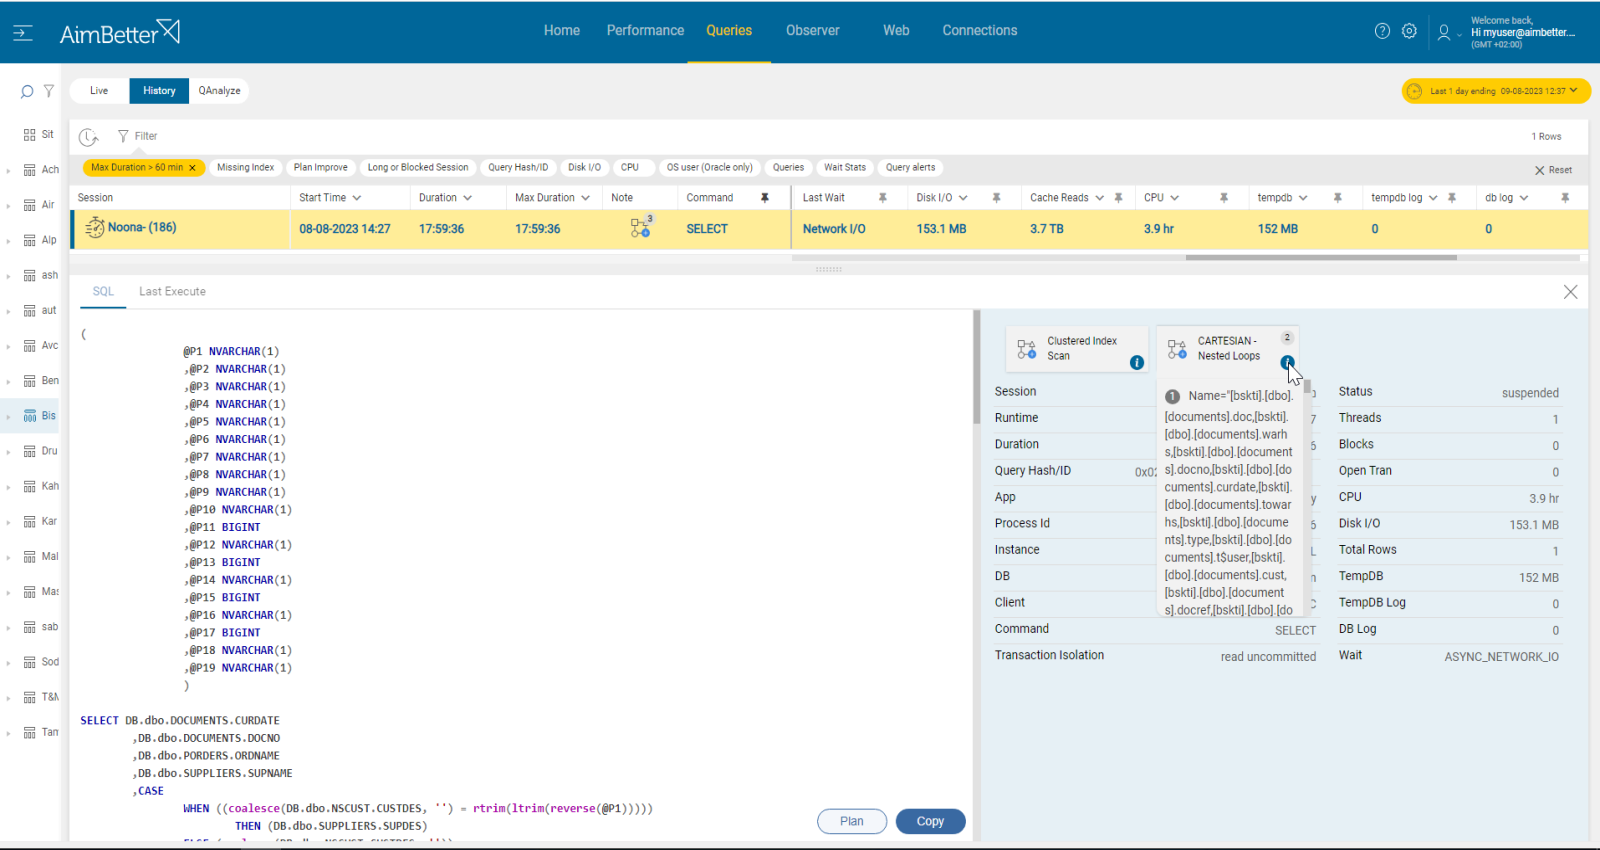
Identify which queries are running long with open transactions and whether there is increased resource usage. Check indexing and query execution plan.
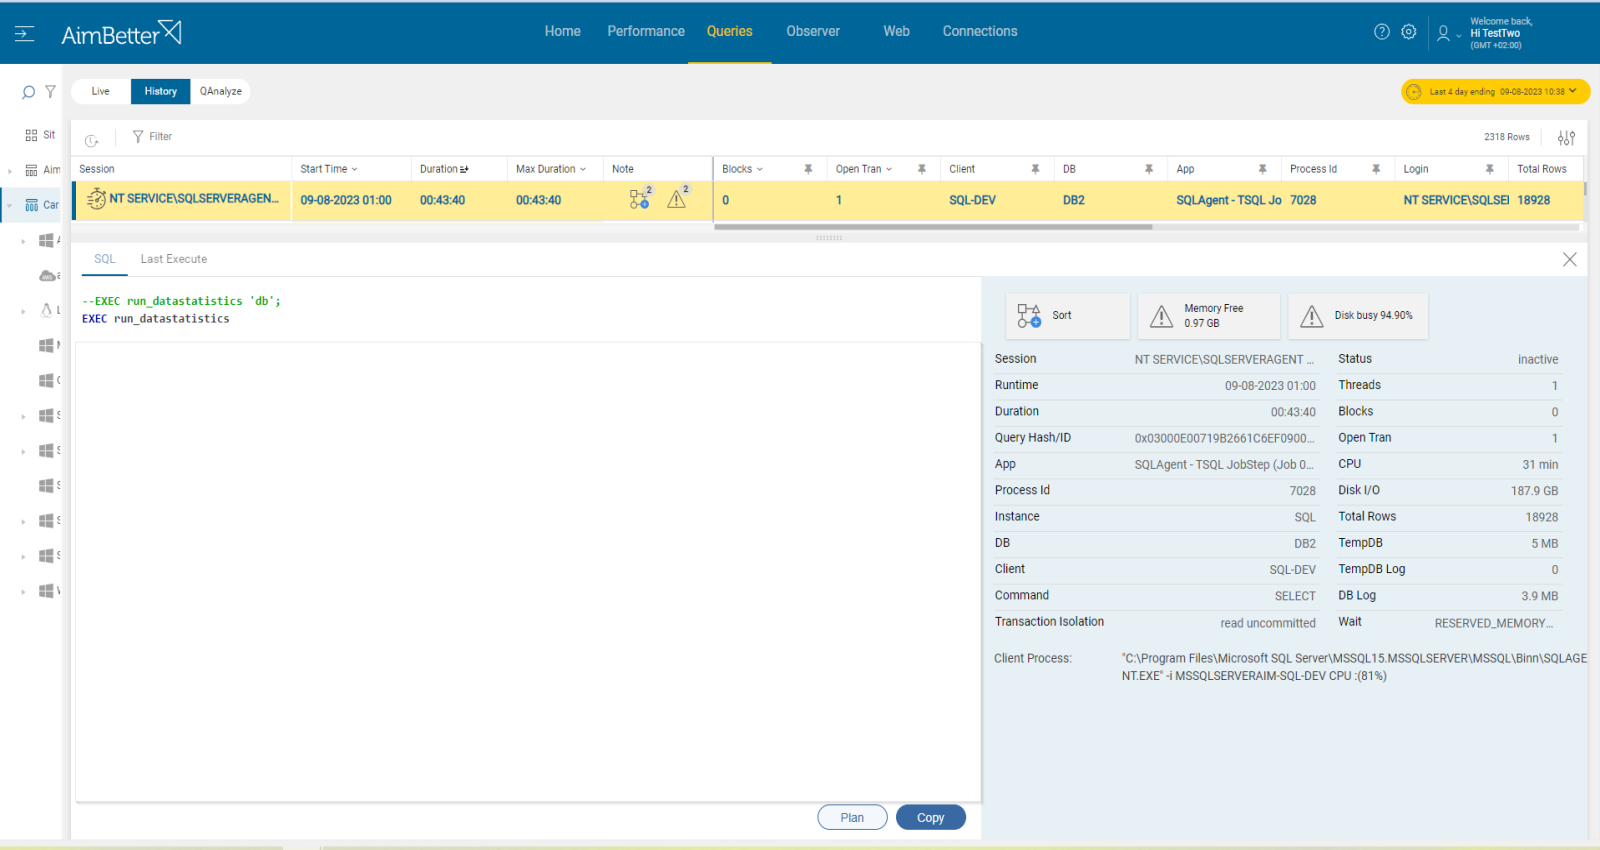
- Track the database server activity: identify which SQL statements have high execution time, and track also on transaction id and consumption of resources. For SQL Server, you can use the built-in activity monitors or SQL Profiler. For Oracle, you can query with ‘V$TRANSACTION’ command seeing live open transactions or use Oracle Enterprise Manager to track open transactions. This mission might be complicated and take hours or days of work, requiring a highly skilled DBA.
- Investigate the query code and execution plan, trying to look for missing indexes or excessive subqueries. In order to get this data, you have to run the query live again from the management studio, which might increase the overload and the investigation time of this issue. Also for Oracle, you should run the query again in order to receive both the execution plan and performance statistics, using SQL*plus or SQL Developer. You should know how to use a query execution plan and find problems in it in order to utilize it wisely for performance improvement.
- Examine index usage and fragmentation: Evaluate the usage and fragmentation of indexes in the database. Unused or fragmented indexes can impact query performance.
- Investigate the query code – check if it includes commit or rollback statements.
Recommended action :
Make sure that each transaction has COMMIT (in case of no errors) and ROLLBACK (in any case of an error) statements where applicable.
Check what are the bottlenecks of the long-running queries, and try to optimize long-running queries accordingly.
Break complex queries into more simple steps in order to reduce their execution time and the likelihood of keeping transactions open for extended periods. Queries that involve a large number of rows, fields, or repeats should be minimized.
Detect missing indexes by looking at the execution plans. Check out our article about long-running queries.
3- Deadlocks Priority: Low
Deadlock happens when multiple processes or threads are waiting for resources that are held by one another.
There might also be distributed deadlocks which happen when a distributed query involves multiple nodes and requires data from different sites.
When working with several applications and environments, there is a higher chance that a transaction will be involved in a deadlock situation. The transaction might remain open until the deadlock is resolved.
Problem identification:
Identify queries that have open transactions and are involved in a deadlock situation.
- Use tracking tools in order to capture deadlocks. For SQL Server, you can use SQL Server Profiler. For Oracle, you can check trace files or use OEM. When doing it, take into account that dealing with the past deadlock isn’t possible – it will either have to be re-created, or you will have to wait for the next time it happens. In addition, SQL Server logs information about deadlocks to the error log, which you could try to check.
- Check which of the deadlocks had open transactions by filtering for them.
- Try to find a way to optimize the query code by viewing the query execution plan. This task might be complicated if you are not a DBA.
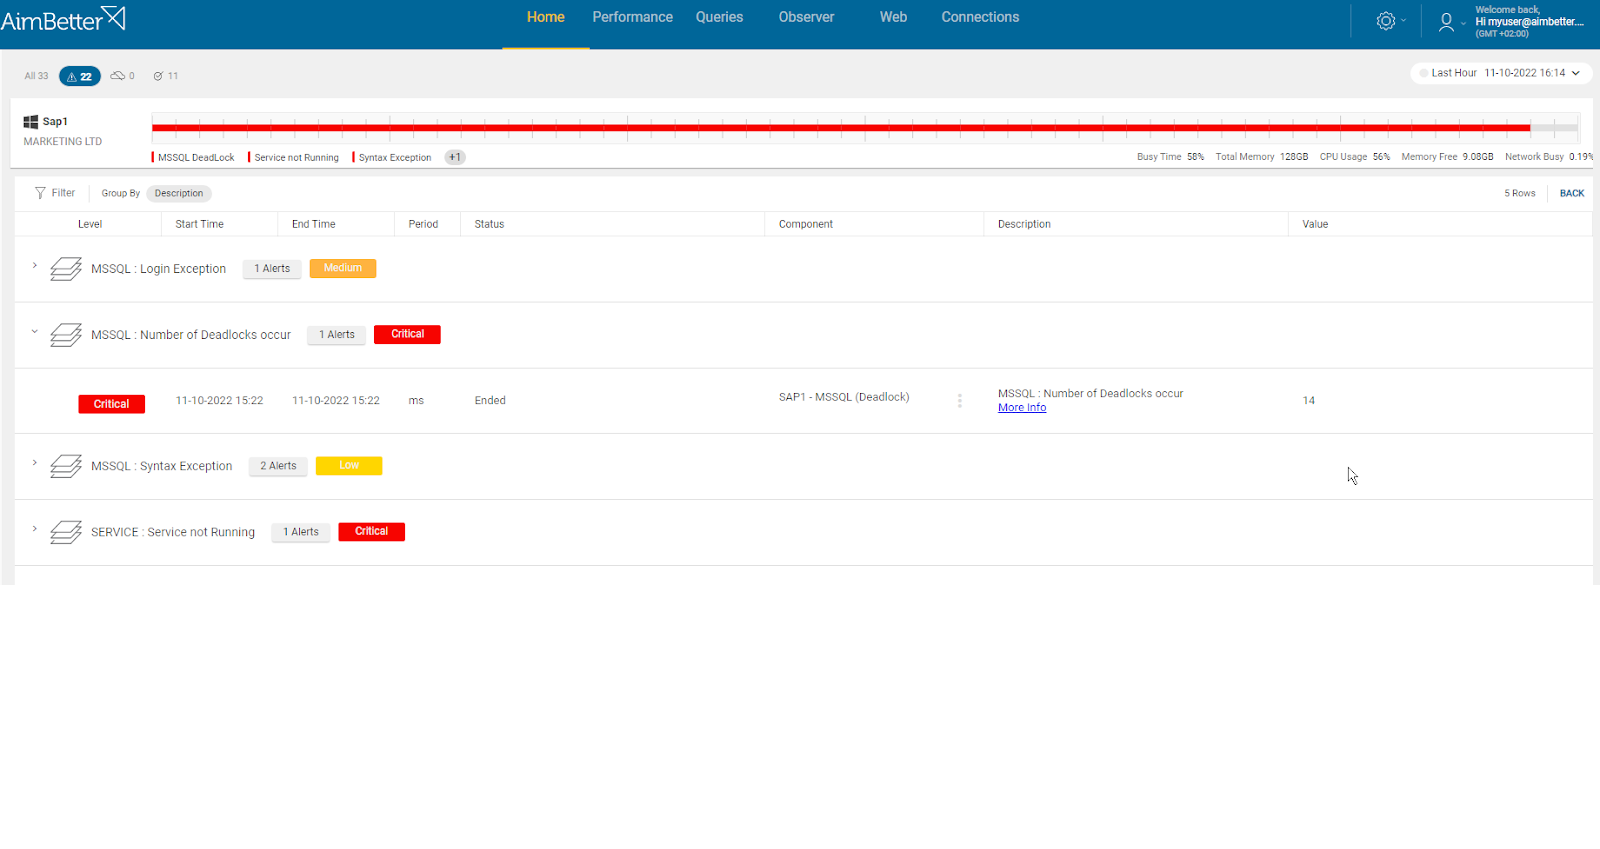
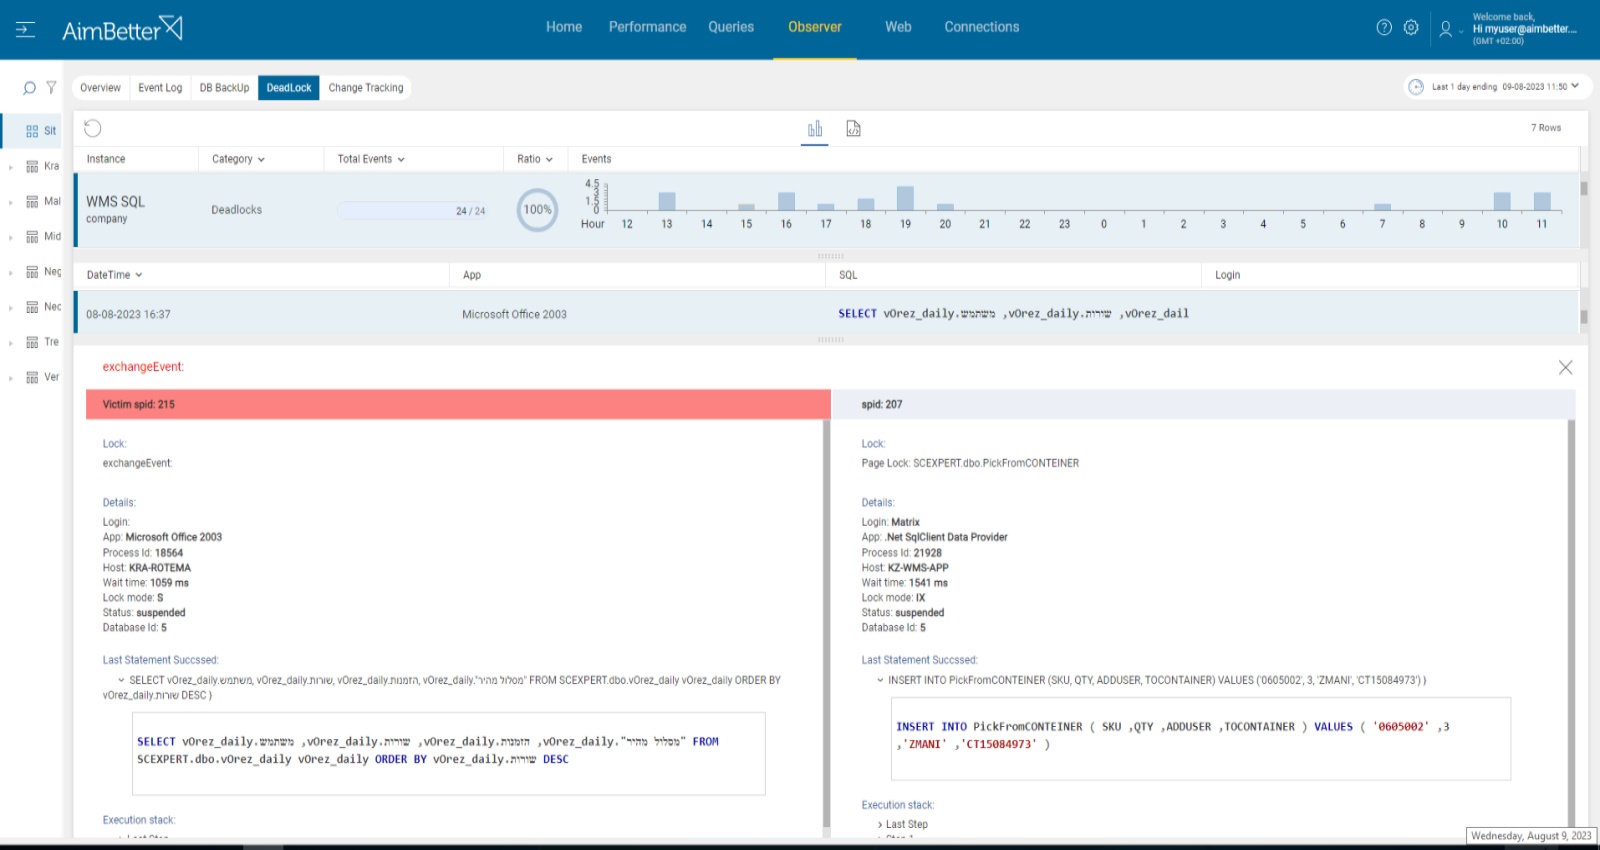
From the AimBetter monitor, you can drill down into any transactions involved in a deadlock, the query’s running time, and full details, while identifying both the killed one and the surviving one.
You can also view deadlocks that have occurred in the recent past without having to reproduce the issue because with AimBetter, all deadlocks are logged and stored in the cloud for as long as you have selected.
Recommended action :
Here are some possible solutions when identifying deadlocks with open transactions, :
– Set a timeout for each transaction.
– Write a script that identifies transactions that are deadlocked and then take actions such as rolling back one of them.
– Assign priorities to transactions. When a deadlock situation arises, transactions with lower priority can be rolled back. If these are not possible, focus on preventing deadlocks by carefully designing the application and system. In addition, you should monitor these cases over time.
For more information, check out our article about deadlocks.
4- Exception happened while the transaction was open. Priority: Medium
Exceptions are unexpected events that can disrupt a program’s activity. If an exception occurs within the transactional block and is not properly handled, it may prevent the transaction from being committed or rolled back.
Problem identification:
Identify data inconsistencies that could be a sign that an exception occurred within a transaction.
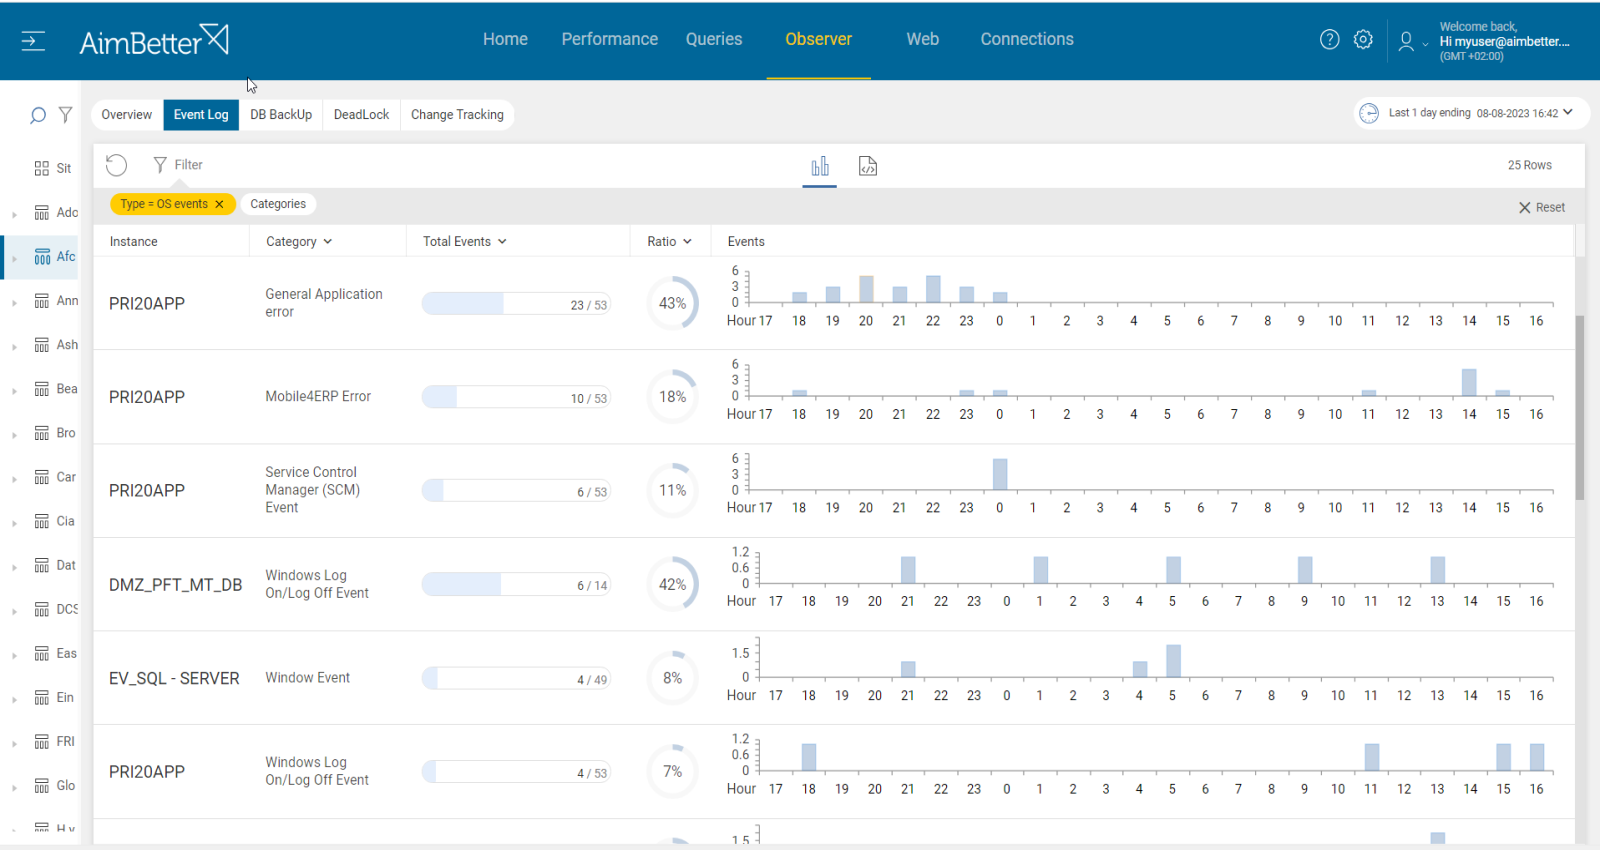
- Check the application’s logs and error messages. You are also able to check the event viewer (in Windows OS). For linux, you can use ‘journalctl’ to view system logs or ‘/var/log’ which is Linux temporary store of logs.. It might be hard to track since you have to know where to search for it and what to look for.
- Transactions that remain open for an unusually long time might be indicative of an exception preventing their proper completion. You can monitor it using DMVs or V$ views (dynamic performance views). Else, you can use tracking tools such as SQL Server Profiler or Oracle Enterprise Manager. You should do that with a professional DBA.
- Investigate the error message that arises with the exception and check what might cause it.

Recommended action :
Investigate the exceptions and try to prevent them from occurring again. Encourage code reviews to ensure that both error handling and transaction are implemented well.
5- Overloaded or wrongly set hardware resources. Priority: High
Overloaded server resources such as CPU, memory, disk I/O, or network can slow down query execution. It might happen due to a specific application or many processes running at the same time. These processes might be external operations such as anti-virus scans, backups, and restores from networked data stores.
In other cases, the resource settings may not fit the requirements of the instance operation—for example, not enough cores or improper settings of disks.
If the OS resources are low, particularly memory and CPU, the database might struggle to allocate the necessary resources to complete the transactions, which might be left open and incomplete.
.
Problem identification:
Check if CPU, memory, disk I/O, or network resources are highly utilized. Identify the source of the load and if it is recurrent. Try to reschedule heavy tasks to a time of low user demand.
- Check the Task Manager in order to identify the overload of hardware resources. For Linux, you can check with the commands “top” for CPU, “free” for Memory, “iostat” for Disk I/O, “vmstat” for Virtual Memory statistics, and “nload” Network.
- Use OS tracking tools such as Performance Monitor (for Windows OS ),or Performance Co-Pilot(For Linux) , in order to identify which processes use hardware resources. For network activity, use a network monitoring tool, and check how much traffic flows through your network and which applications or devices use the most bandwidth. Take into account that most tools help pinpoint when a problem starts, with which you can’t compare to old time frames.
- Check whether the long-running queries wait time is for a specific hardware resource and which hardware resource is more utilized than others while the query is running. For that, you should be using tracing tools such as SQL Server profiler (for SQL Server), or Oracle Enterprise Manager. This step might be completed and take time, and the result probably won’t be precise while checking only online statuses.
Recommended action :
Cancel unnecessary programs that cause high hardware utilization. Where possible, reschedule non-essential activity (e.g., virus scans, backup, etc.) to hours of lowest SQL demand.
Consider upgrading hardware if possible.
It’s important to make sure that the database system has sufficient resources available, including memory, CPU, and disk space.
Monitoring would be useful to follow up on this issue and prevent situations when there is low availability of OS resources.


