A deadlock occurs when two or more processes compete for exclusive access to a resource but cannot obtain it because some other process is preventing it. This results in a standoff where neither process can proceed. The only way out of a deadlock is to terminate one of the processes.
SQL Server automatically searches for deadlocks (in the process called LOCK_MONITOR) and looks for deadlocks repeatedly. For Oracle, deadlock events are described in the instance logs and trace files. It looks at all waiting locks to determine if there are any cycles. When it detects a deadlock, it chooses one of the transactions to be the victim and sends a message to the client who owns the connection. This transaction is then terminated and rolled back, and all the resources on which it held a lock are then released, allowing the other transaction involved in the deadlock to continue.
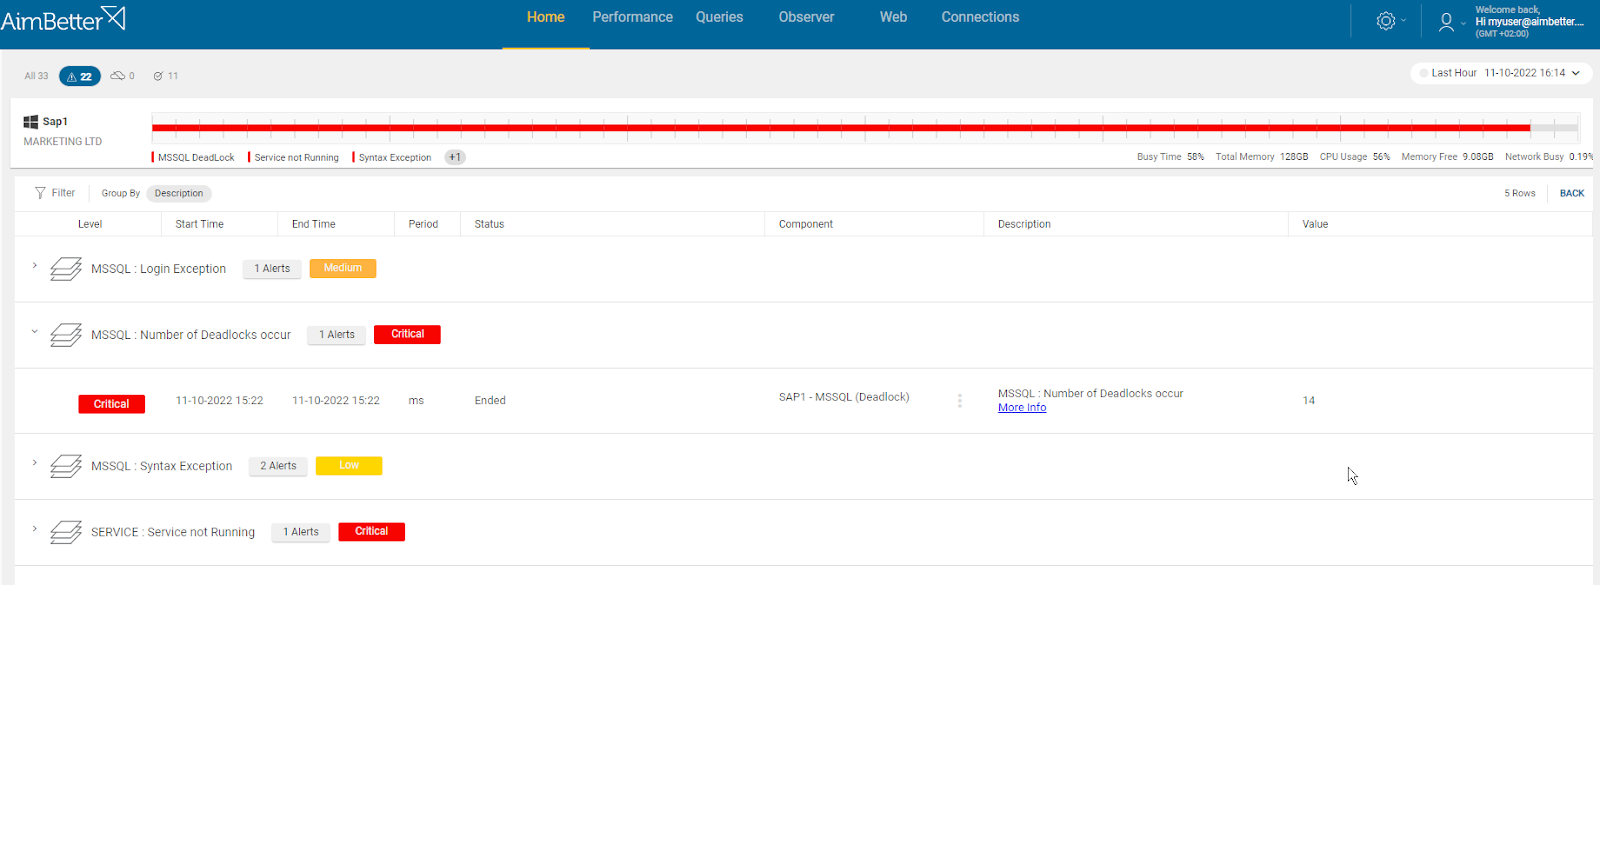
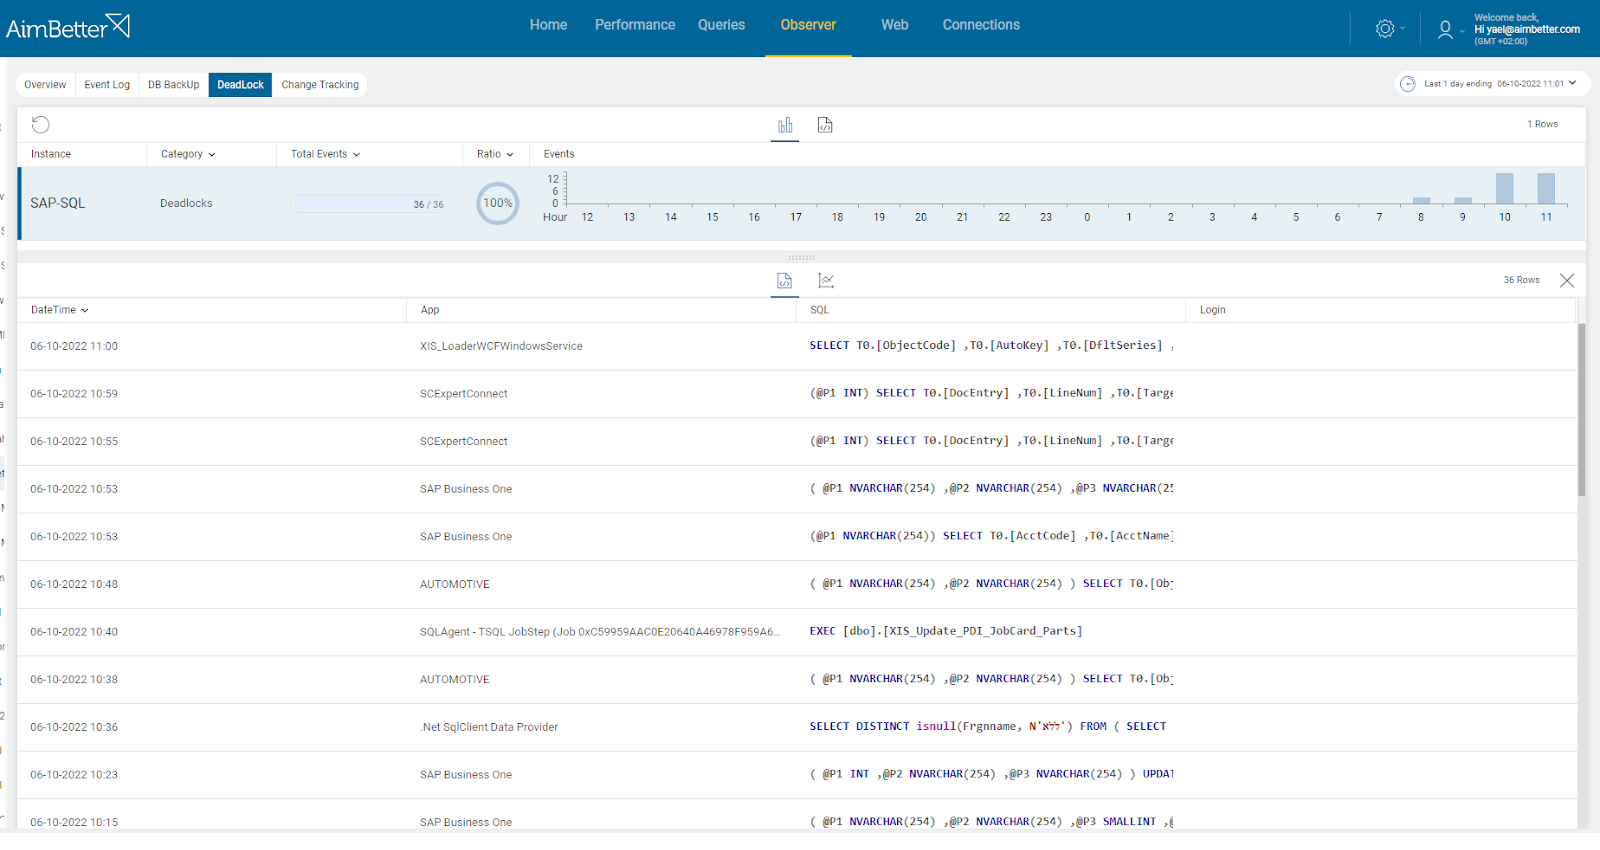
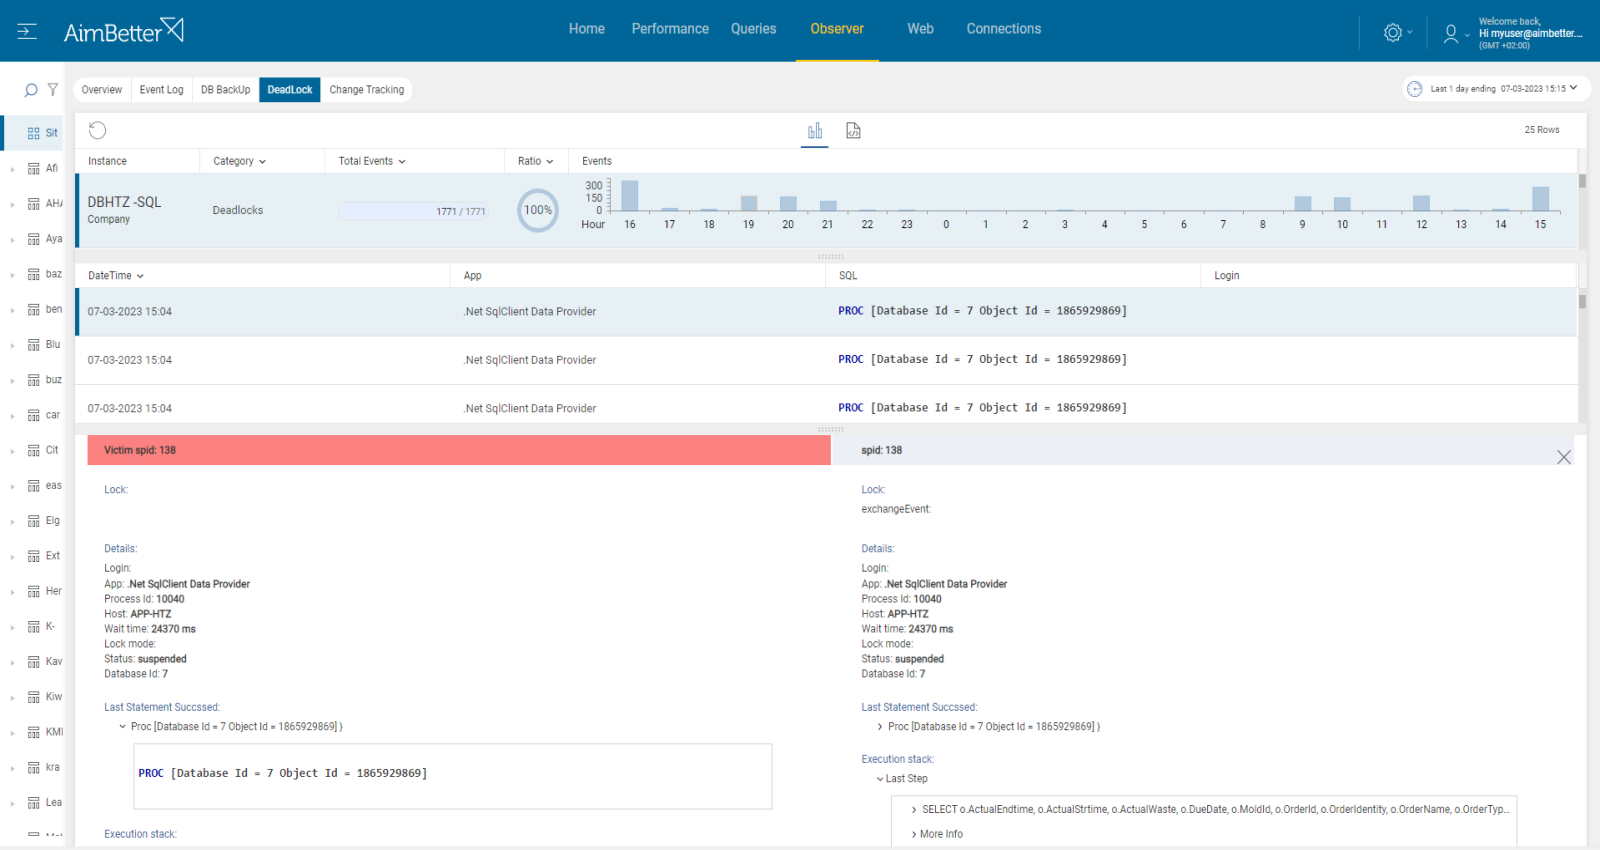
From AimBetter monitor, you can drill down into any transactions involved in a deadlock, identifying both the killed one and the surviving one. You can also view deadlocks that have occurred in the recent past without having to reproduce the issue because all deadlocks are logged and stored in the cloud for as long as you have selected.
Find out how you can save hours of work when investigating the root cause of this issue.
Symptoms
SQL is temporarily unavailable for some users due to the deadlock.
Impact: Medium
As well as delays experienced by users, there is a possible loss of data when SQL acts to roll back one of the locked elements.
Expected behavior :
Deadlocks are not expected. This alert needs to be investigated, especially checking data integrity. The longer a query runs, the more susceptible it will be to creating a deadlock. In addition, deadlocks and blocking query events might happen parallelly.
Possible causes:
1- Inefficient query design and Long SQL Tasks Priority: Medium
Incorrect query code may result in inefficient data access. In addition, SQL processes might cause overload on the CPU due to long tasks performed, such as :
– Accessing data where indexes are missing or corrupt, causing long loops.
– Pulling large volumes of data, resulting in many threads or long loops
– Coding problems due to inefficient organization or missing indexes causing many threads or long loops
Problem identification:
Identify the long-running queries involved in deadlock events. Check if it’s happening in parallel to the CPU load.
Hands-on approach
- Use tracking tools in order to capture deadlocks. For SQL Server, you can use SQL Server Profiler, for Oracle, you can use the trace files that Oracle generates containing deadlock information. When doing it, take into account that dealing with the past deadlock isn’t possible – it will either have to be re-created, or you will have to wait for the next time. In addition, SQL Server logs information about deadlocks to the error log, and you should try to check it also.
- For specific Oracle or SQL Server versions, there is an activity monitor which can be used in order to view deadlock information.
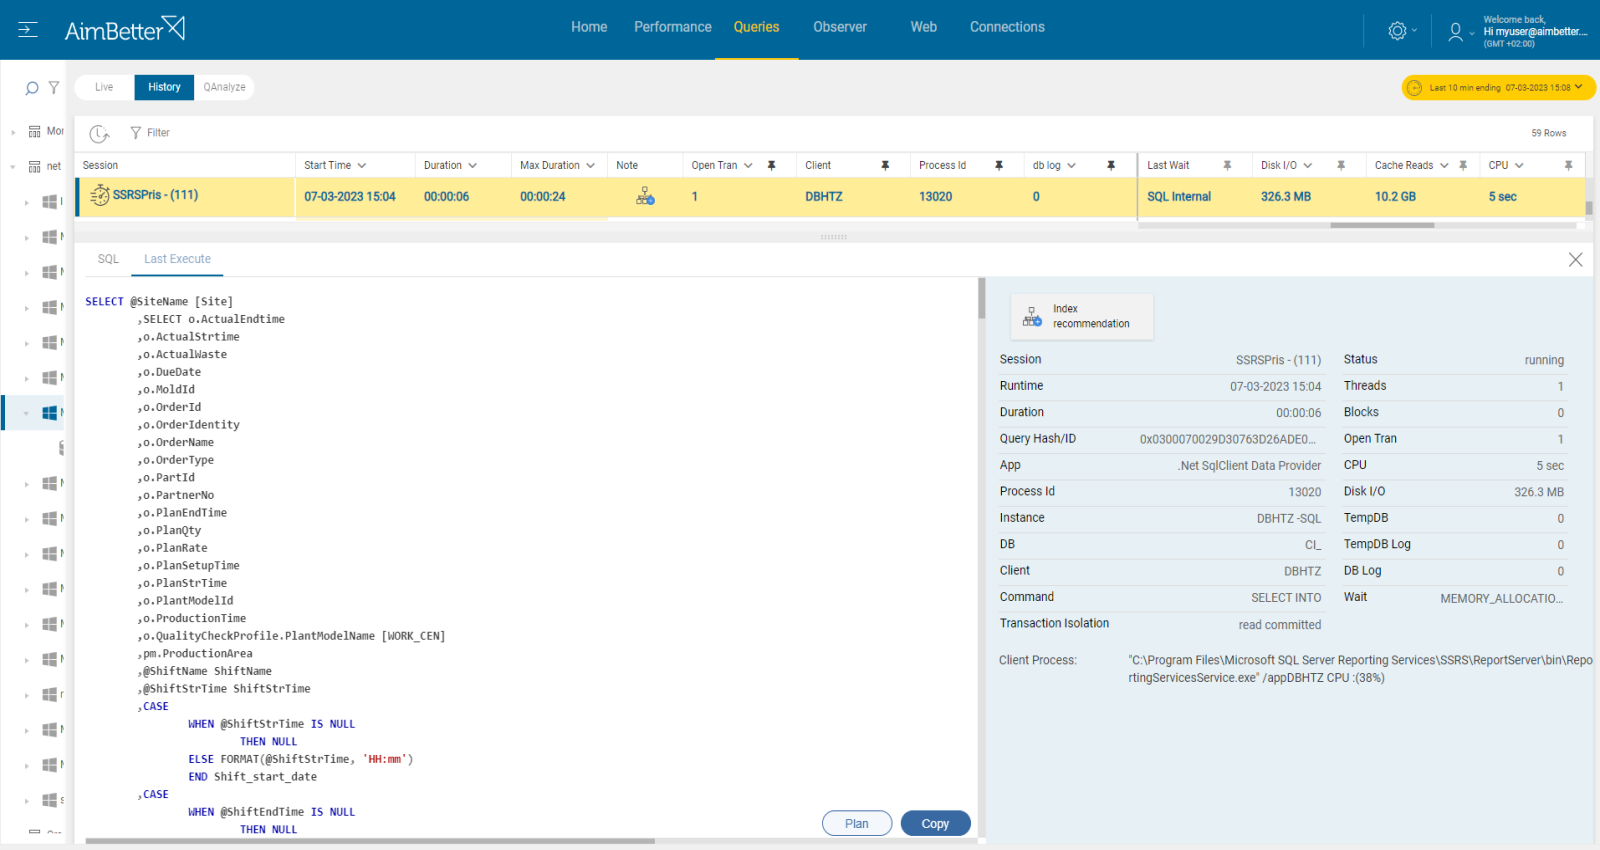
- Try to find a way to optimize the query code by viewing the query execution plan. This task might be complicated and should be done by a DBA.
Get the answer in just seconds!
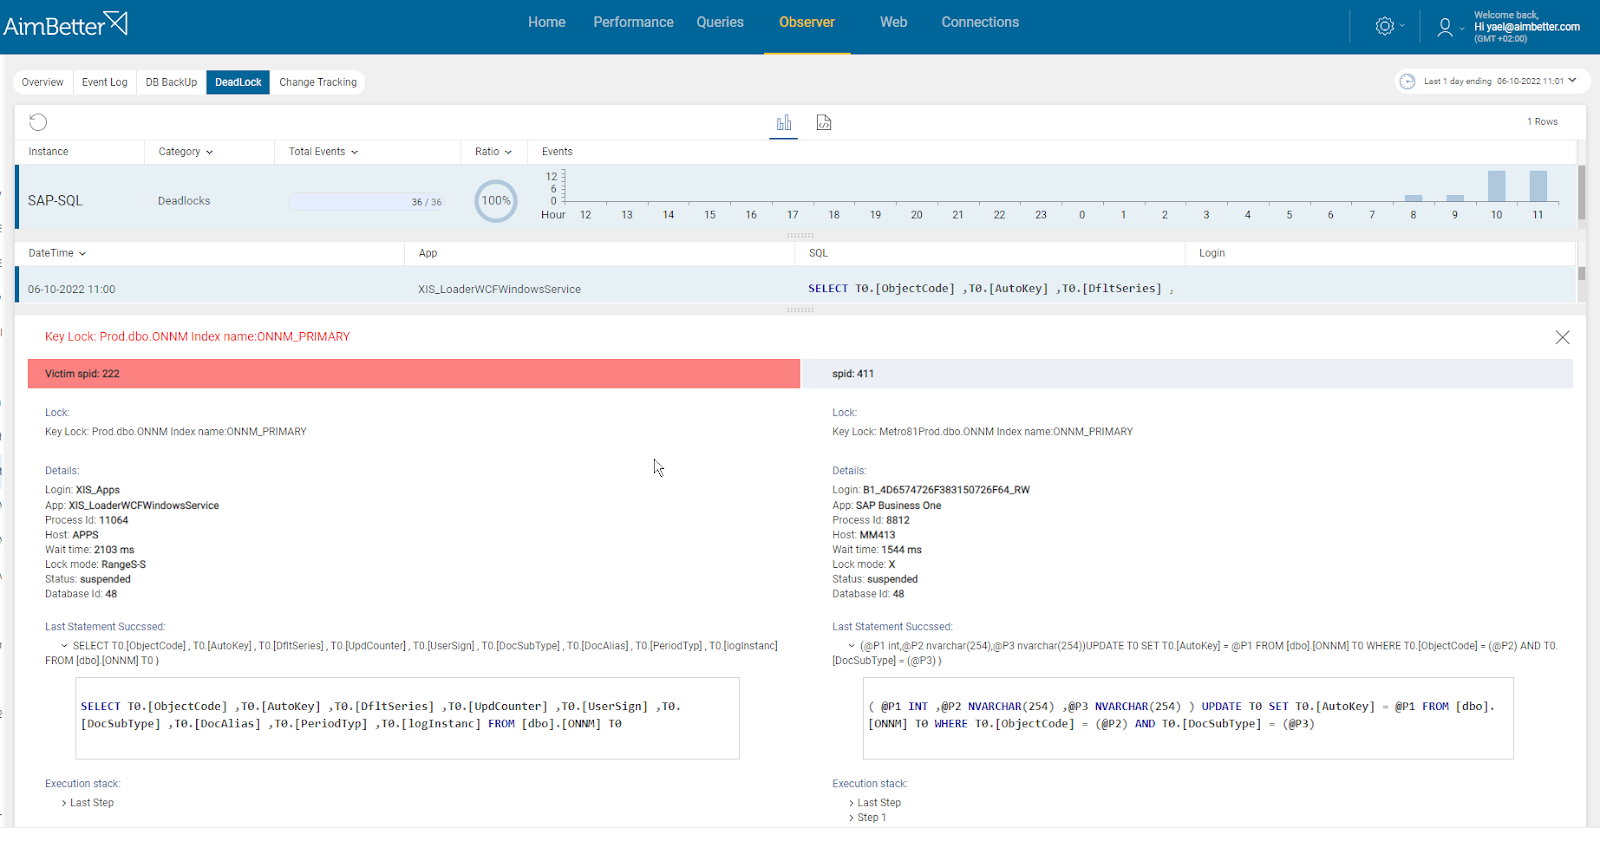
From the AimBetter monitor, you can drill down into any transactions involved in a deadlock, the query’s running time, and full details, while identifying both the killed one and the surviving one.
You can also view deadlocks that have occurred in the recent past without having to reproduce the issue because with AimBetter all deadlocks are logged and stored in the cloud for up to 30 days.
Recommended action :
Identify the source of the query and try to achieve faster execution. Any application code that issues database queries should be equipped with error handling that deals with the possibility of this problem and notify the calling client properly.
A CPU load might happen before the deadlock occurs or because of it.
Optimize the application code – avoid starting a transaction in your application that is having long conversations with SQL Server or risks leaving one open too long. See our recommendations regarding long queries here. Identify the source of the load, and if it is recurrent, try to reschedule to a time of low user demand.
2- Incorrect, unnecessary, missing, or corrupt indexes Priority: Medium
Indexes are one of the most essential features of the SQL Server but can be a source of many problems.
Incorrect indexing can destroy the benefits of indexing and add more load onto the server. An example would be the use of composite indexes where the order of the column is not followed in the calls leading to poor execution times.
Unnecessary indexes negatively impact by increasing the load for index maintenance and demanding additional storage on disks that indexes require.
Corruptions in existing indexes are usually disk or disk driver/firmware related.
Missing indexes are usually identified by SQL Server at the time of execution and should be built for future efficiency.
Problem identification:
Identify missing or corrupt index issues of queries that are involved in deadlock events.
- Use tracking tools in order to capture deadlocks. For SQL Server, you can use SQL Server Profiler. For Oracle, you can use the trace files that Oracle generates containing deadlock information. When doing it, take into account that dealing with the past deadlock isn’t possible – it will either have to be re-created, or you will have to wait for the next time. In addition, SQL Server logs information about deadlocks to the error log, and you should try to check it also.
- Identify which of the queries have missing or corrupt indexes by running a performance analysis. You can use SQL Server Profiler or other performance analysis tools. This step should be done by a DBA and might take time.
- Think about which appropriate indexes would optimize the queries. You can use the Database Engine Tuning Advisor or other tools to help identify the missing indexes. This mission requires a highly skilled DBA that can view a complete SQL query plan that might be long and complicated.
- Check the existing indexes for corruption. If any index corruption is detected, rebuild or repair the indexes.
- Follow-up deadlocks events recurrence. If it still occurs, you may need to investigate the issue further.
Recommended action :
In cases of corruption, consult with your storage management team to identify the source. Our support expert team’s experience has shown that one possible remedy in cases where the corruption is repeating is to clone the database onto a new hardware configuration.
In case of a missing or incorrect index, refer to your application design team. Consider changing the index type (clustered/non-clustered) or switching to cover indexes that include all referenced columns.
Removing unnecessary indexes should be done in consultation with the application designers.
We recommend you our article about solving deadlocks in SQL Server environments.


