Real-Time Problem Solving
Database Issues? Stop Guessing.
From performance slowdowns and application crashes to data loss and security risks,
identify the exact cause and how to fix it in real time.
Requiring no DBA expertise, AimBetter’s intuitive dashboards and AI-powered analysis enable IT professionals to efficiently identify the root causes of database issues, reducing the DBA expert’s workload by 80% and allowing them to focus on faster resolution and optimization.
Including an AI Expert DBA that helps IT teams troubleshoot complex database issues, provides actionable recommendations, and accelerates problem resolution with real-time insights.

Features


TABS
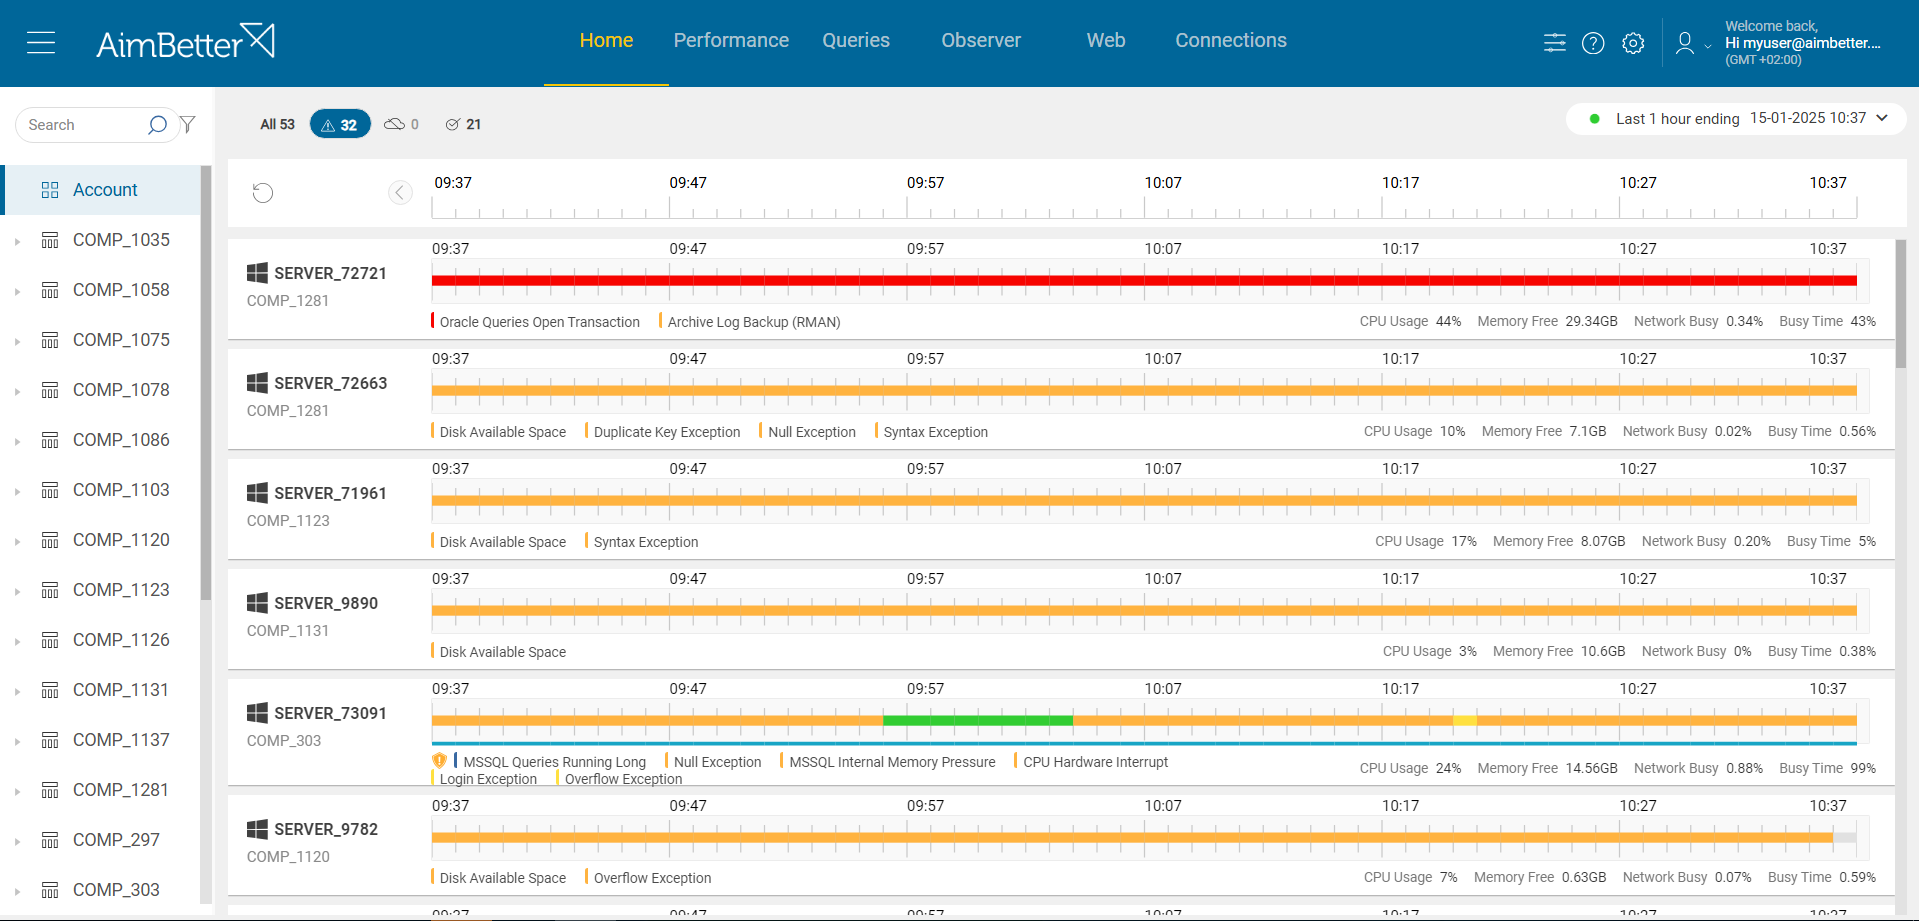
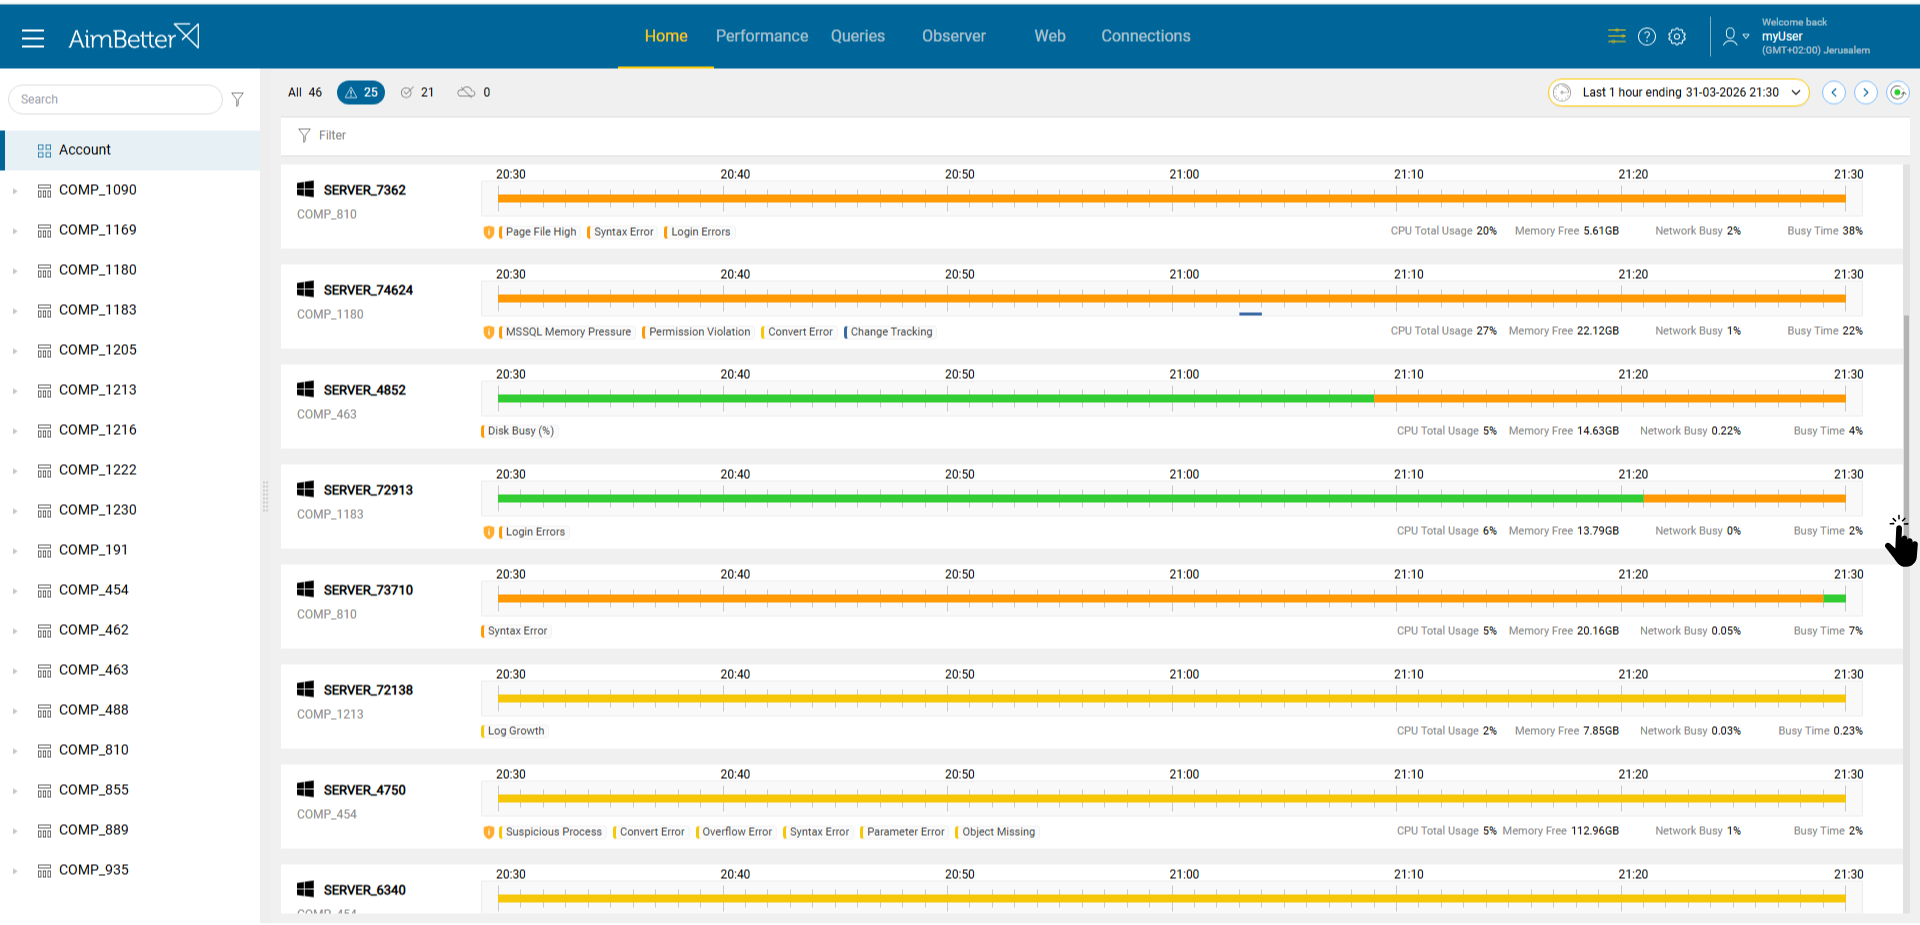
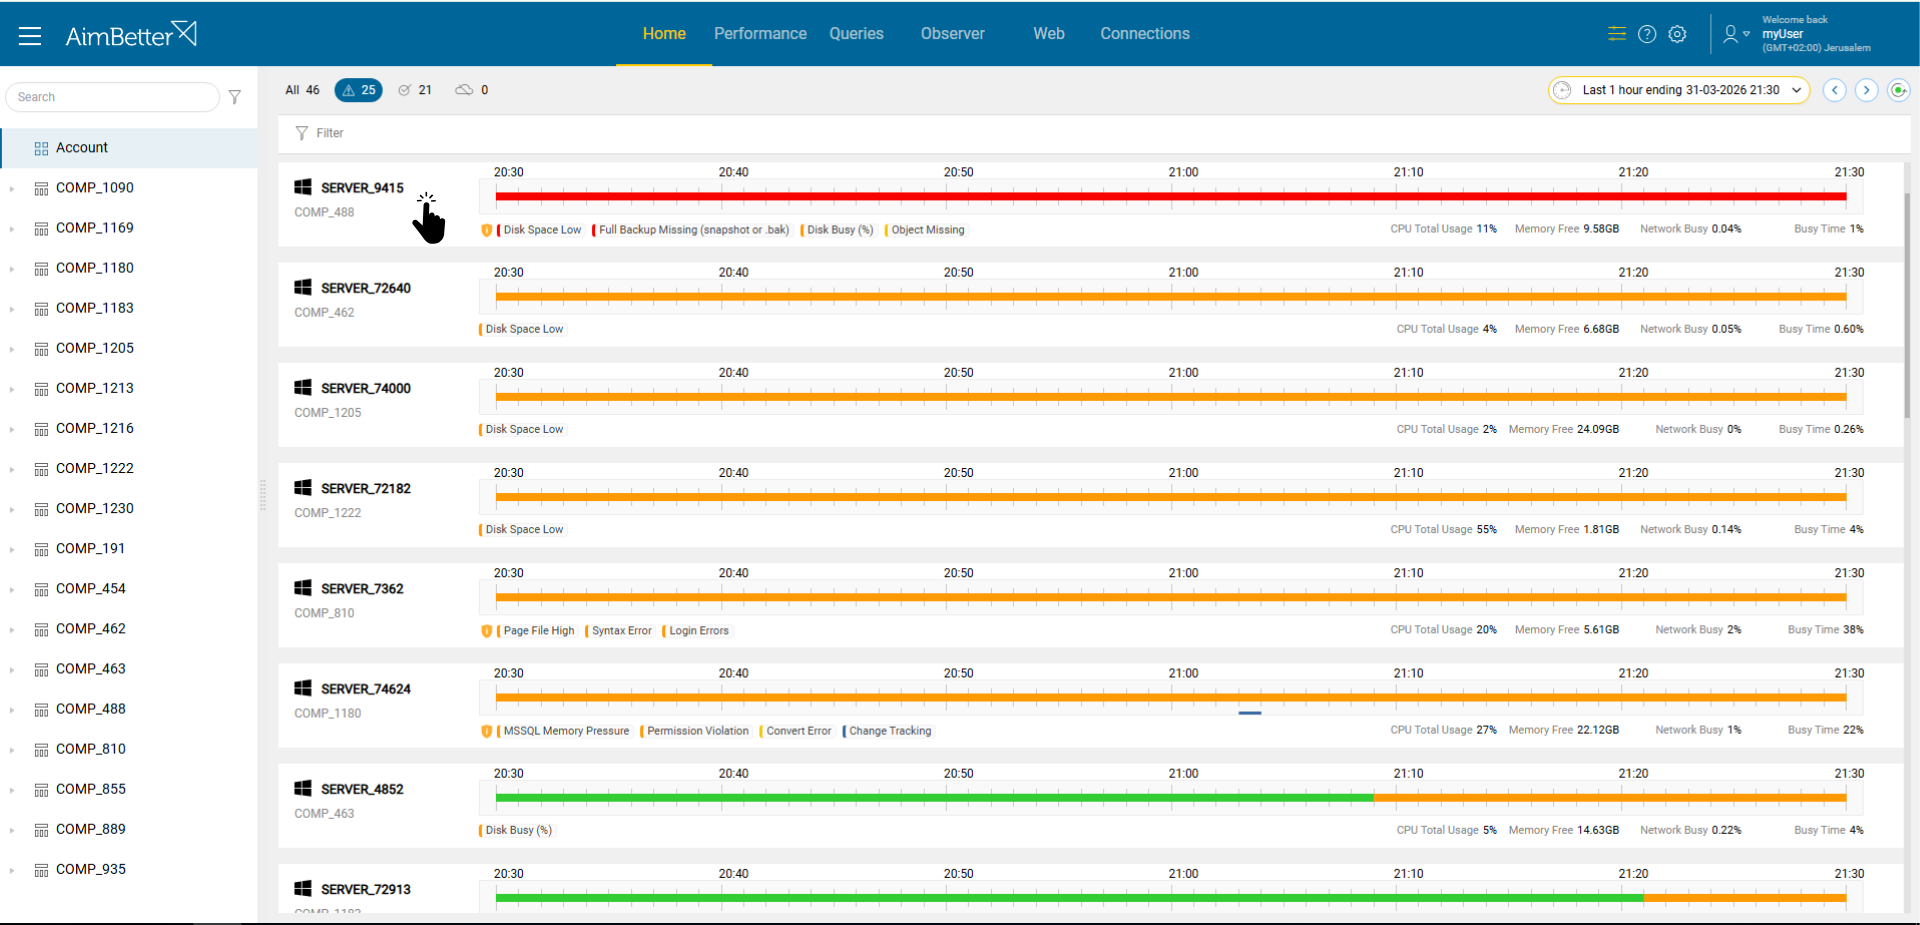
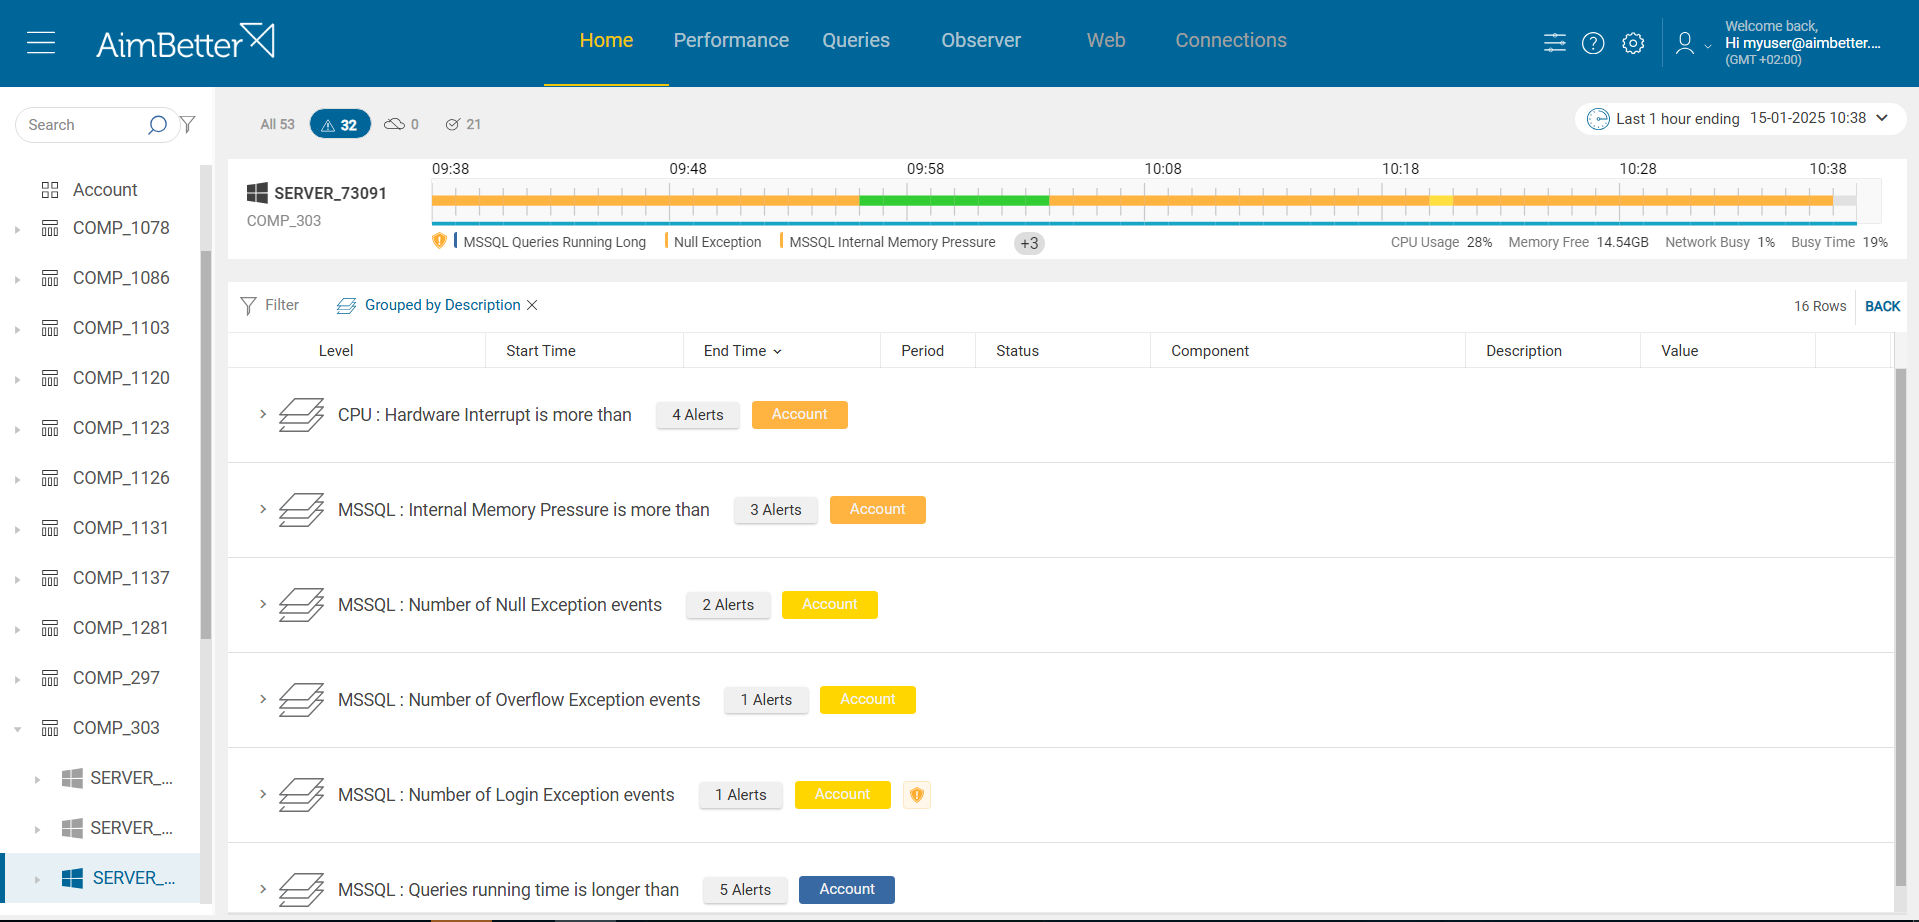
✓ Quickly identify and address the most urgent cases.
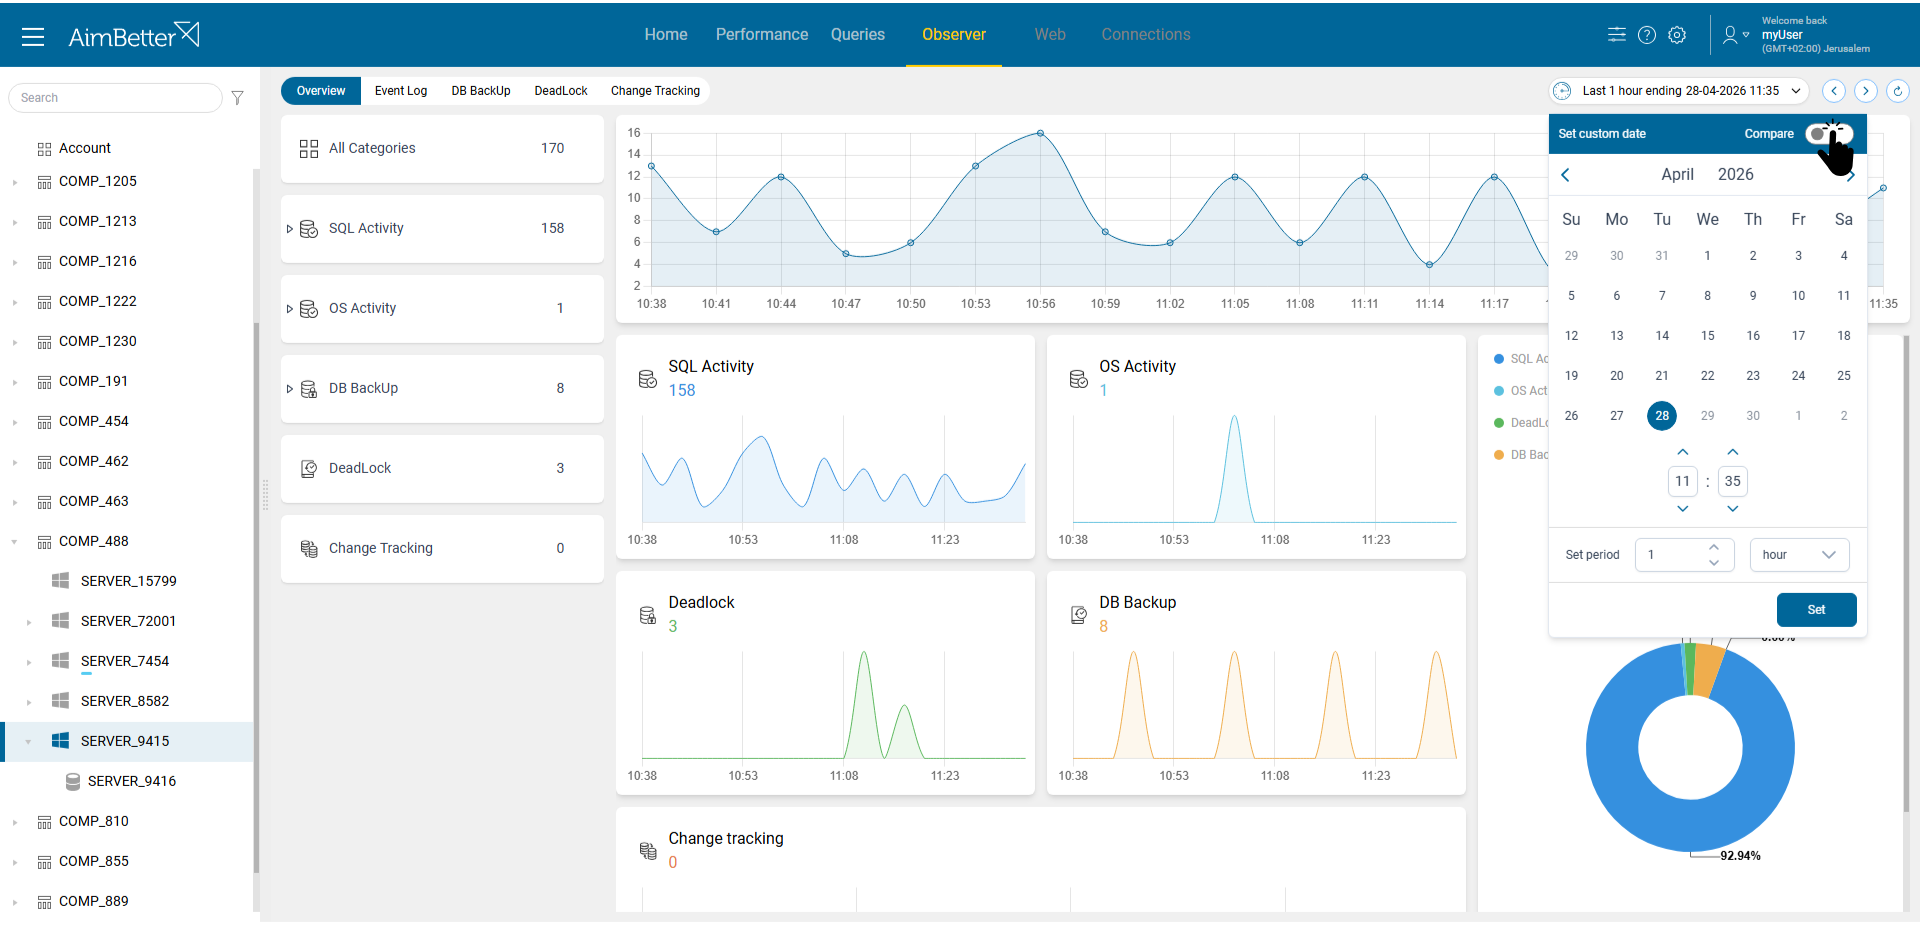
✓ Scroll over the bars and see the current issues through labels beneath the status bars
✓ Choose which servers to focus on by selecting the hierarchical layers (All, Company, Host, or Server)
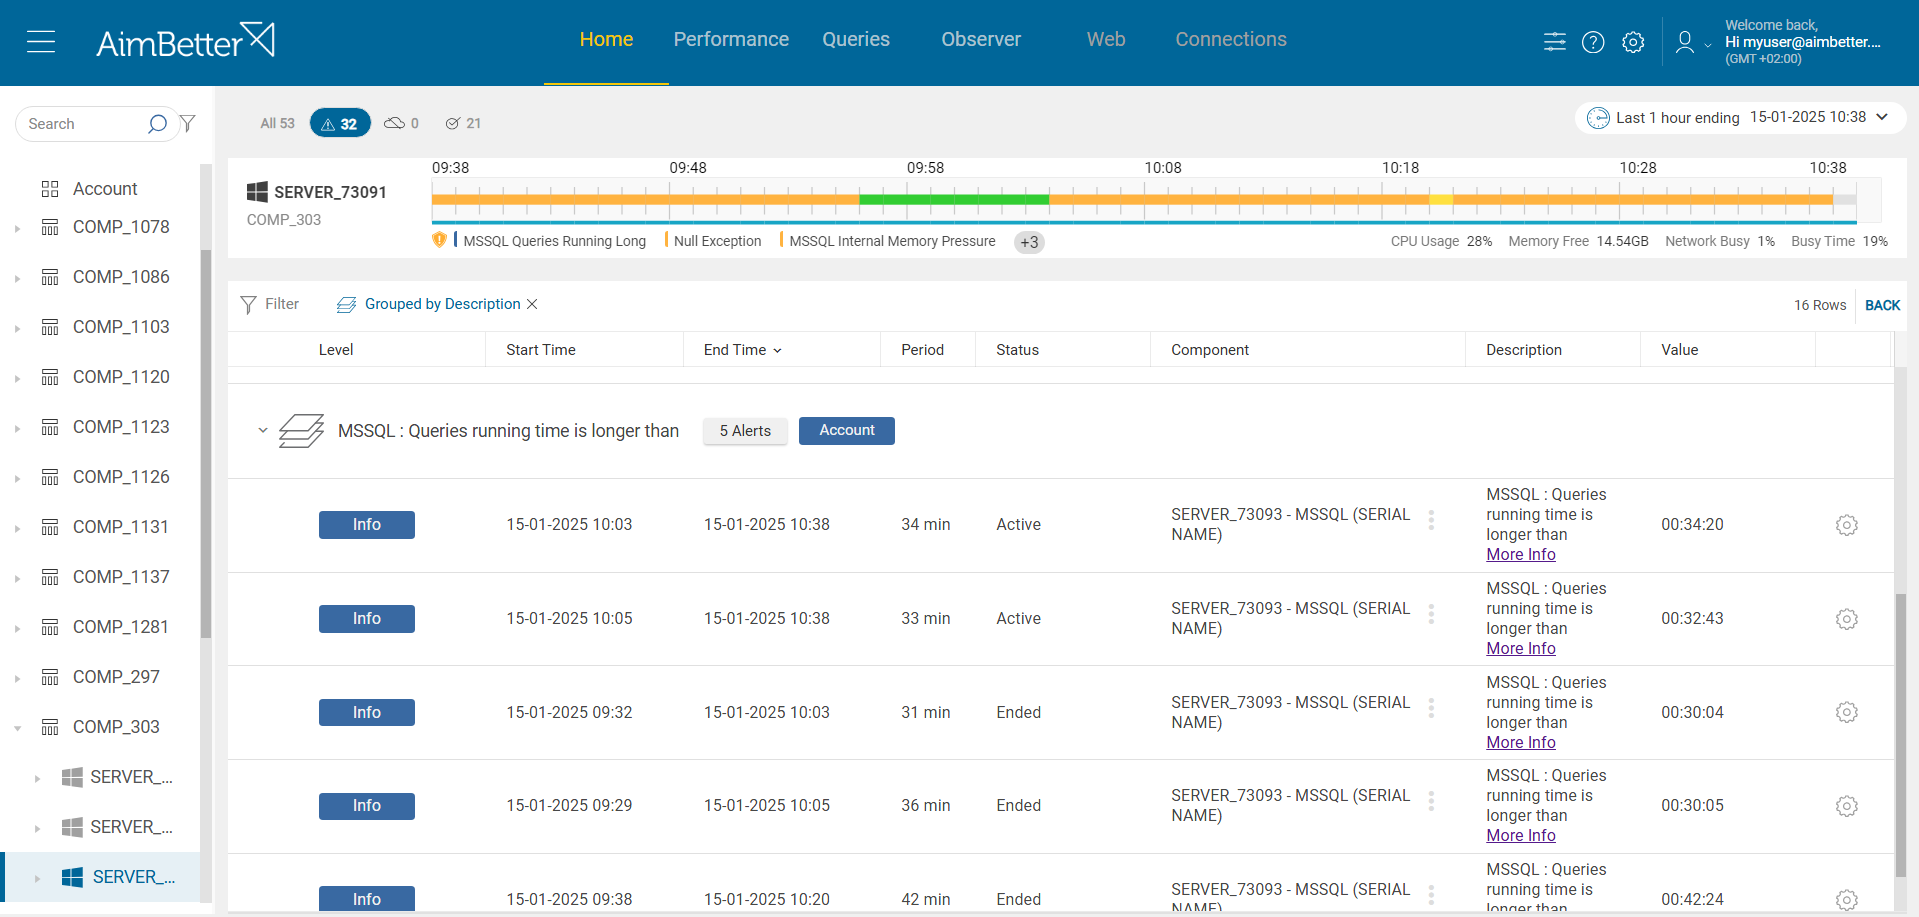
✓ Get details in seconds by clicking on the status bar
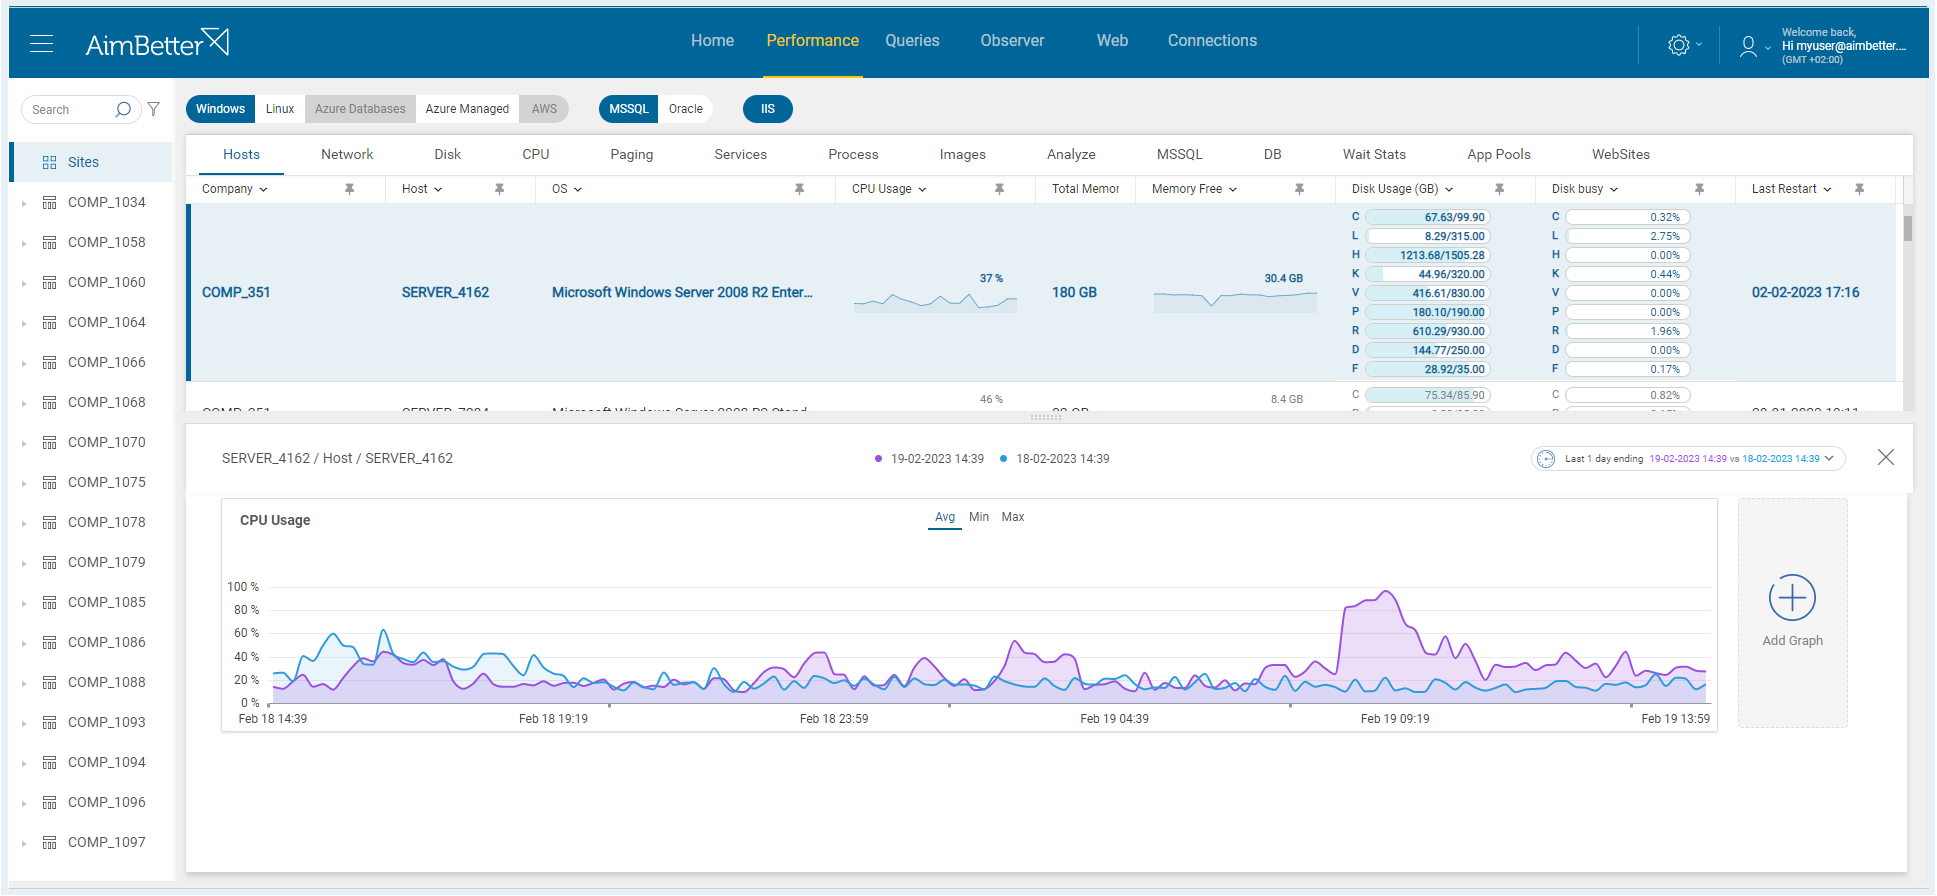
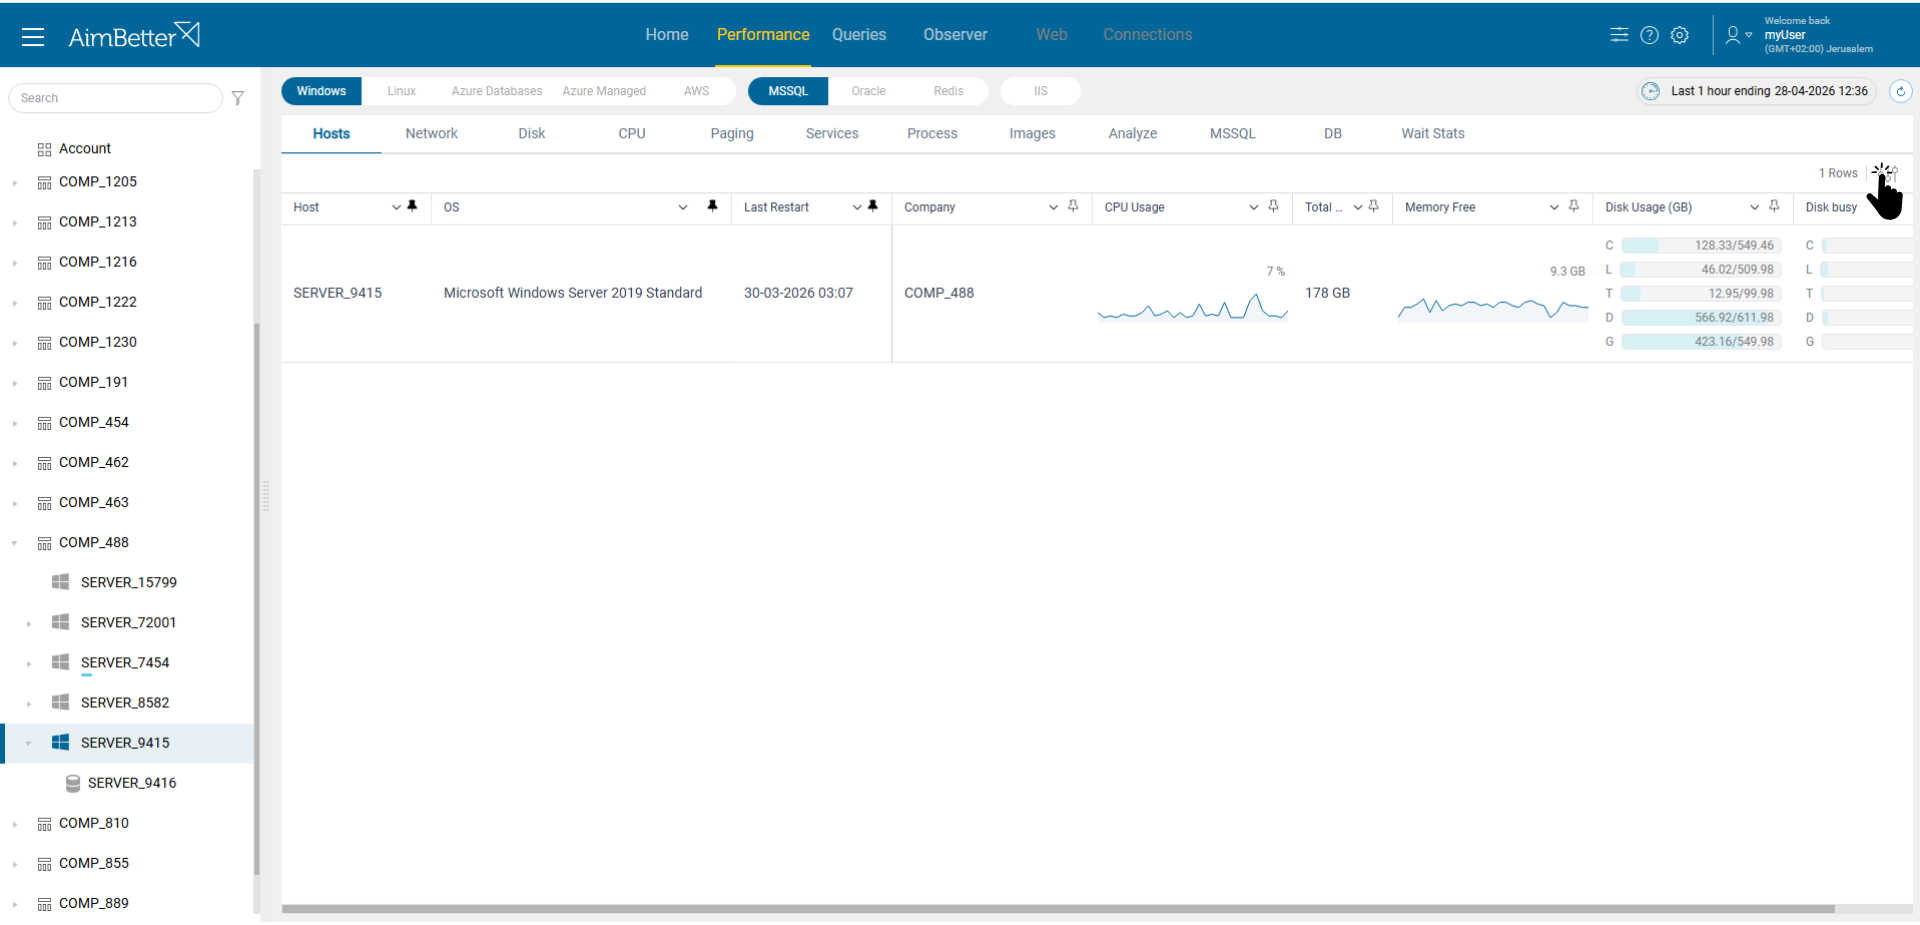
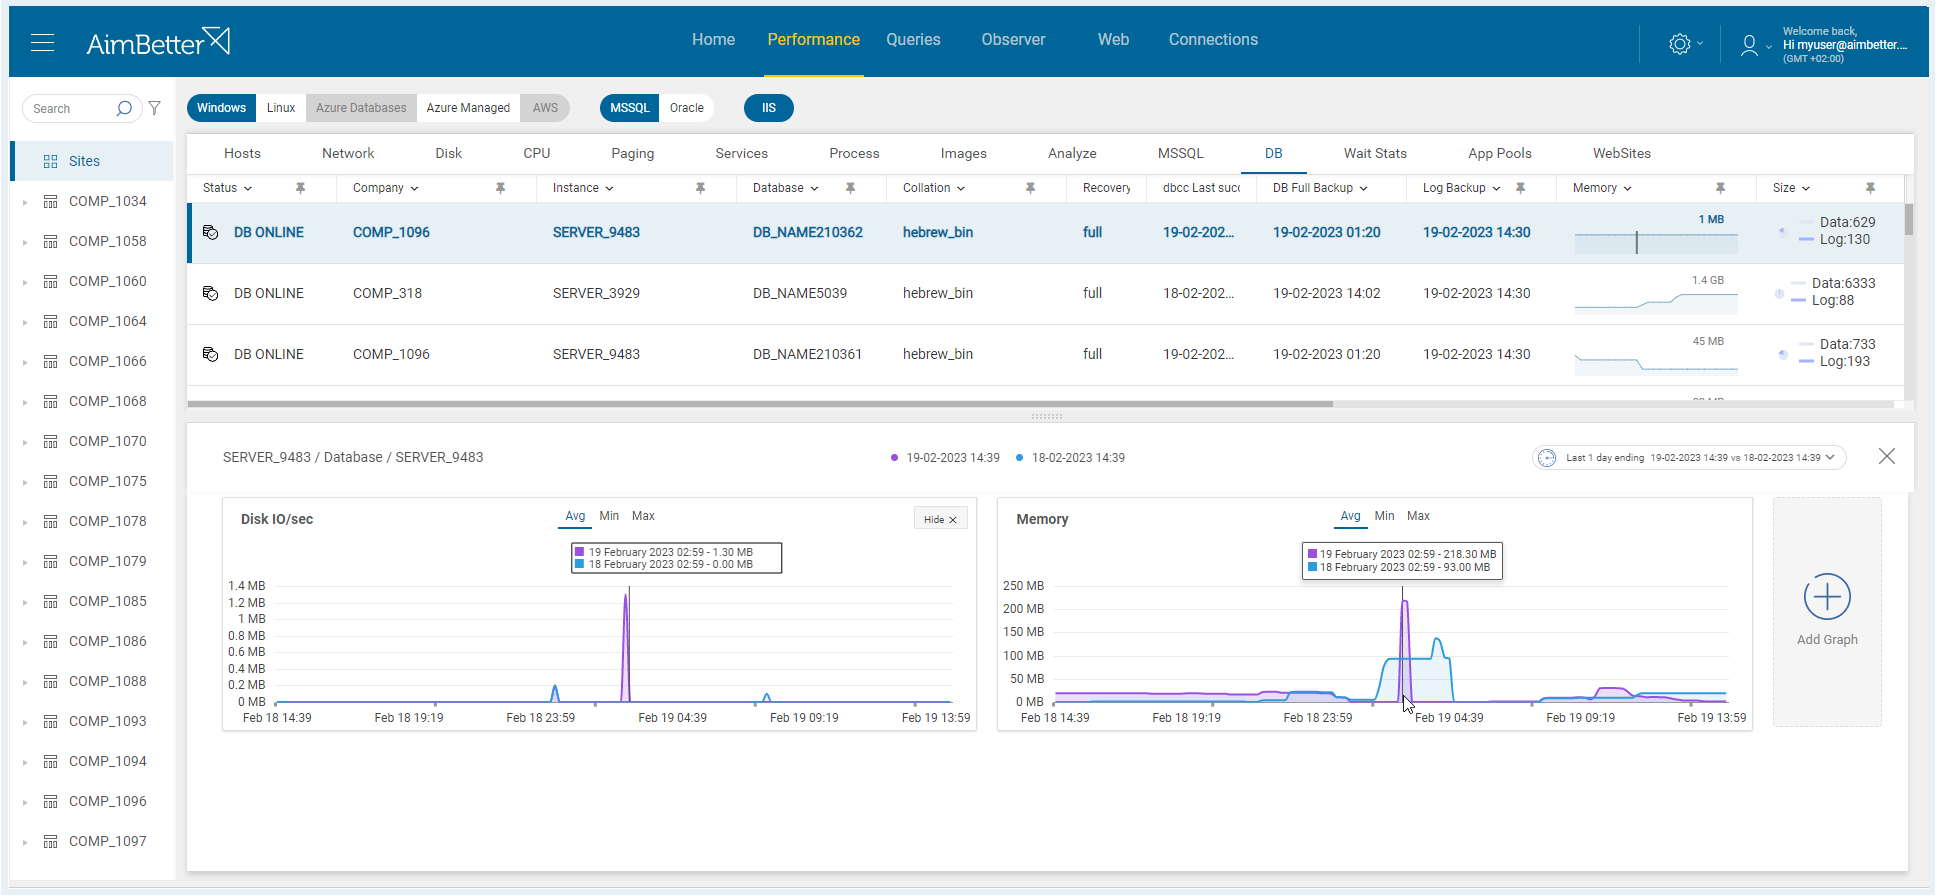
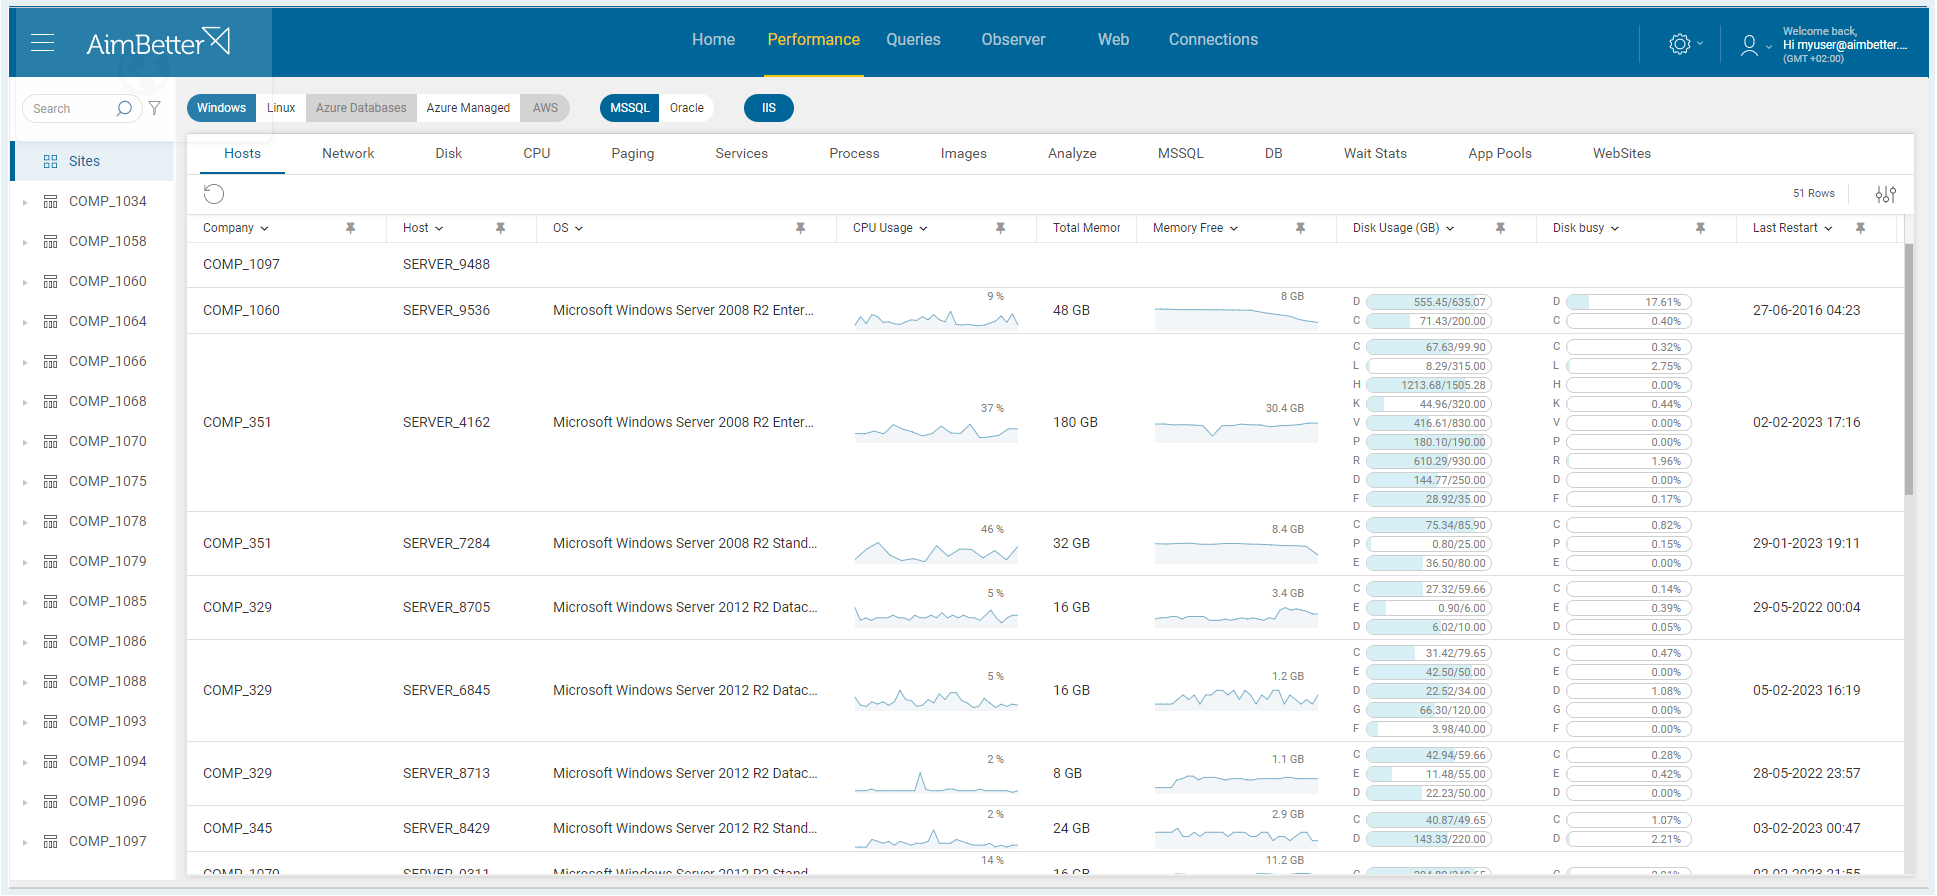
✓ Understand all the SQL Server environment health through over 400 critical system metrics
✓ Intuitive graphical display of metrics over time
✓ Easily compare metrics during different periods
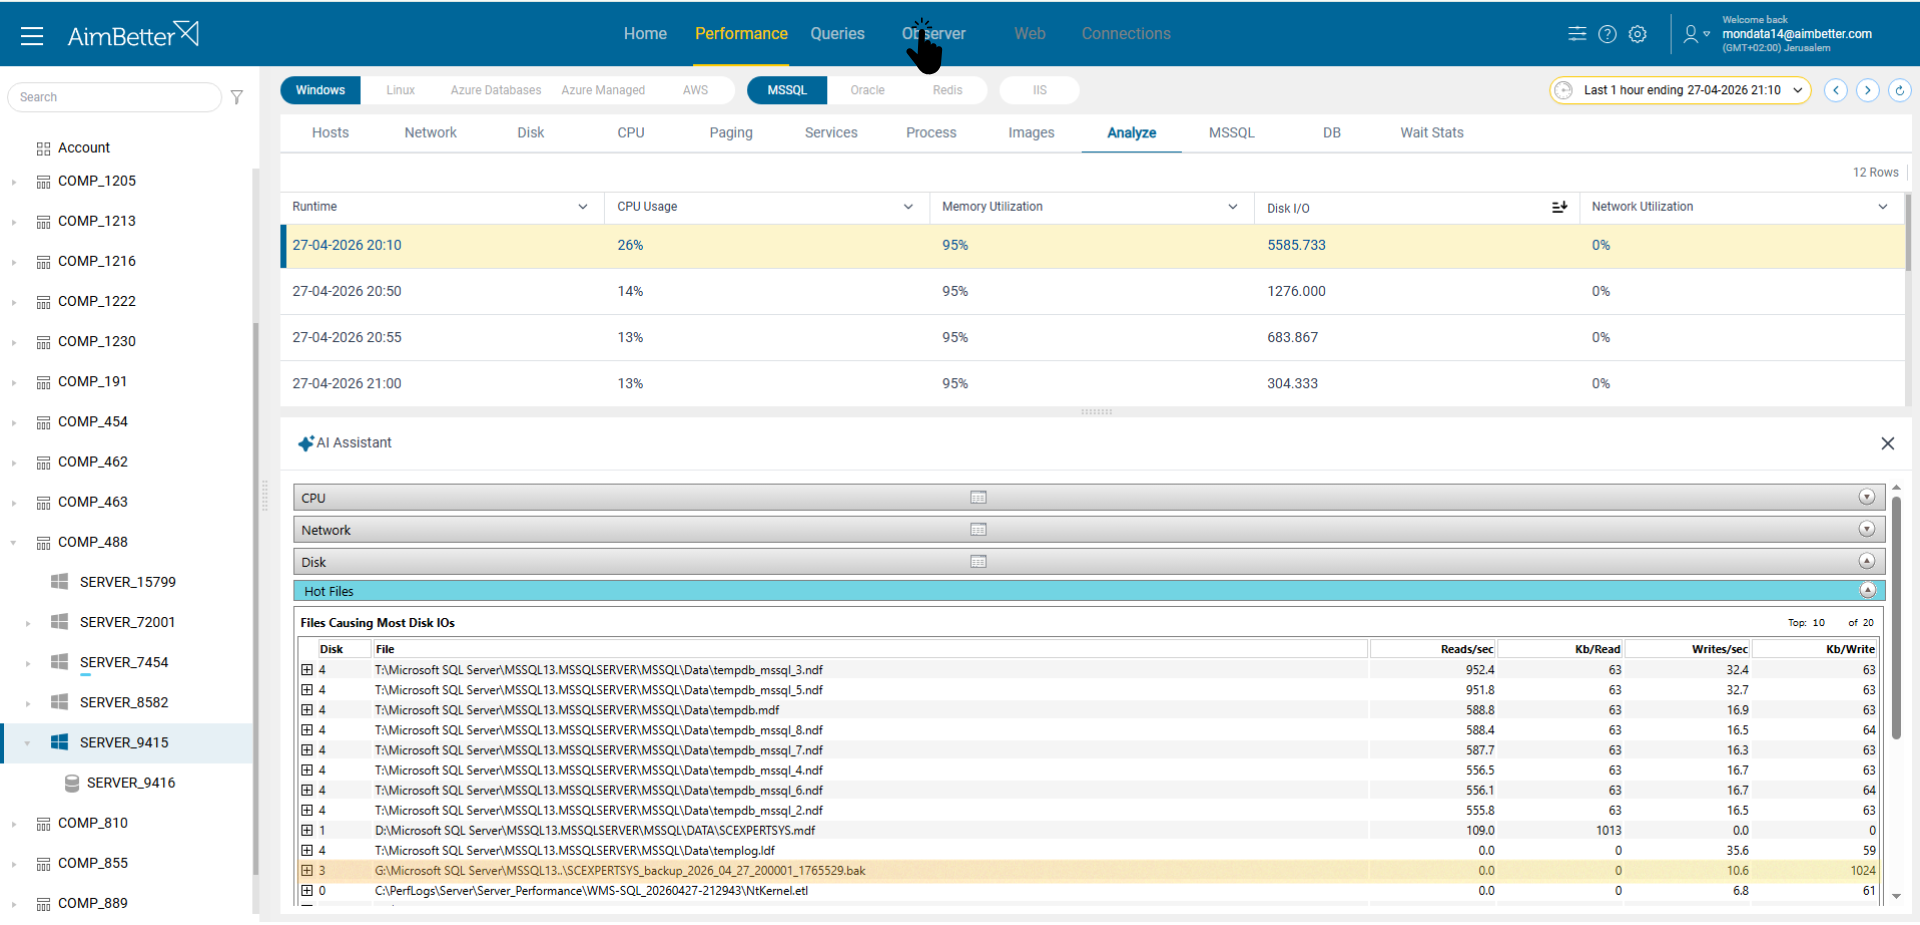
✓ Investigate resource consumption going back to Logs at any desired time
✓ Waiting stats analysis for a straightforward identification of the source of delays in the system
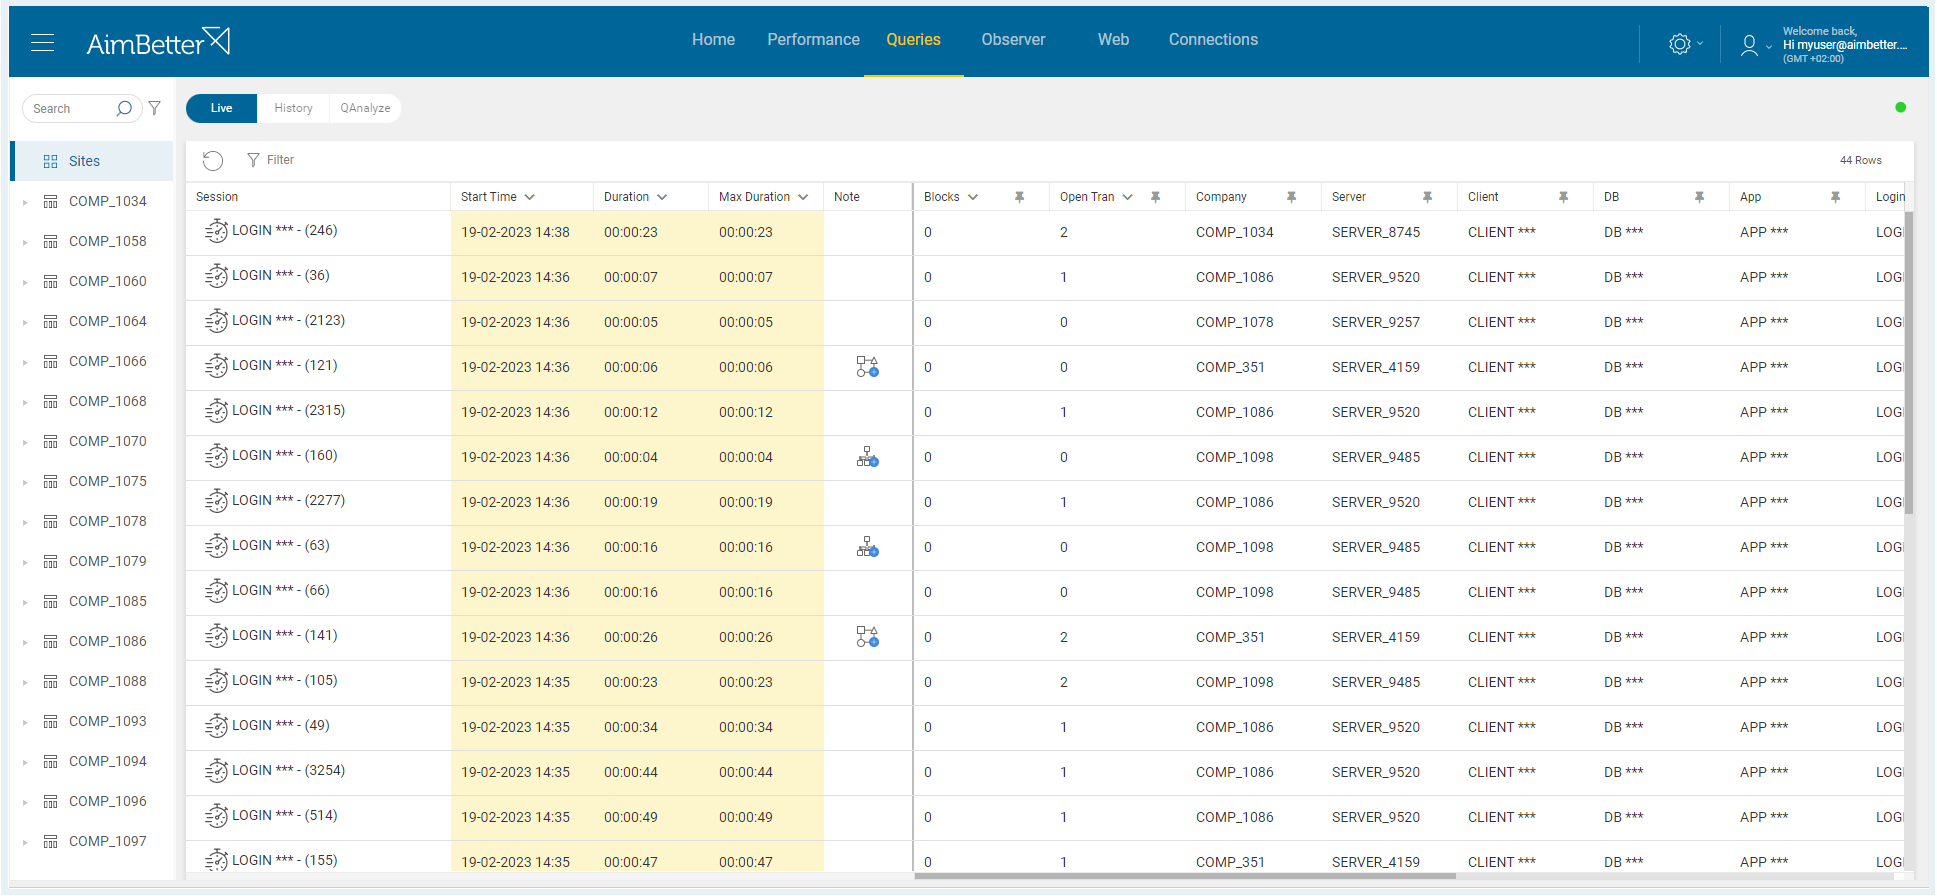
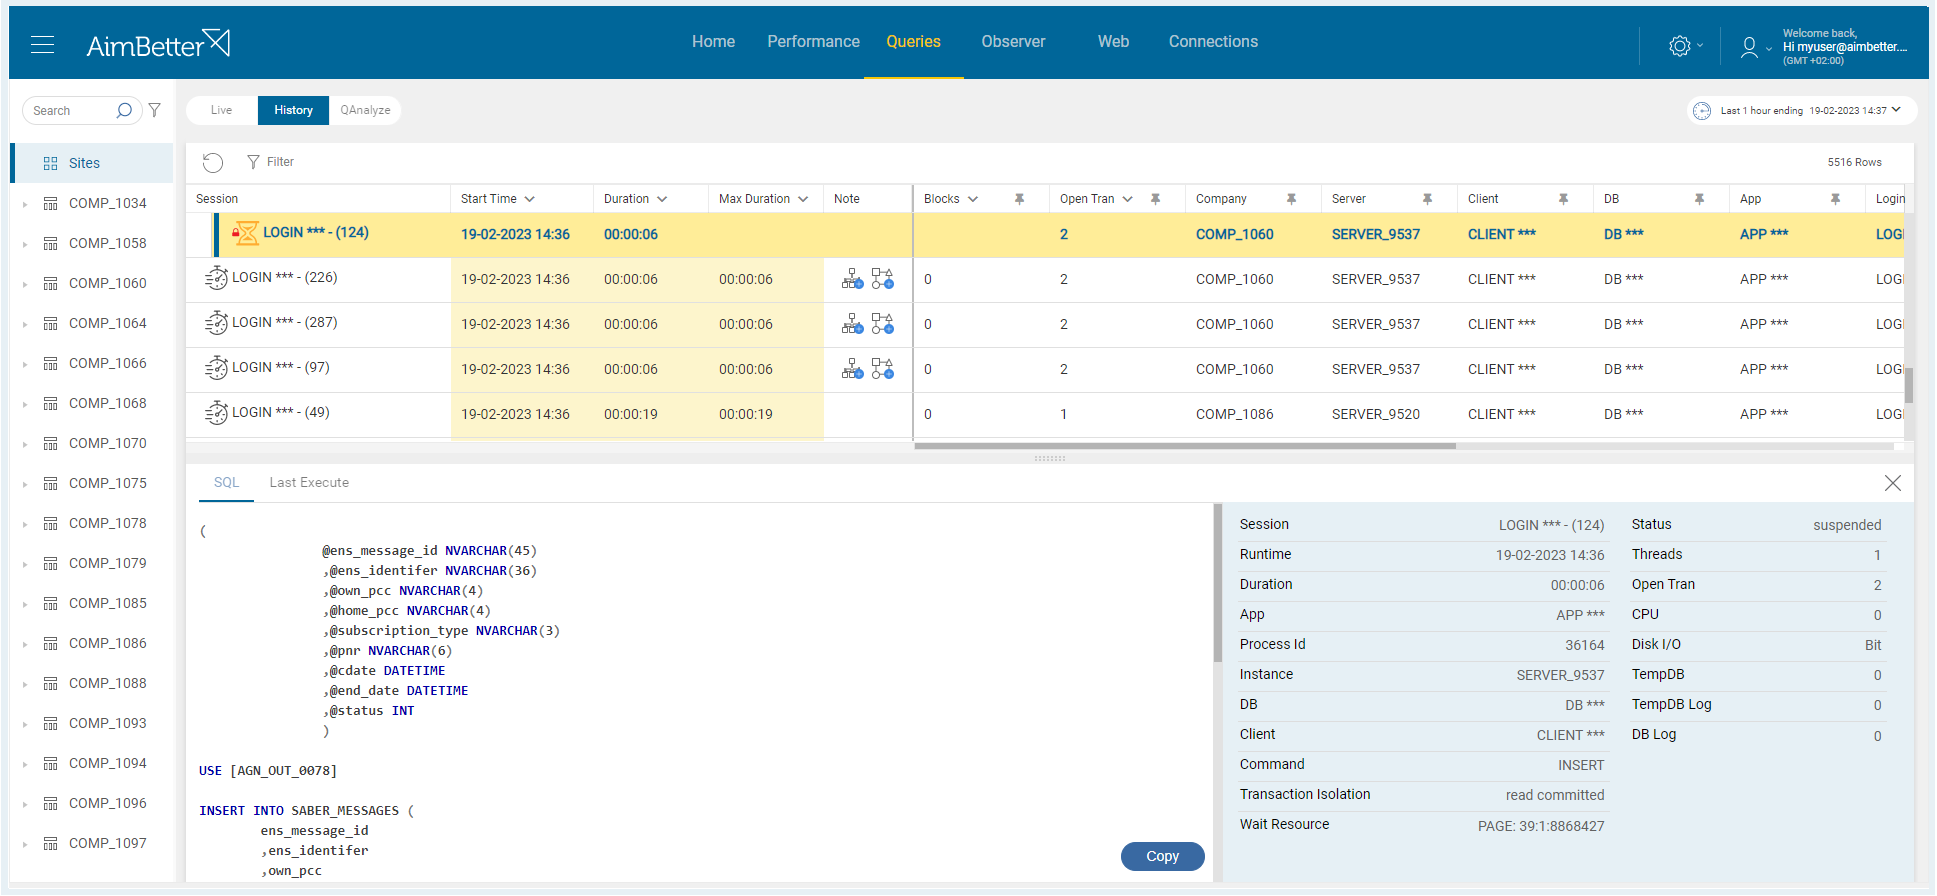
✓ Real-time comprehensive analysis of all queries
✓ Identify blocking queries with users’ details
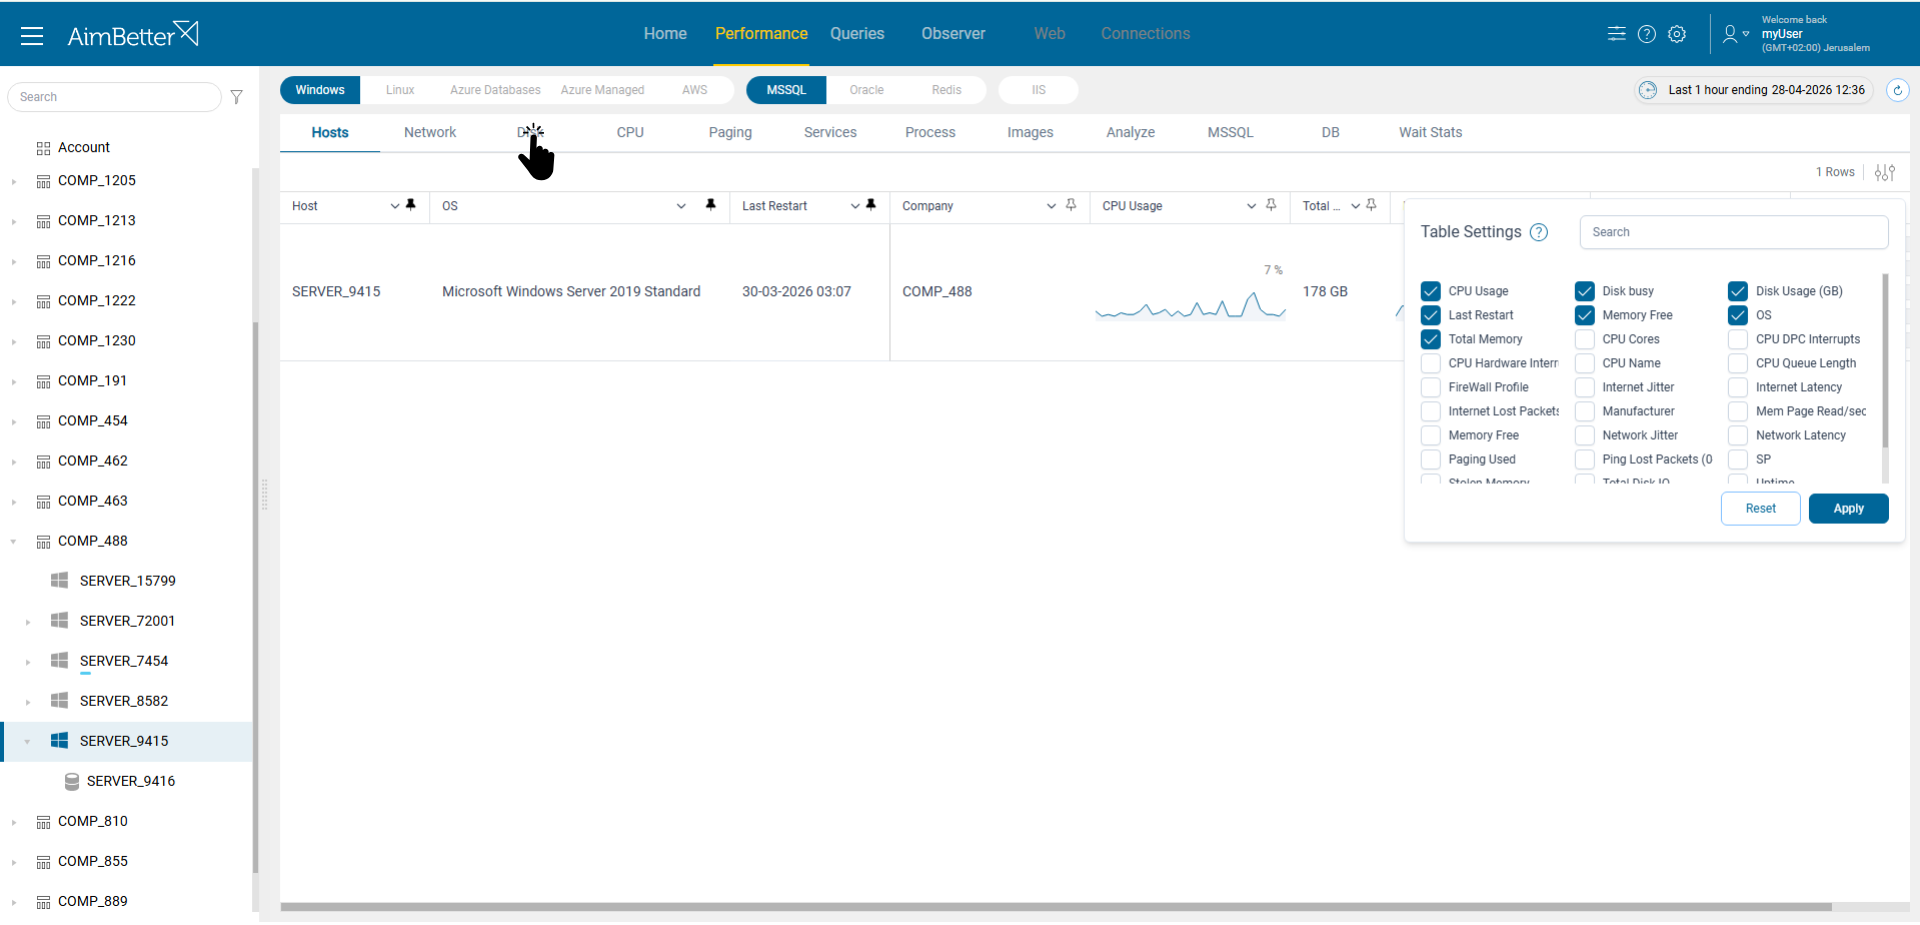
✓ Multiple filtering options
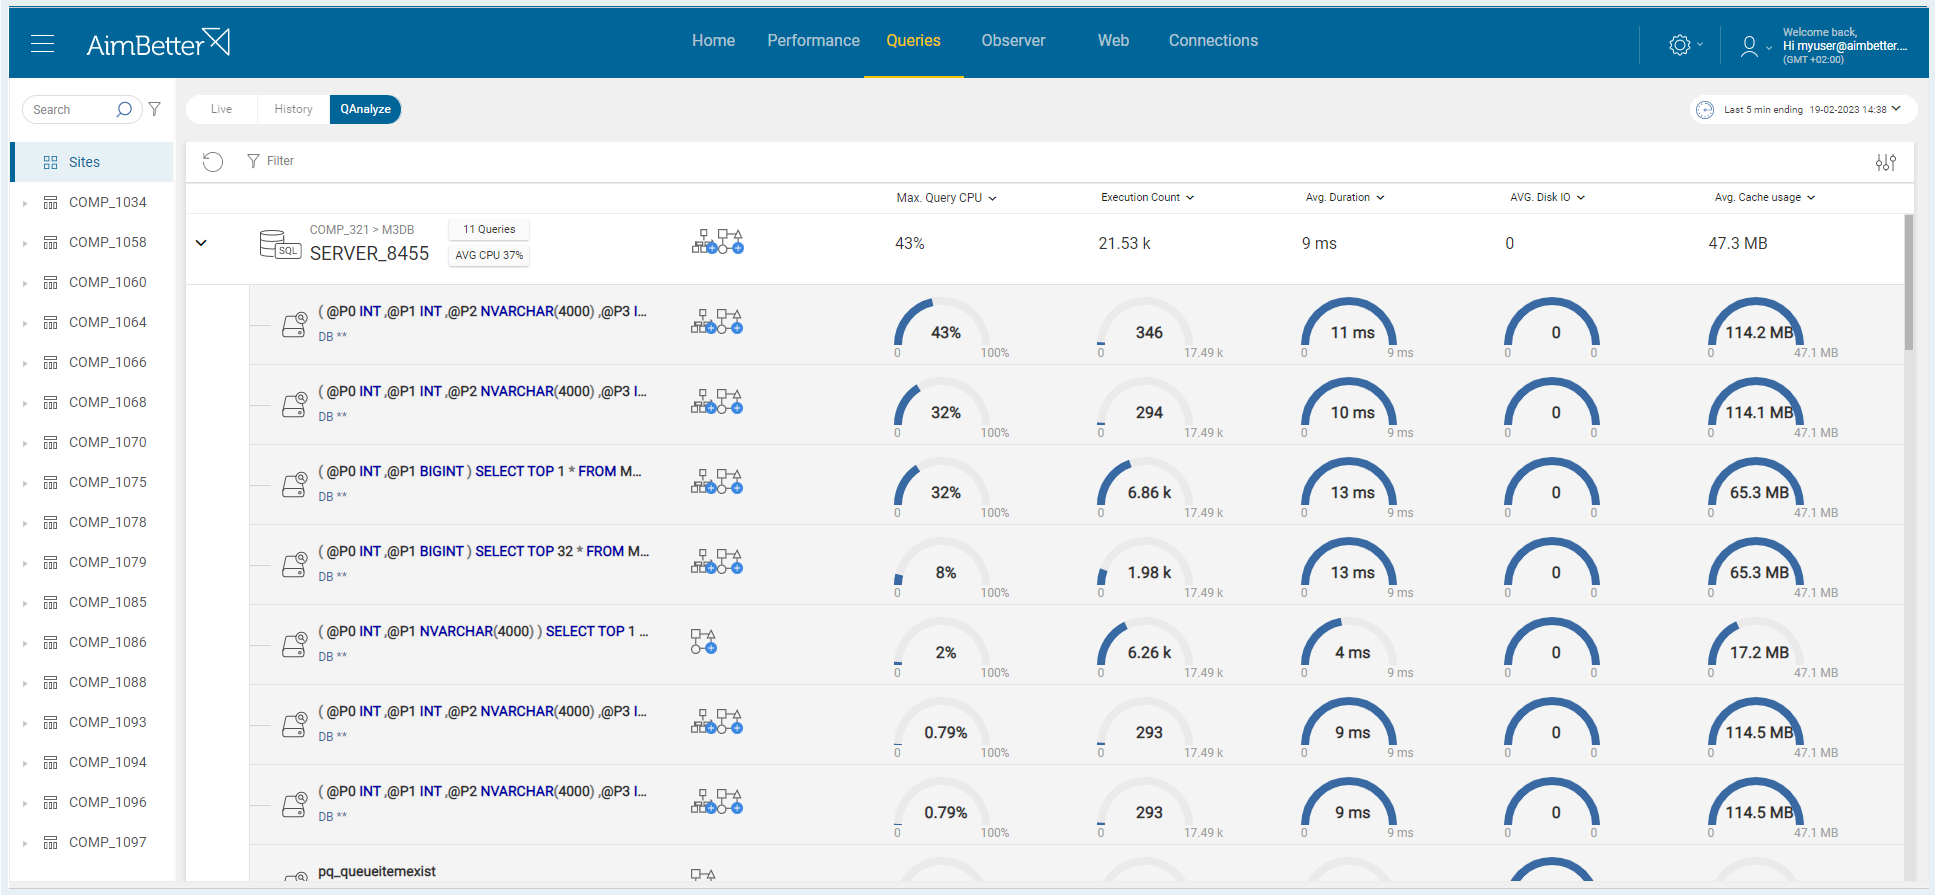
✓ Recommendation for missing index and plan improvement
✓ Execution plan deep analysis
✓ Resource usage analysis (CPU, memory, execution count, Disk I/O, and Cache).
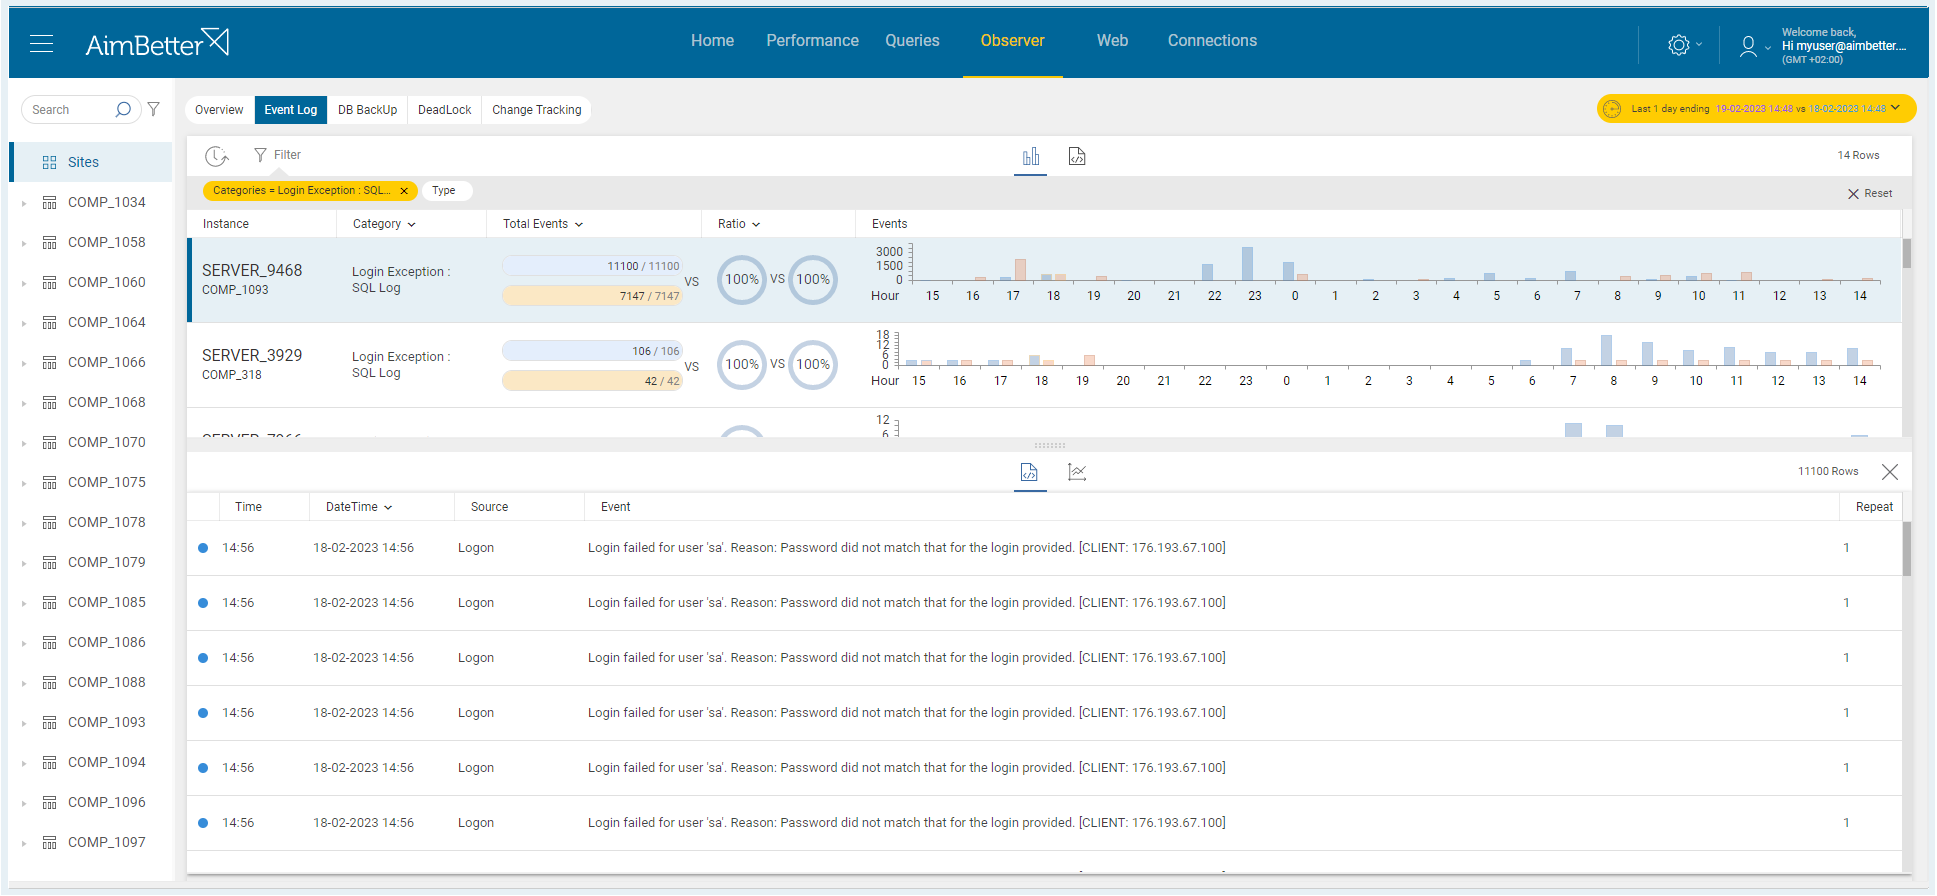
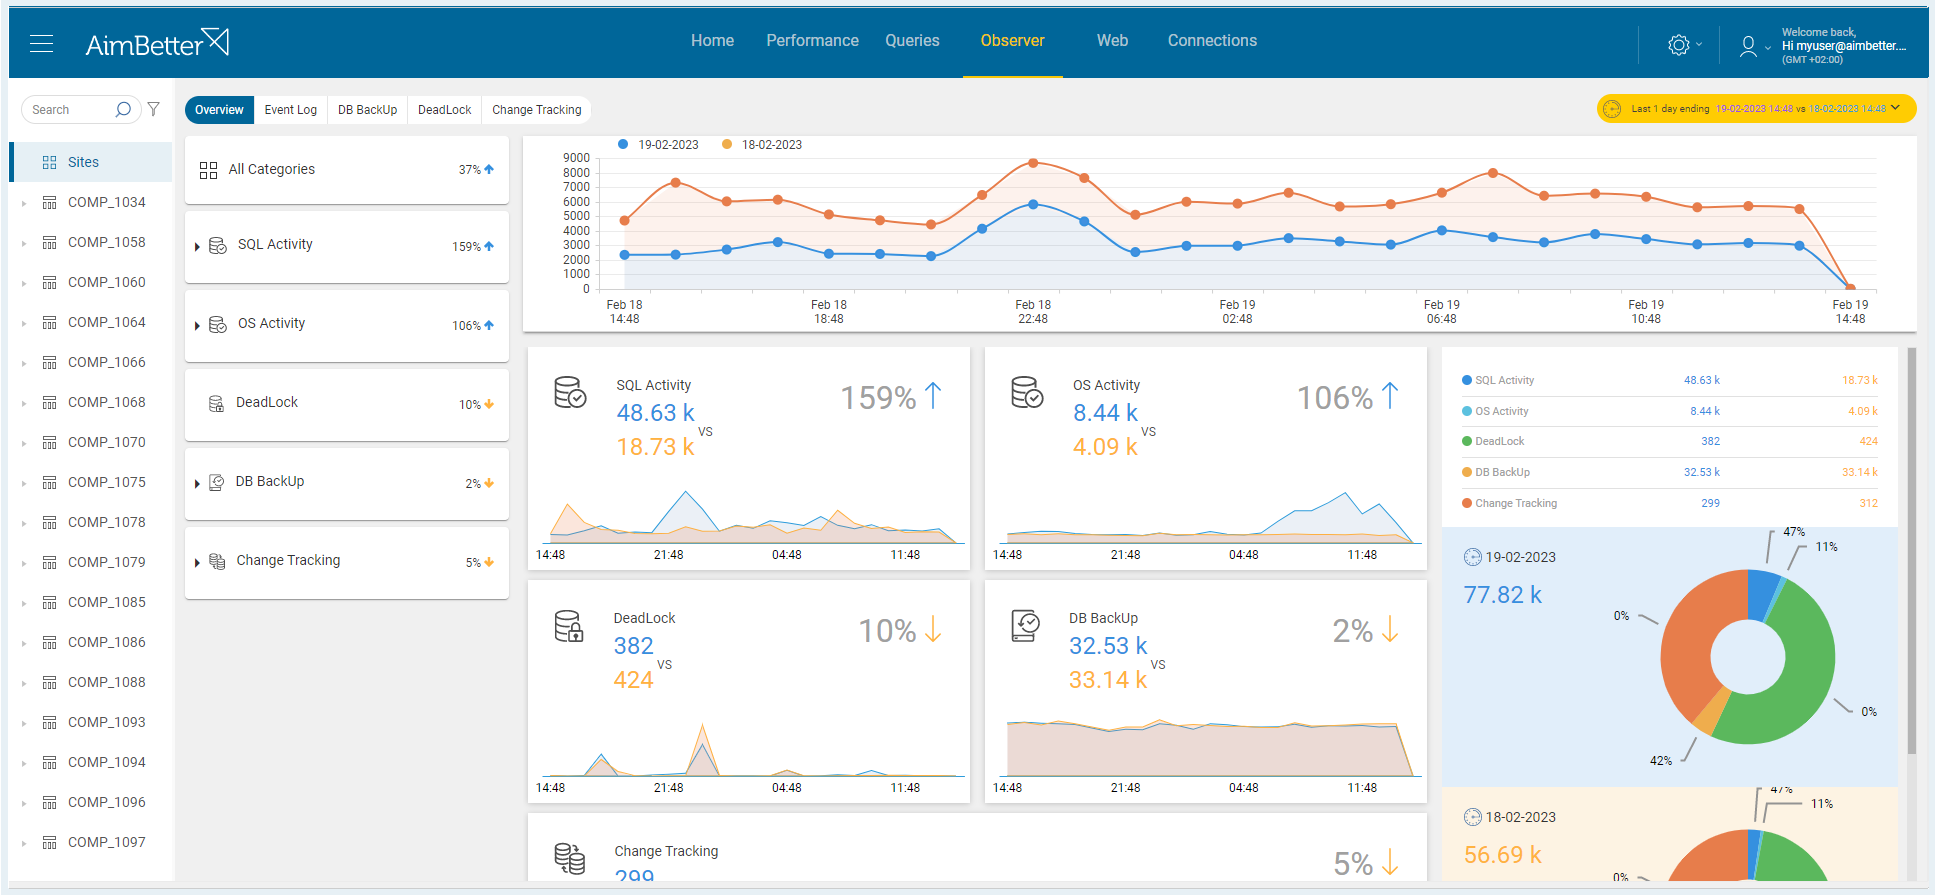
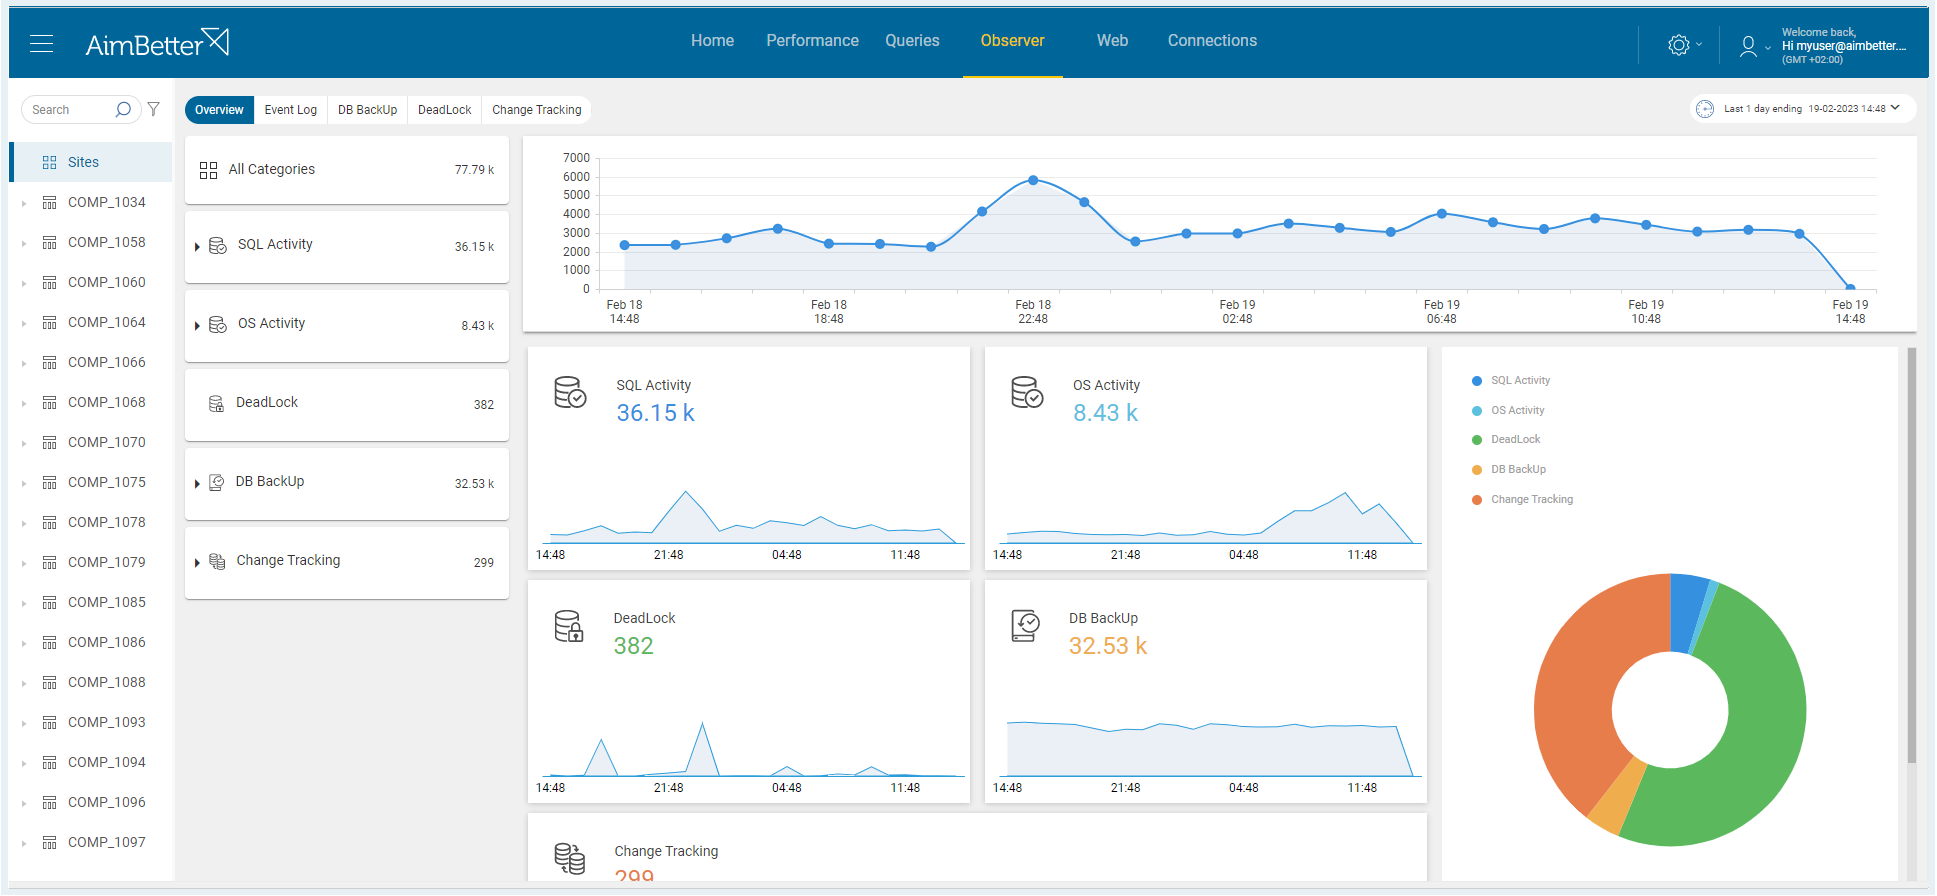
✓ Keep updated on any changes like software installation and updates, database creation, service status changes, and more
✓ View all the exceptions in both OS and SQL levels with details of when they happened, who the user was, the application it originated from, and their description
✓ Recognize abnormal behavior, such as login attempts, that may pose a serious security breach
✓ Follow up easily on the Database backup initiatives and their proper execution.
✓ Understand all the deadlocks causes and victims
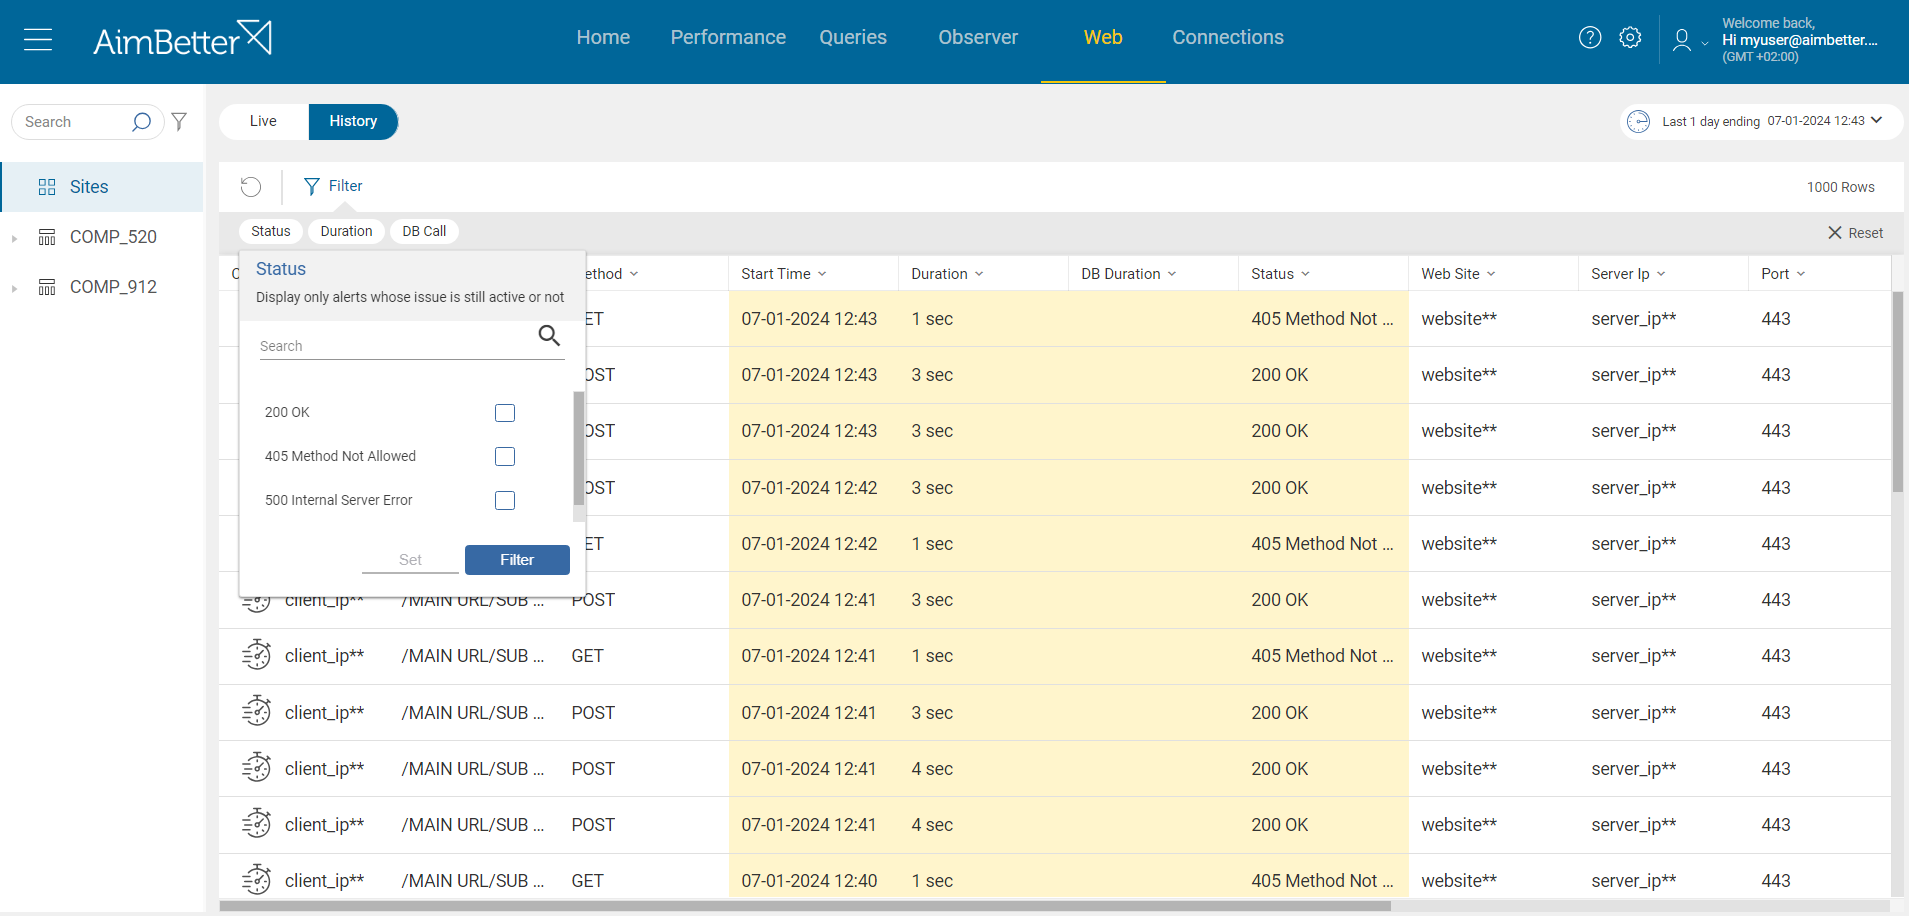
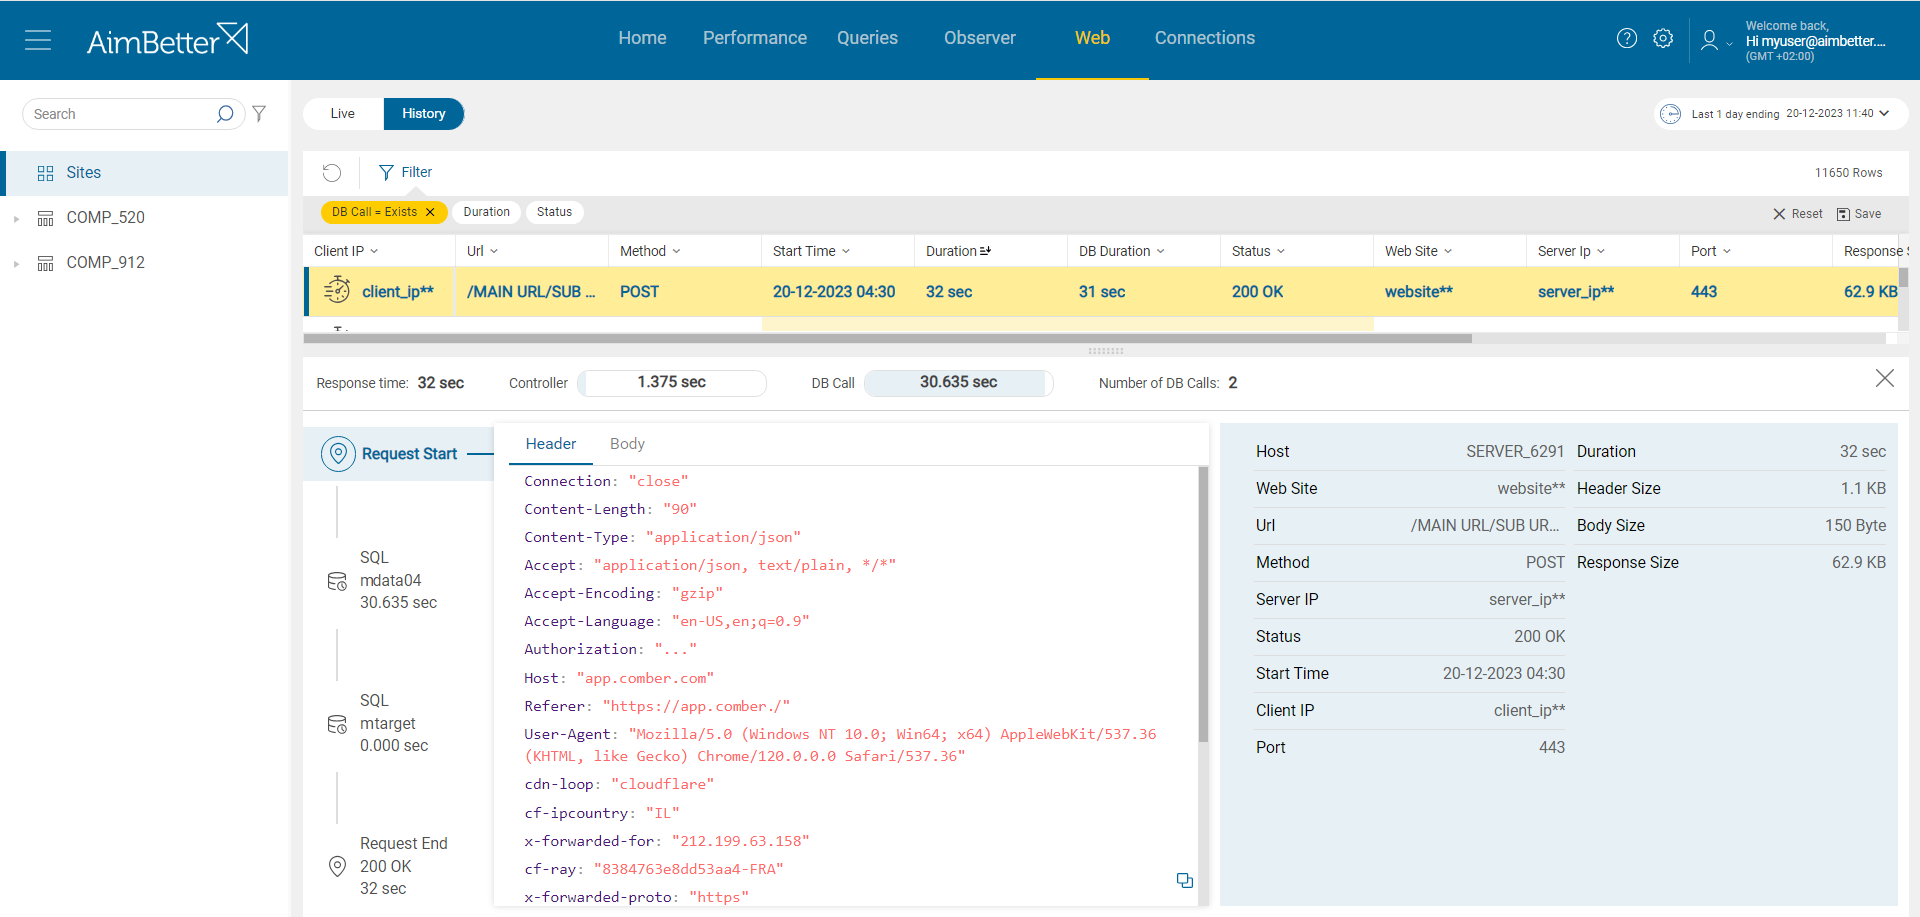
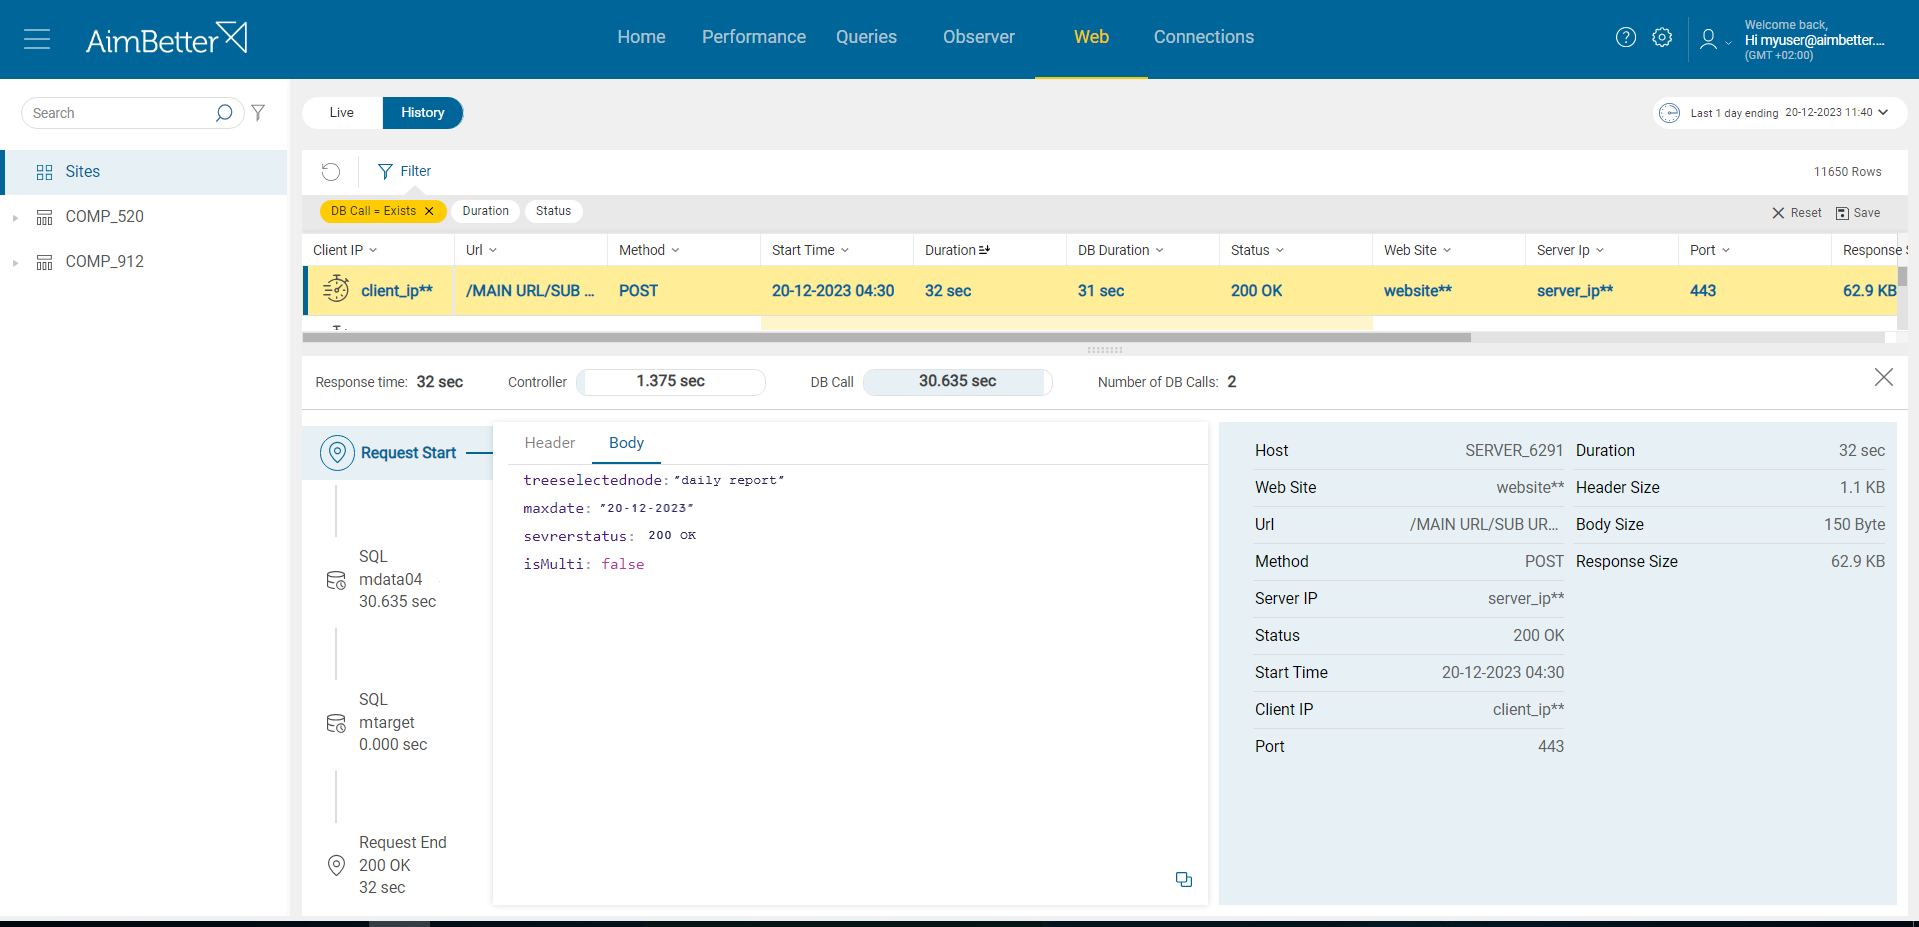
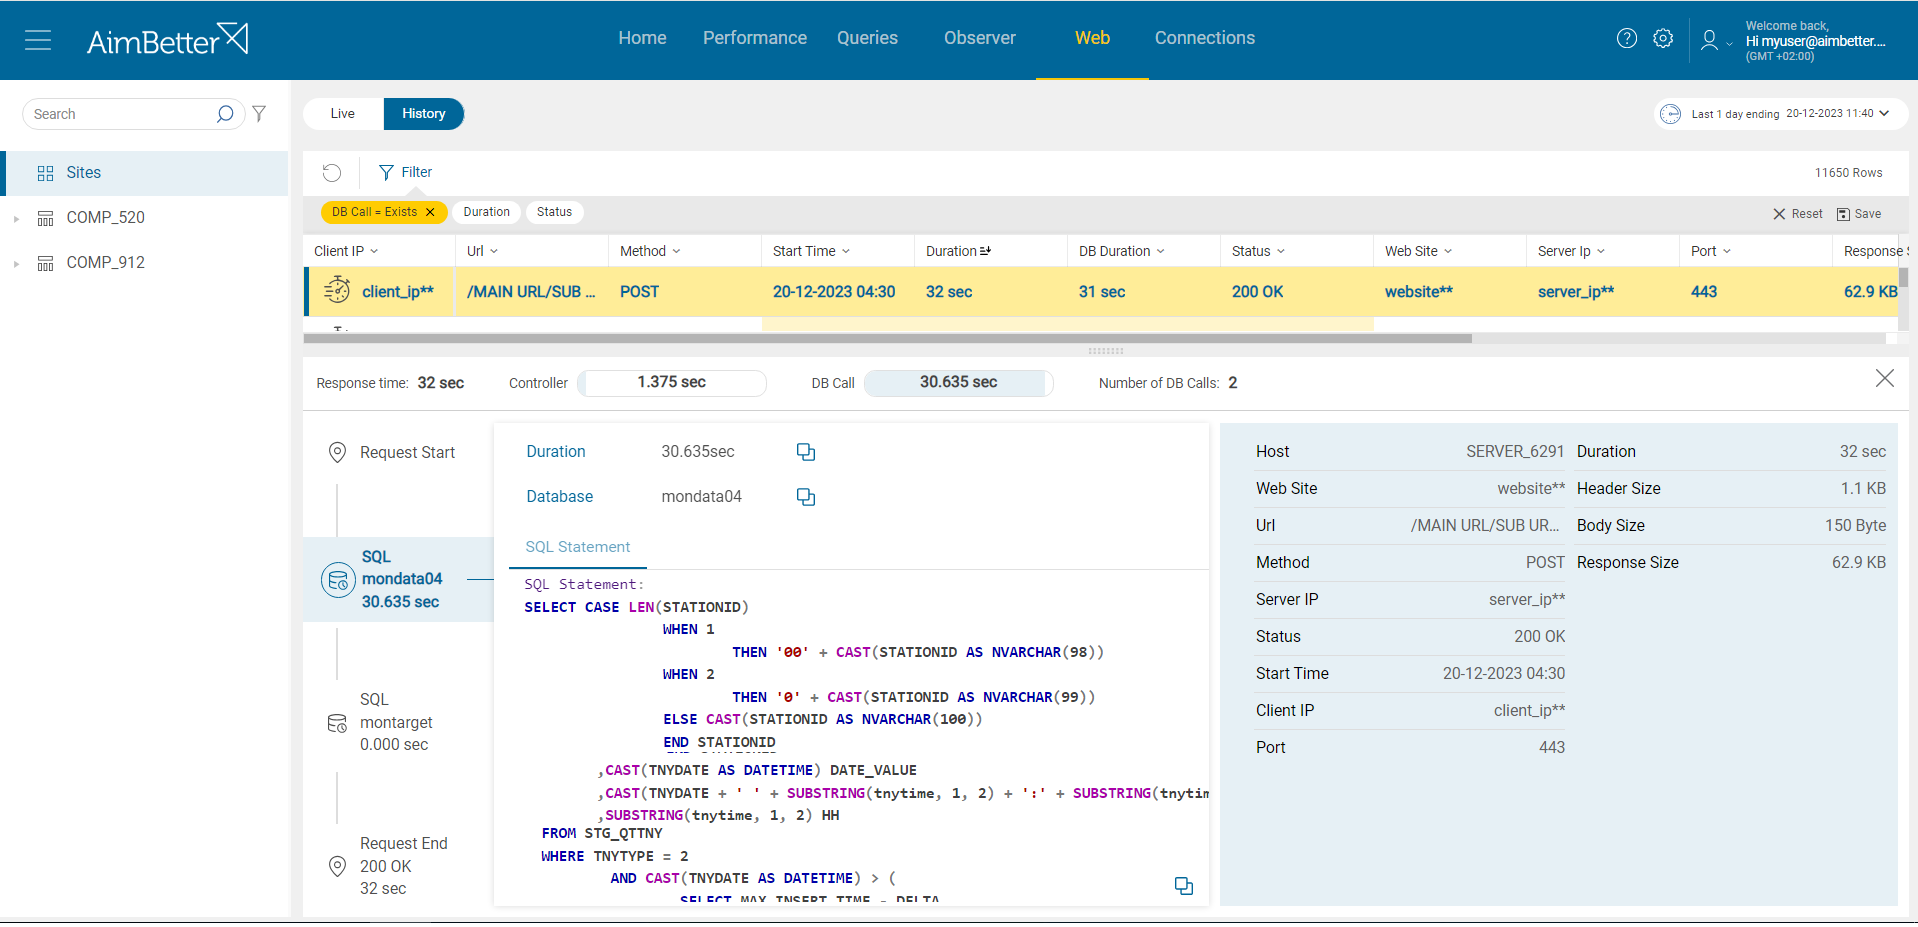
✓ Real-time comprehensive analysis of all HTTP requests
✓ Requests’ complete flow detailing the impact of different processes on the response time
✓ Identification of requests issues, including users and application details
✓ Multiple filtering options to focus on what matters most
✓ Header and Body page parameters
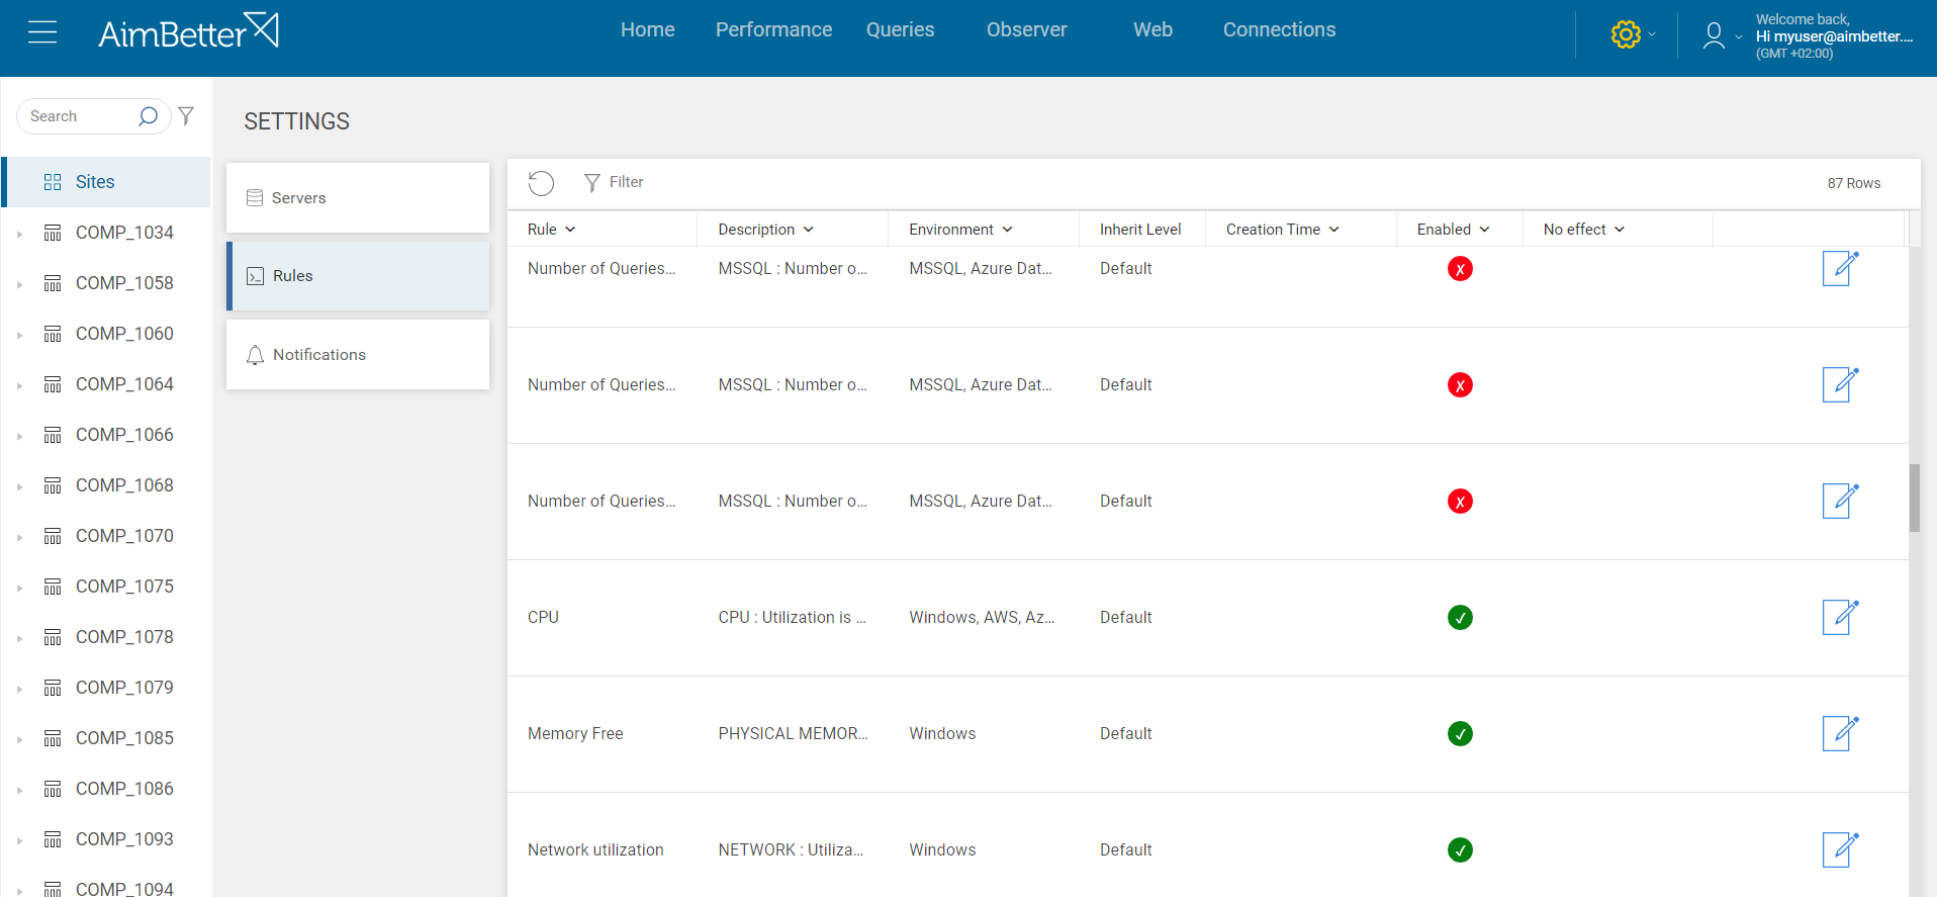
✓ Manage floating license by enabling/disabling Servers from monitoring
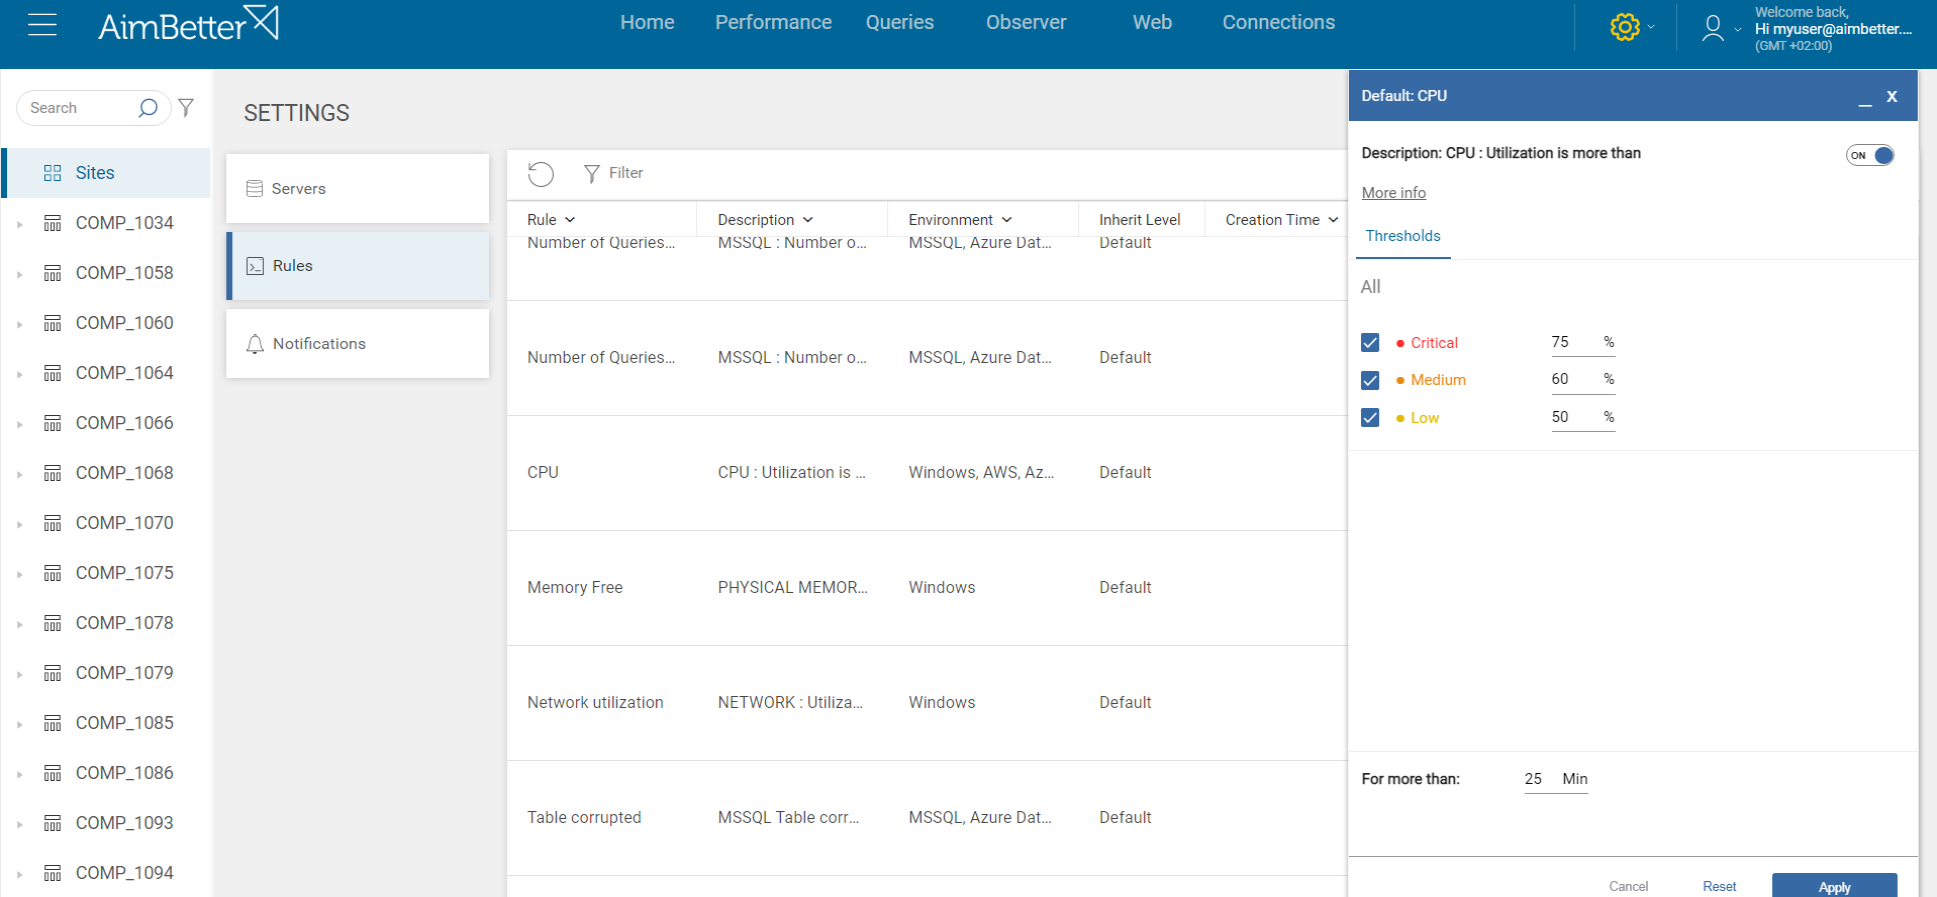
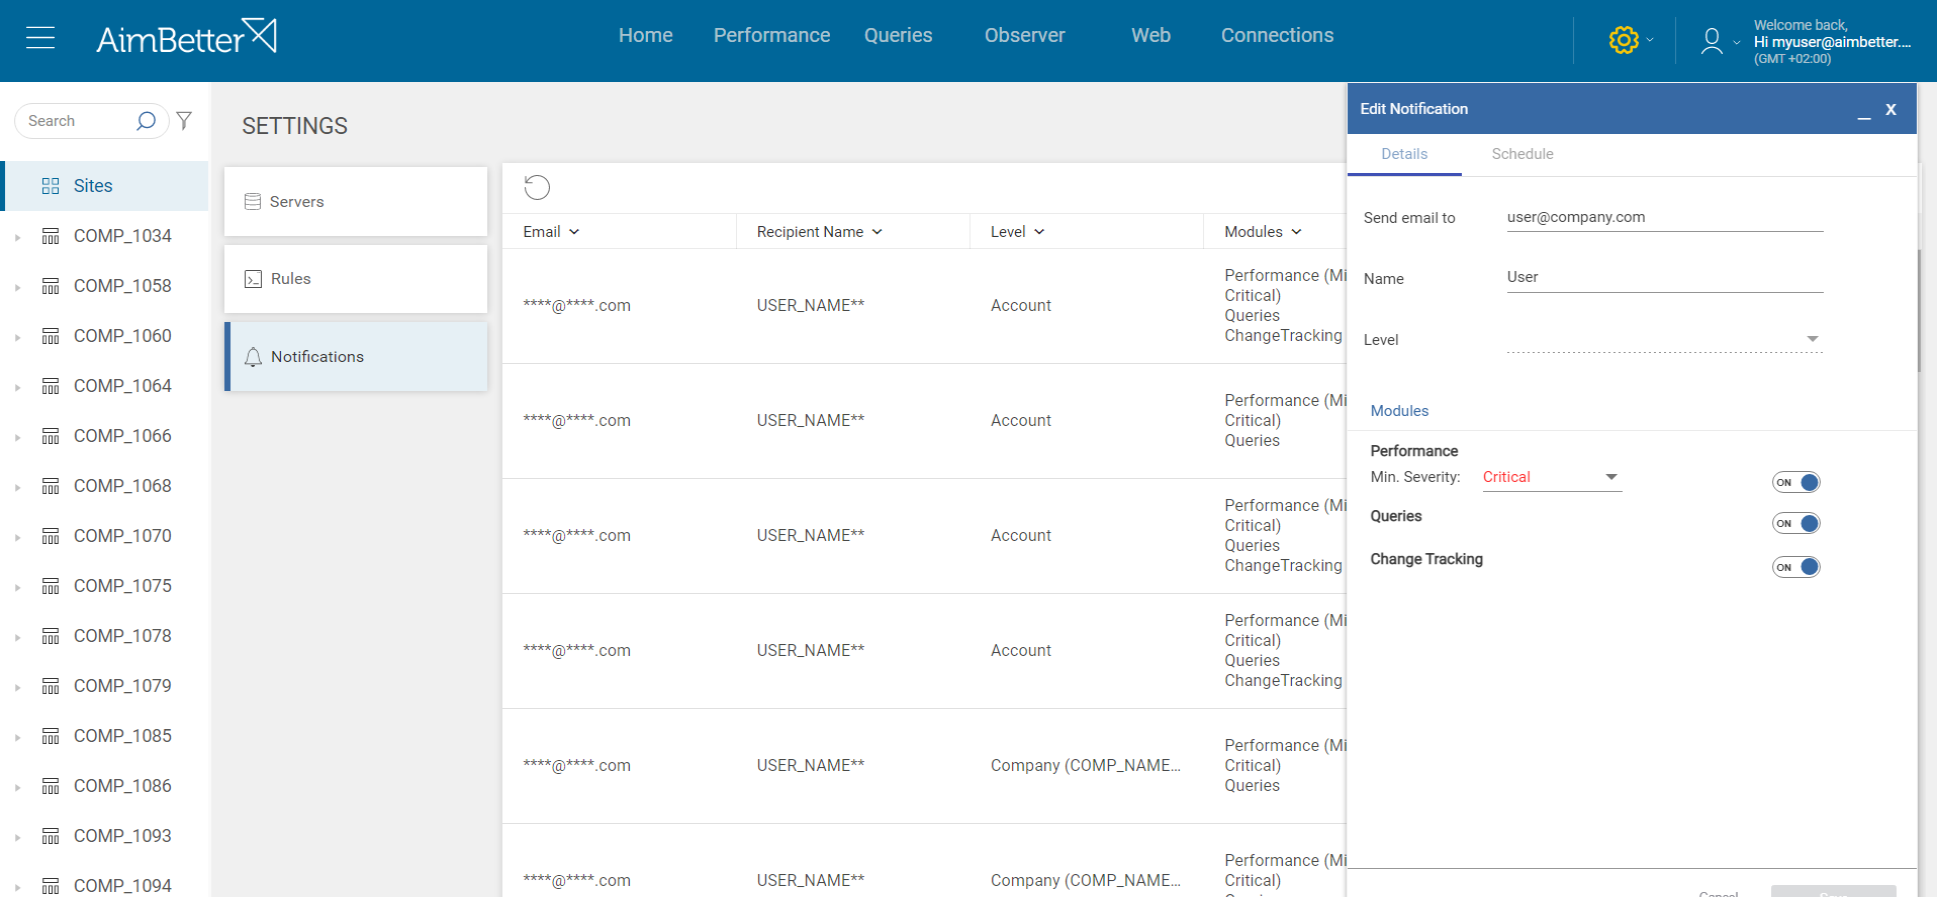
✓ Customize which events will be notified
✓ Edit and configure each alert severity threshold and other parameters
✓ Set additional emails for notifications
✓ Define Maintenance time to freeze email notifications for a determined period
AimBetter stands out for:
Real-Time Diagnosis
✓ Sys-DB-App-Client Cross-information analysis
✓ Pinpoints the root cause in real-time
✓ Proactive smart notifications
✓ Shortens the Troubleshooting time
✓ ML continuous improvement
✓ Automatically detects code, security, data loss issues, and much more
Powerful DBA Capabilities
✓ Millions of queries/minute
✓ Execution plan analysis and download
✓ Plan improvement recommendations
✓ Missing index suggestions
✓ Top resource-consuming queries
✓ Followup on DB growth and Backups for optimal maintenance
Seamless Integration
✓ 5-minute Installation
✓ Friendly & Intuitive for all the IT Team
✓ Ready to Use Solution
✓ 100% SaaS, no System Overhead
✓ Hundreds of Built-in Metrics
✓ Scalable, great for Enterprise and SMBs
Benefits

Productivity Enhancement
✓ IT Professionals can focus on creative work
✓ Smooth system performance
✓ Management comprehensive view
✓ Better IT Team Cooperation
✓ Improved customer experience
Cost Savings
✓ Save IT professionals time
✓ Save on users’ efficiency
✓ Save on downtime
✓ Increase sales
✓ Save on unnecessary infrastructure addition

