In SQL Server, session wait times measure how long a session waits for resources before it can proceed. Tracking these waits helps identify performance bottlenecks and system inefficiencies.
A SQL Server worker thread is in a waiting state when it cannot proceed because it is blocked, typically waiting for a resource, a signal, or an external process to complete.
A thread leaves the waiting state (i.e., is no longer waiting) when:
-
The required resource becomes available.
-
There is work in the queue and it has been assigned to the thread.
-
An external process it was dependent on has completed.
SQL Server Wait Categories
Waits are classified into the following main types:
-
Resource waits: Threads are blocked by unavailable resources (e.g.,
LCK_M_IXfor locks,PAGEIOLATCH_SHfor disk I/O, or memory contention). -
Queue waits: Threads are waiting to be assigned work (e.g.,
ASYNC_NETWORK_IO,QUEUE_WAIT). -
External waits: Threads are waiting for external processes to respond (e.g., linked servers, extended stored procedures).
Diagnosing Performance Issues with Waits
-
Query-level waits can help pinpoint bottlenecks in execution plans.
-
Server-wide high wait times or counts may reveal contention or resource saturation.
For example:
-
Lock waits indicate query-level contention for data.
-
Page I/O latch waits suggest slow disk performance.
-
Page latch update waits may indicate inefficient data or file layout.
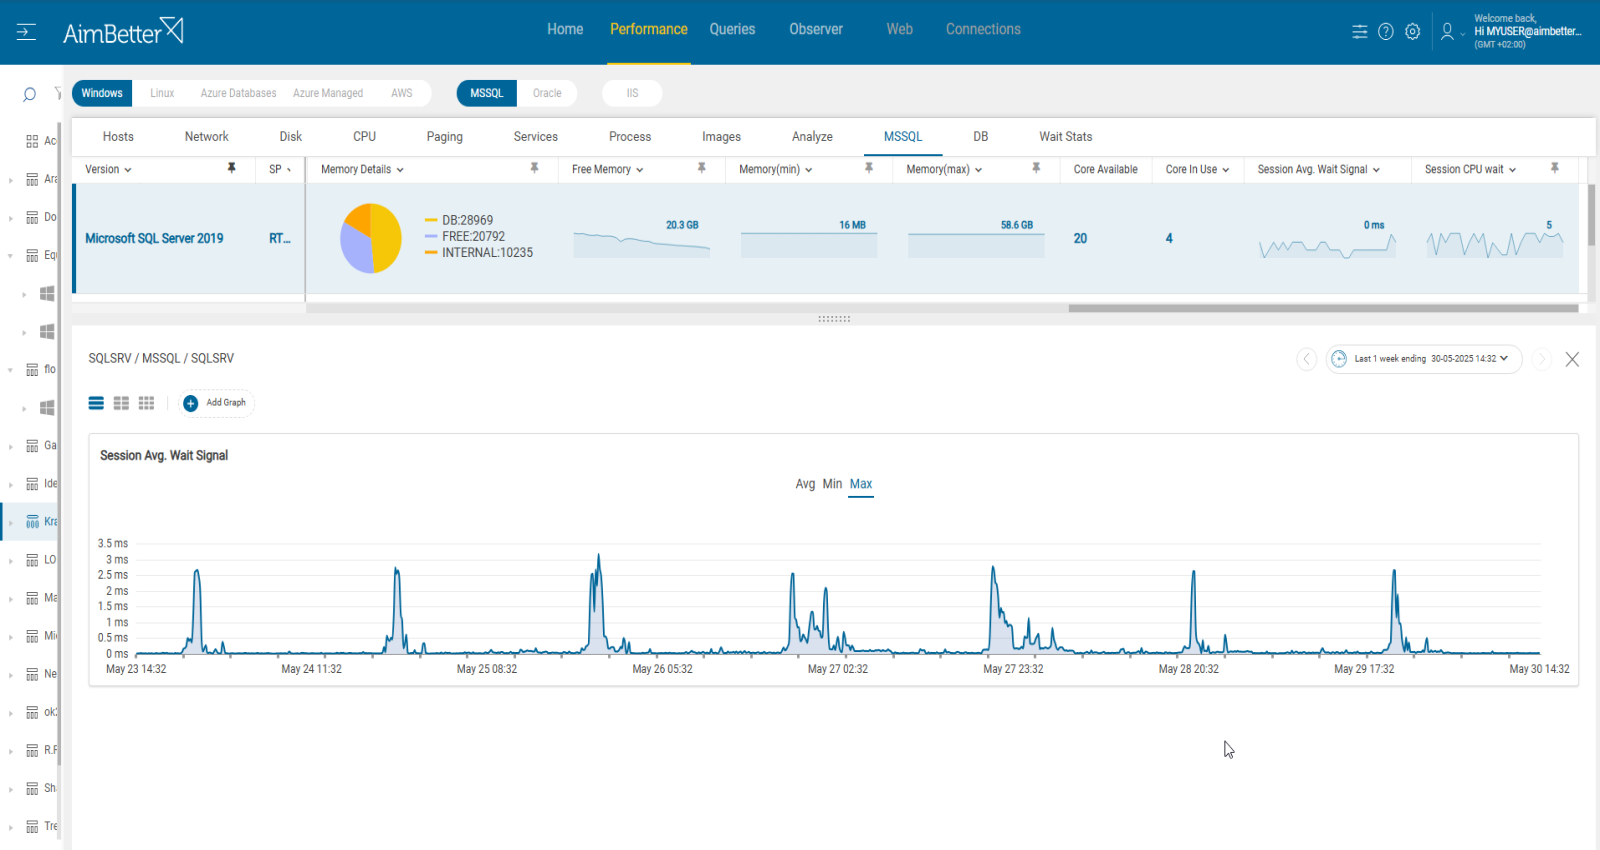
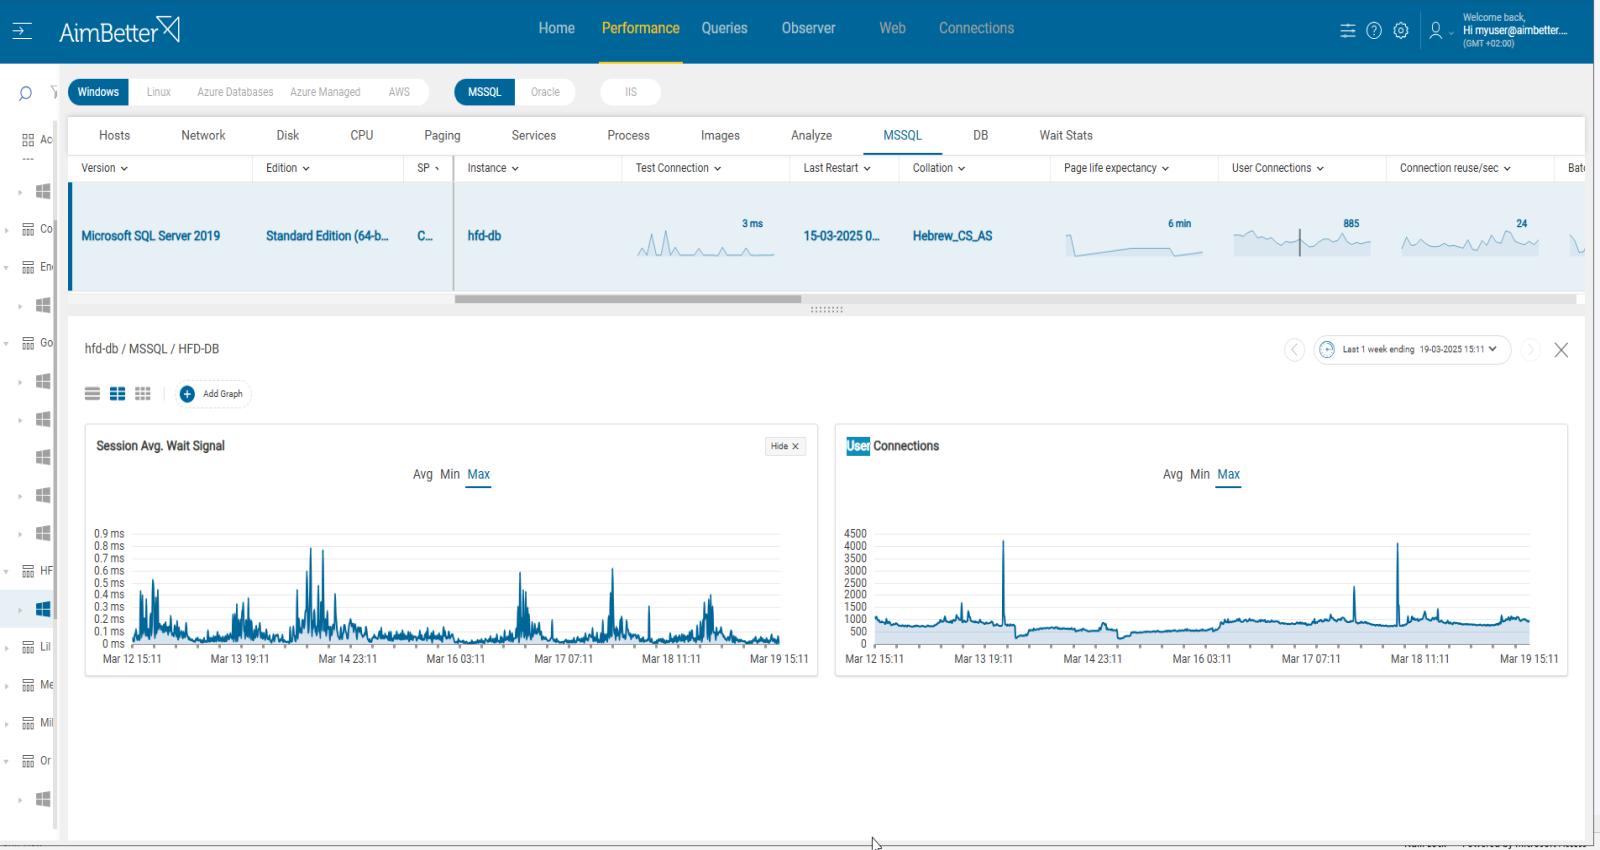
The average wait time for the SQL session is high.
Impact: Medium
This metric represents the average wait time in seconds that SQL reports that is in a wait state. It is an indication of degradation in server performance.
Expected behavior
There is no standard metric for wait time. You should set your own thresholds after reviewing past behavior.
Threshold settings
CRITICAL : 5ms
MEDIUM : 3ms
LOW : 1ms
Timespan : more than 5 minutes
Possible causes for high average session wait stats
1.Poor coding and inefficient query execution plan. Priority : Medium
Execution plans provide valuable insights into how the queries are being processed and help to identify areas where inefficiencies exist.
Queries that are with inefficient query execution plans can lead to poor performance, inefficient data access, and increased resource usage. This can include missing or outdated statistics, inappropriate use of joins or subqueries, unnecessary sorting or grouping, or inefficient use of functions.
Problem identification:
Identify queries with non-optimal execution plans in parallel to finding out that queries sessions are waiting to run.
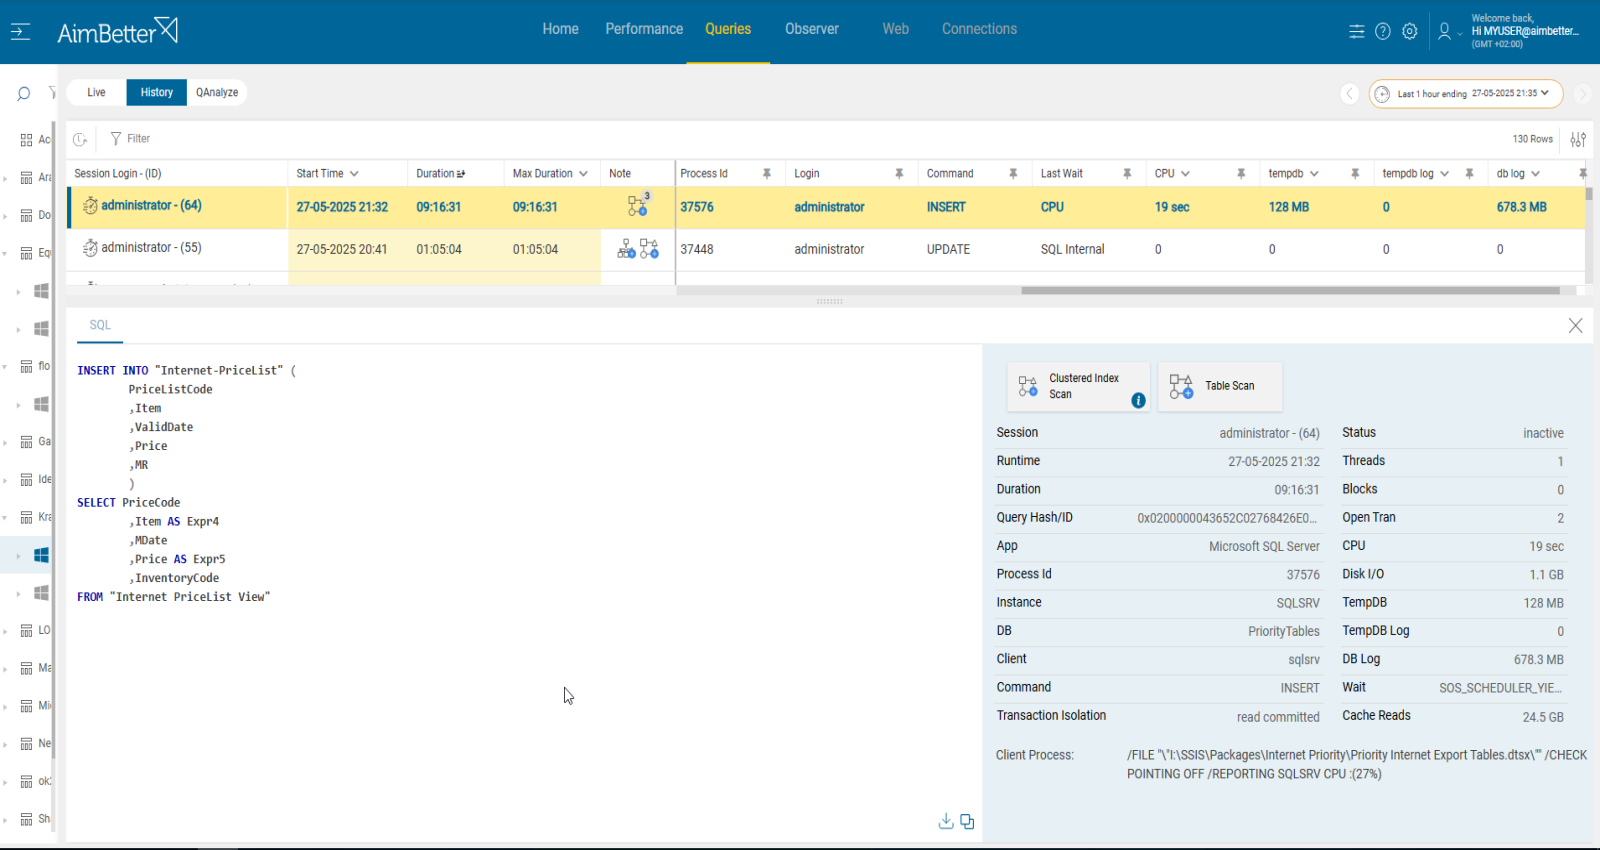
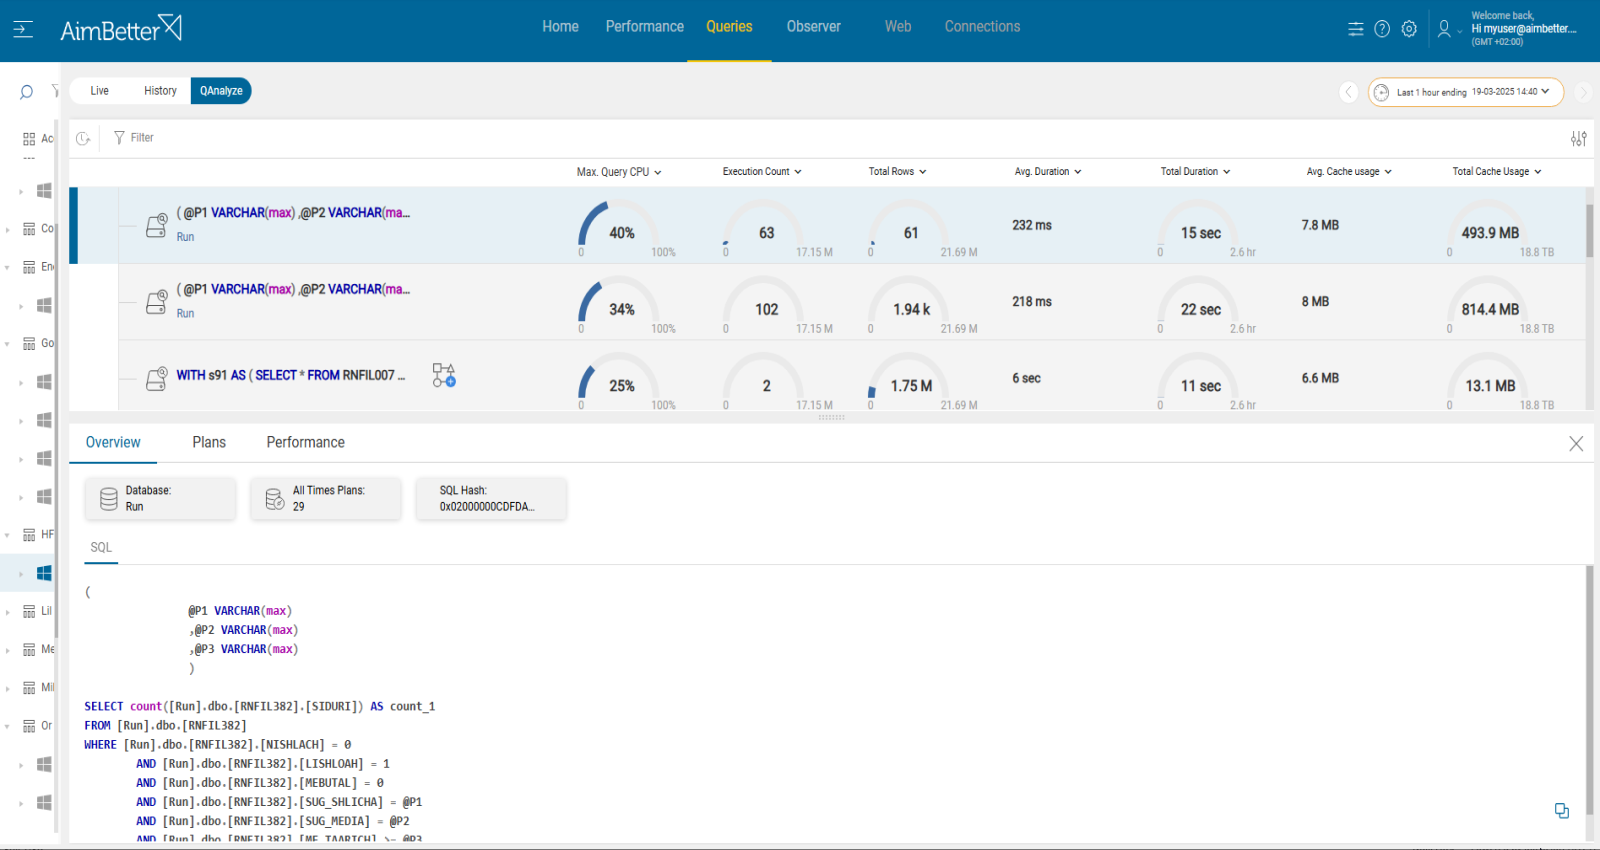
1.Track the database server activity: identify sessions waiting in the runnable queue, you should write a script for that, with a DBA. In AWS environments (RDS), you can use Performance Insights to check wait events. In addition, For Azure, you are able to use Query Store and Azure Monitor. Look for the queries’ status and wait time count. Look for SOS_SCHEDULER_YIELD.
2.Identify which queries have high execution time and count them. For SQL Server, you can use the built-in activity monitors or SQL Profiler. This mission might be complicated and take hours or days of work, requiring a highly skilled DBA.
3.Investigate the query code and execution plan, trying to look for execution plans that are not optimal, for example- sorting or table scan. To get this data, you have to run the query live from the management studio again, which might increase the overload and investigation time of this issue.
4.After performance tuning, check again the waiting sessions in the runnable queue and check if the wait time decreases.
Recommended action :
Investigate the execution plans, look for bottlenecks, and try to optimize accordingly.
You should consult a DBA who understands the data model before making these changes.
Best practices for coding should be strictly enforced, to ensure that all queries optimally consume and then release resources.
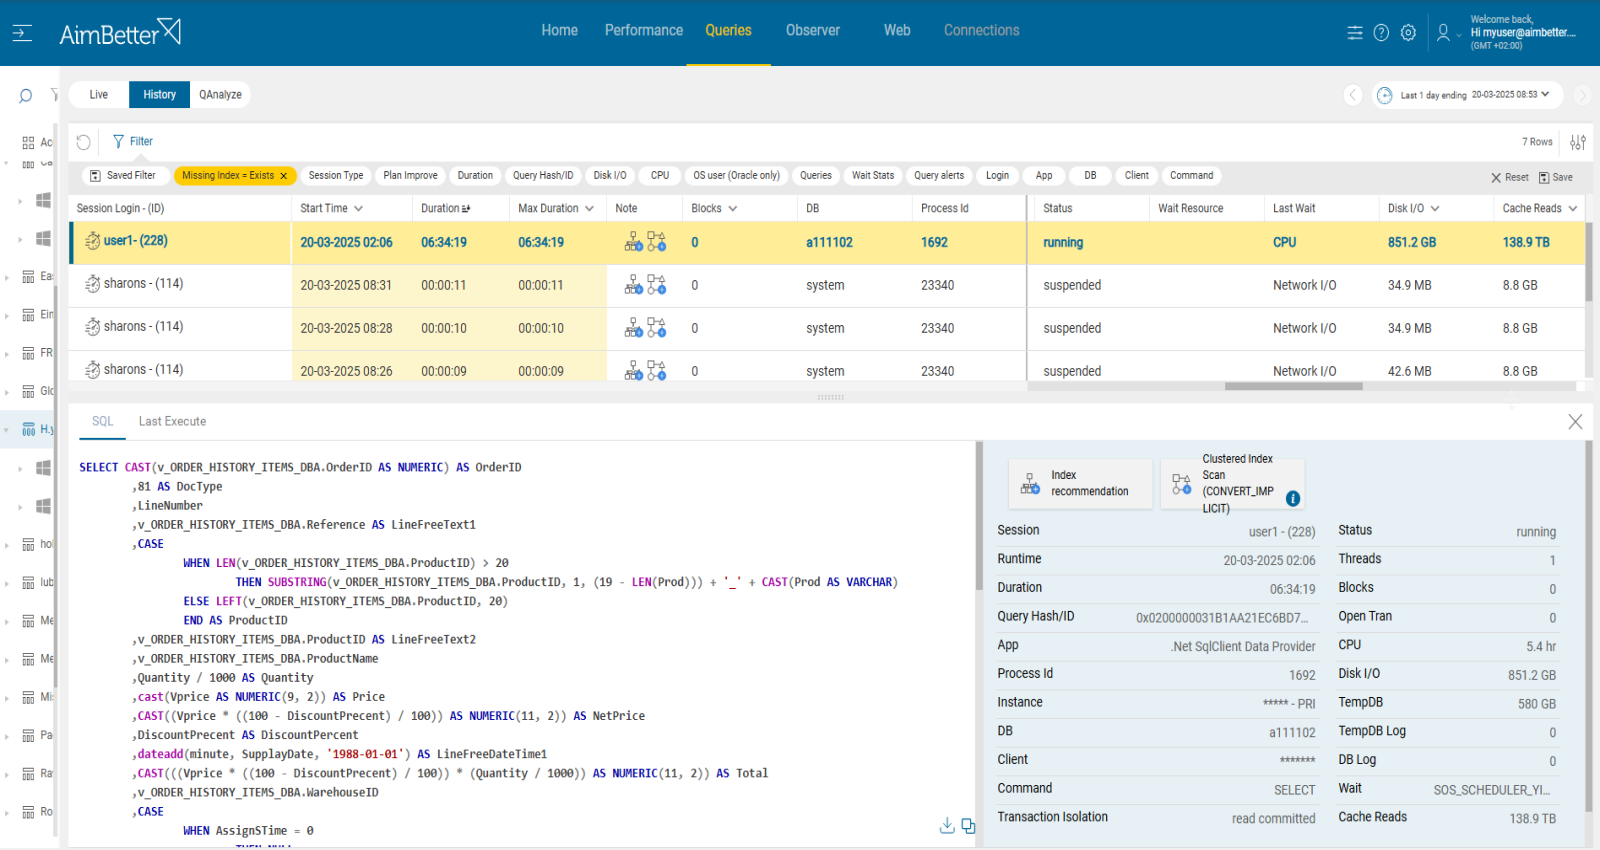
2.Index missing or corrupted Priority: Medium
Missing or corrupted indexes can lead to queries working inefficiently and consuming resources. It might force queries to scan entire tables, using excessive CPU.
Problem identification:
Identify queries with missing indexes in parallel to finding out that queries session average wait time is high.
1.Track the database server activity: identify sessions waiting in the runnable queue, you should write a script for that, with a DBA. Look for the queries’ status and wait time count. Look for SOS_SCHEDULER_YIELD.
2.Identify which SQL statements have high execution time and consume most resources. For SQL Server, you can use the built-in activity monitors or SQL Profiler. For Azure and AWS, you should use Performance Insights or Query Performance Insight. This mission might be complicated and require hours or days of work, requiring a highly skilled DBA.
3.Check which out of all queries that have missing indexes run in parallel to times when the sql sessions wait time is high.
4.For the selected queries, investigate the query code, looking for missing indexes or corrupted indexes. To get this data, you have to run the query live again from the SQL Server Management Studio, which might increase the overload and the investigation time of this issue.
5.Examine index usage and fragmentation: Evaluate the use and fragmentation of indexes in the database. Unused or fragmented indexes can impact query performance.
All running queries can be viewed from a single screen with the same panel where you can easily reach the session average wait, available data 24/7.
The missing indexes are available immediately, even when the queries run live!
No need to waste time waiting or running them again, including notes showing recommendations for improvements.
Recommended action :
-Make sure you use proper indexes; add or delete indexes if necessary.
-Optimise queries that use massive sporting and joins.
-Make sure to update statistics in routine.
3- Long running queries or too many queries. priority: medium
Transactions held open for extended periods of time or queries running too long might cause a major increase in sessions wait. When queries run for too long, it might be due to several reasons: poor coding, missing indexes, unclosed connections, or maintenance tasks.
Problem identification:
Identify queries that are running long or with open transactions and check if, in parallel, there is an increase in queries session average waiting time.
1.Use tracking tools (such as SQL Server Profiler For SQL Server) in order to identify query transaction isolation levels or long-running queries without open transactions. It might be complicated since you have to prioritize these events (by duration or resources) and make sure you have all details needed. Count the number of existing connections by using scripts.
2.Using SQL Server Management Studio (SSMS) ,navigate to the Activity Monitor. This provides online information about user connections, yet you don’t have history data to compare with in order to decide what is the source of the increased activity. Query SQL Engine system views to identify repeated patterns of many connections. For Azure and AWS you are able to use Performance Insights.
3.Identify sessions waiting in the runnable queue, you should write a script for that, with a DBA. Look for the queries’ status and wait time count. Look for SOS_SCHEDULER_YIELD.
4.Check if queries are running long or there are too many of them when the sessions’ average waiting time is high.
5.Depending on the situation, you might need to optimize the queries.
It’s easy to follow up on historical behavior with one month of data available in a user-friendly environment.
You will receive a notification once there’s an increase in sessions average waiting time and/or higher query sessions than usual and/or long running queries.
All data is available in a user-friendly panel.
Recommended action :
Analyze and optimize frequently executed queries to reduce execution time and resource consumption. Avoid running too many operations at once if possible.
Break complex queries into simpler steps to reduce their execution time and the likelihood of keeping transactions open for extended periods.
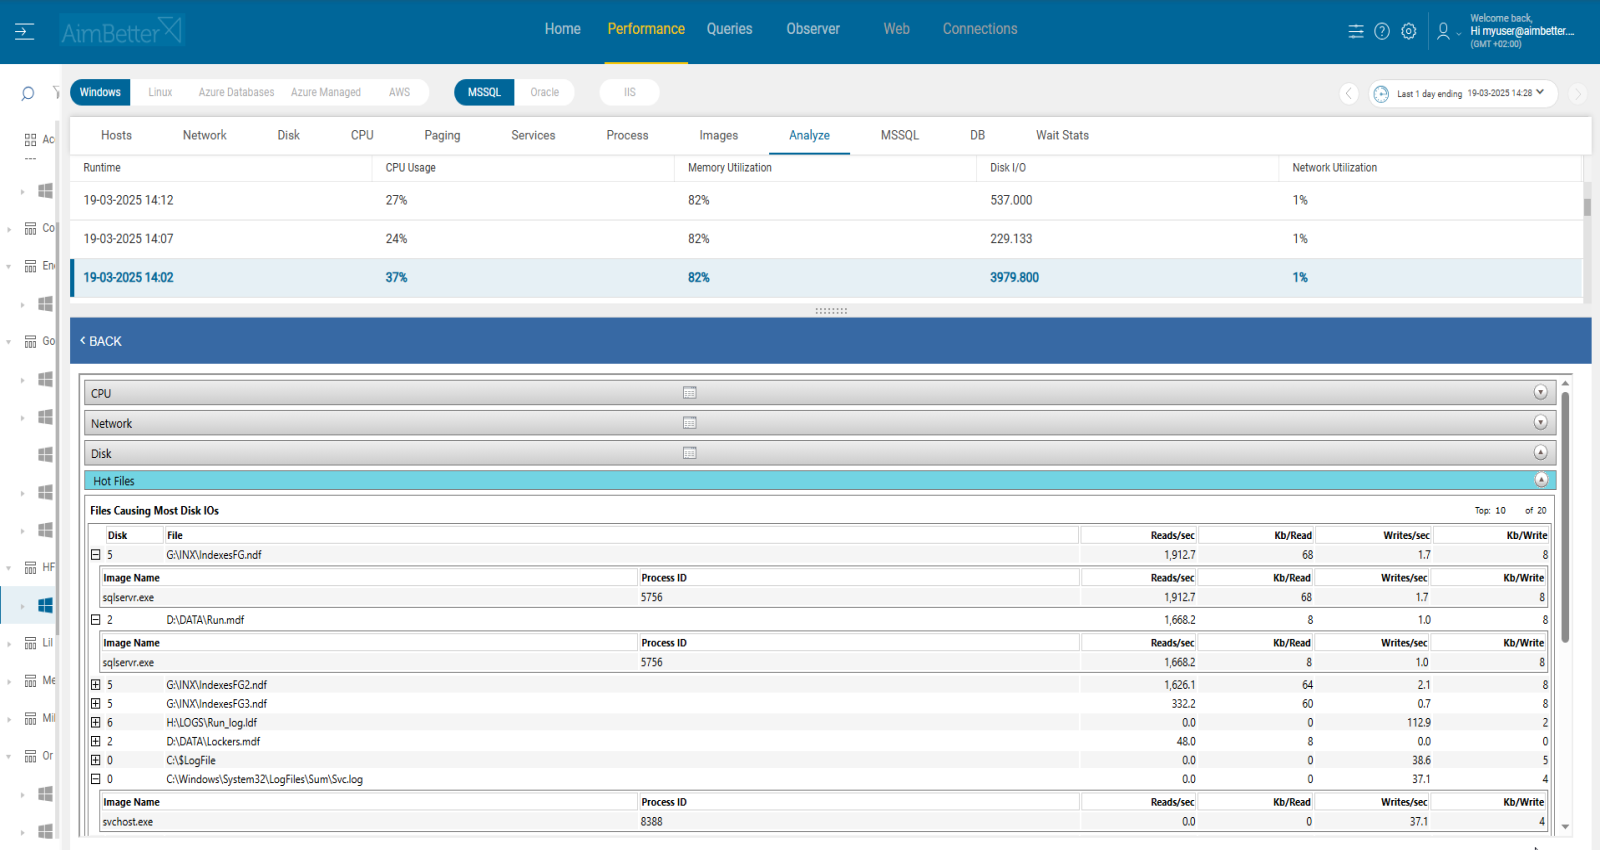
4.Cpu or Disk I/O Overload, Priority: High
Overloaded server resources such as CPU and disk I/O can slow down query execution. It might happen due to a specific application or many processes running simultaneously. These processes might be external operations such as anti-virus scans, backups, and restores from networked data stores.
Other cases might be that the resource settings do not fit the requirements of the instance operation—for example, there are not enough cores or disks are set improperly.
When that happens, queries experience high latency , thus they wait for resources before processing. Specifically for SOS_SCHEDULER_YIELD wait type, it happens when a thread voluntarily yields the CPU but has to wait before getting scheduled again. This may cause average session waiting time to be higher.
This paragraph fits for databases in Windows or Linux servers.
Problem identification:
Identify overload of CPU and disk utilization in parallel to queries sessions waiting.
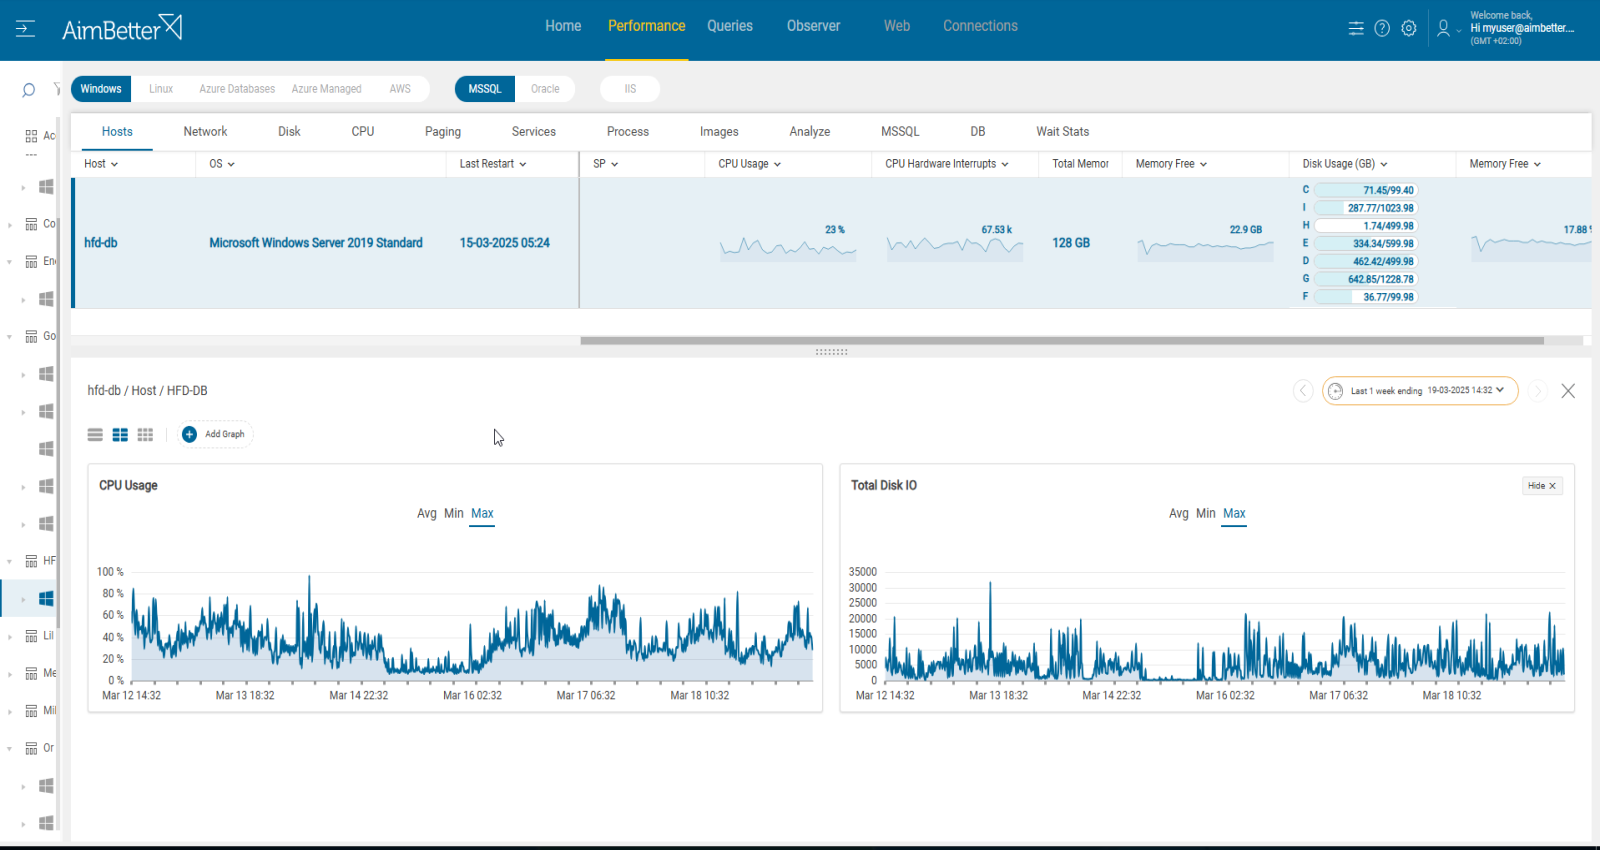
1.First, you have to identify the overload. For Windows OS, you can check the Task Manager to identify an overload of hardware resources. For Linux, you can check with the commands “top” for CPU and “iostat” for Disk I/O.
2.Use OS tracking tools such as Performance Monitor(for Windows OS ),or Performance Co-Pilot(For Linux), to identify which processes use hardware resources. Take into account that most tools help pinpoint when a problem starts, which you can’t compare to old time frames.
3.Check whether query sessions wait time has increased in parallel to OS resources overload. Identify sessions waiting in the runnable queue, you should write a script for that, with a DBA. Make sure to look for SOS_SCHEDULER_YIELD.
4.If so, treat the sources of the overload.
Cancel unnecessary programs that cause high hardware utilization. When possible, reschedule non-essential activity (e.g., virus scans, backup, etc.) to hours of lowest SQL demand.
Consider upgrading hardware if possible.
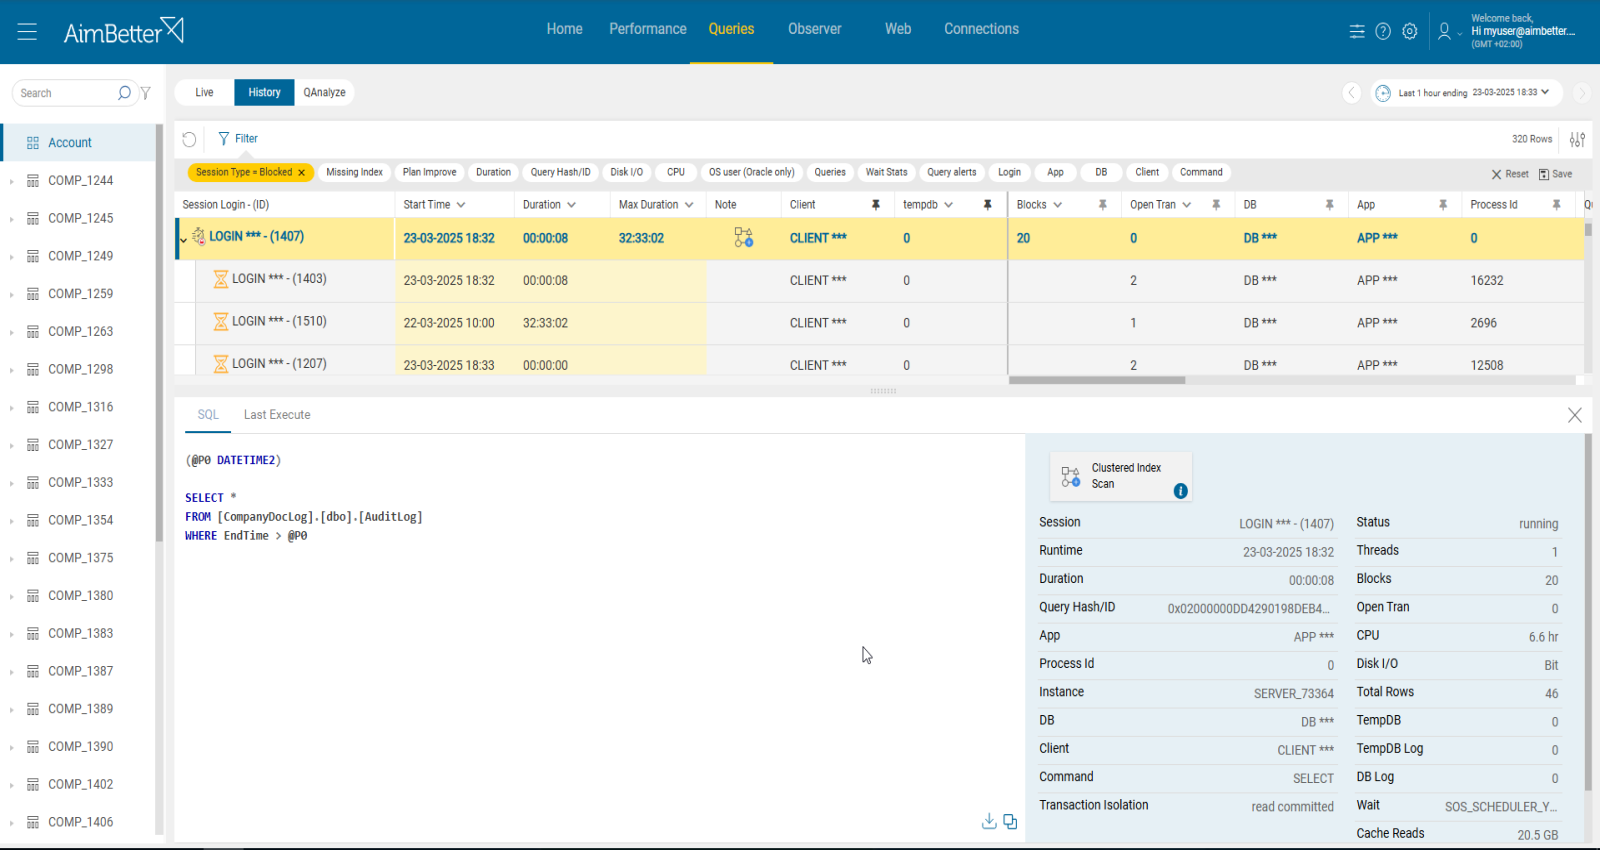
5.Blocking queries, Priority: Medium
A blocking query is a database query that causes other queries or transactions to wait or be blocked until the blocking query completes its execution. Blocking occurs when one process holds a lock on a specific resource and a second one attempts to acquire a conflicting lock type on the same resource.
Multiple queries may be waiting on the same locked resource, leading to a chain reaction where blocked queries further block others. This amplifies the total wait time in the system.
Therefore, session average wait value increases.
Problem identification:
Identify blocking query events related to SQL sessions’ delay.
1.Track the database server activity: check active sessions for blocking by running a script. This should be done by a DBA, since you have to run several scripts before getting the relevant result of the blocking query text and execution plan.
2.Identify sessions waiting in the runnable queue, you should write a script for that, with a DBA. Look for the queries’ status and wait time count. Look for SOS_SCHEDULER_YIELD.
3.If high SOS_SCHEDULER_YIELD is detected, look if the blocking queries are consuming excessive CPU.
Recommended action:
The blocking queries should be optimized. This class of blocking problem may just be a broader performance problem- lack of statistics, indexing, and more.
Applications must properly manage transaction nesting levels, or they may cause a blocking problem following the cancellation of the query in which a transaction was open.
You can read more about blocking queries here: https://www.aimbetter.com/sql-block/


