A blocking query is a database query that causes other queries or transactions to wait or be blocked until the blocking query completes its execution. Blocking occurs when one process holds a lock on a specific resource and a second one attempts to acquire a conflicting lock type on the same resource.
The occurrence of blocking is closely related to the time elapsed between query start and completion. The duration and nature of a query determine how long its locks are held and their impact on other queries.
For SELECT statements (if the query is not executed within a transaction and no lock hints are used), the locks will only be held on a resource at the time it is actually being read, not for the duration of the query. As long as data is appropriately organized and elements such as caching and page files are optimal, this should rarely generate a block.
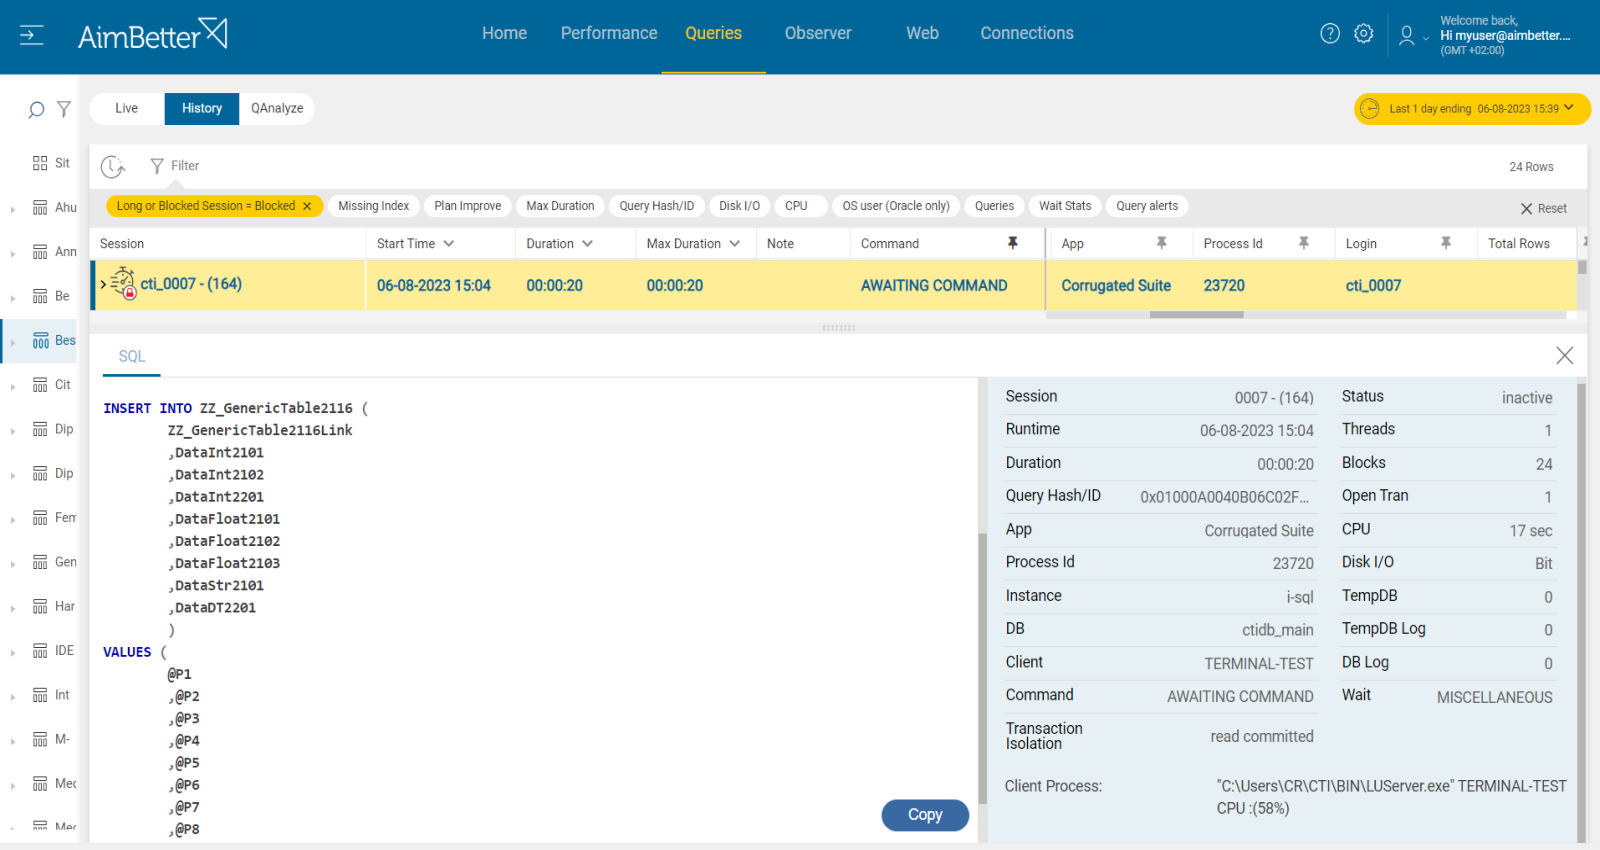
For INSERT, UPDATE, and DELETE statements, the locks are held for the duration of the query, both for data consistency and to allow the query to be rolled back if necessary. The chances of a block being generated are higher.
Without a full picture of the conflicting calls causing the block, it can be wasteful to try and resolve the issue via code or resource optimization.
Find out how you can save hours of work when investigating the root cause of this issue.
Symptoms :
Queries are running longer than expected.
Impact: Medium
A blocking query may cause disruption to the performance of specific users trying to access the same data.
Expected behavior :
The time frame during which the first process locks the resource should be very small. When it releases the lock, the second connection is free to acquire its own lock on the resource and continue processing.
Longer blockings might interrupt the optimal business flow and may occur in parallel to an increase in usage (more transactions, queries running longer, increased disk I/O, and more).
Possible causes of long blocking queries:
1- A process is in a rollback state Priority: Medium
A query is in a rollback state when it has not completed a process of modifying data due to being killed or canceled. For example, when the client has been restarted, or a query was chosen as a deadlock victim, then it’s forced to be canceled.
This situation might cause blockings when the query’s statements take a while to run due to a rollback.
When a query performs updates and changes, it has to be completely rolled back in order to cancel all modifications.
Problem identification:
Identifying the query that has been rolled back might be challenging and needs to be sorted out from numerous blocking queries.
- Check database logs which probably record rolled-back queries, and analyze them. This task might be inconvenient and take time.
- Check the application logs (if relevant). For that, you have to know well the related apps to your database and know where these files are located. You should also try searching for errors and exceptions if the rollback has been forced because of it.
- Run scripts questioning system views or tables to check the status of specific transactions and identify those that have been rolled back. A professional DBA should do this.
- Check for blocking query events and cross them with the rolled-back queries. You might use tracking tools such as SQL Server Profiler.
Recommended action :
You can’t force the rolled-back query to stop. You must wait until it finishes. If doing it, take into account that the database will change the recovery mode to be inaccessible to new transactions, and you will have to restore it. We would recommend avoiding running larger batch queries during busy working hours and postponing them to maintenance times.
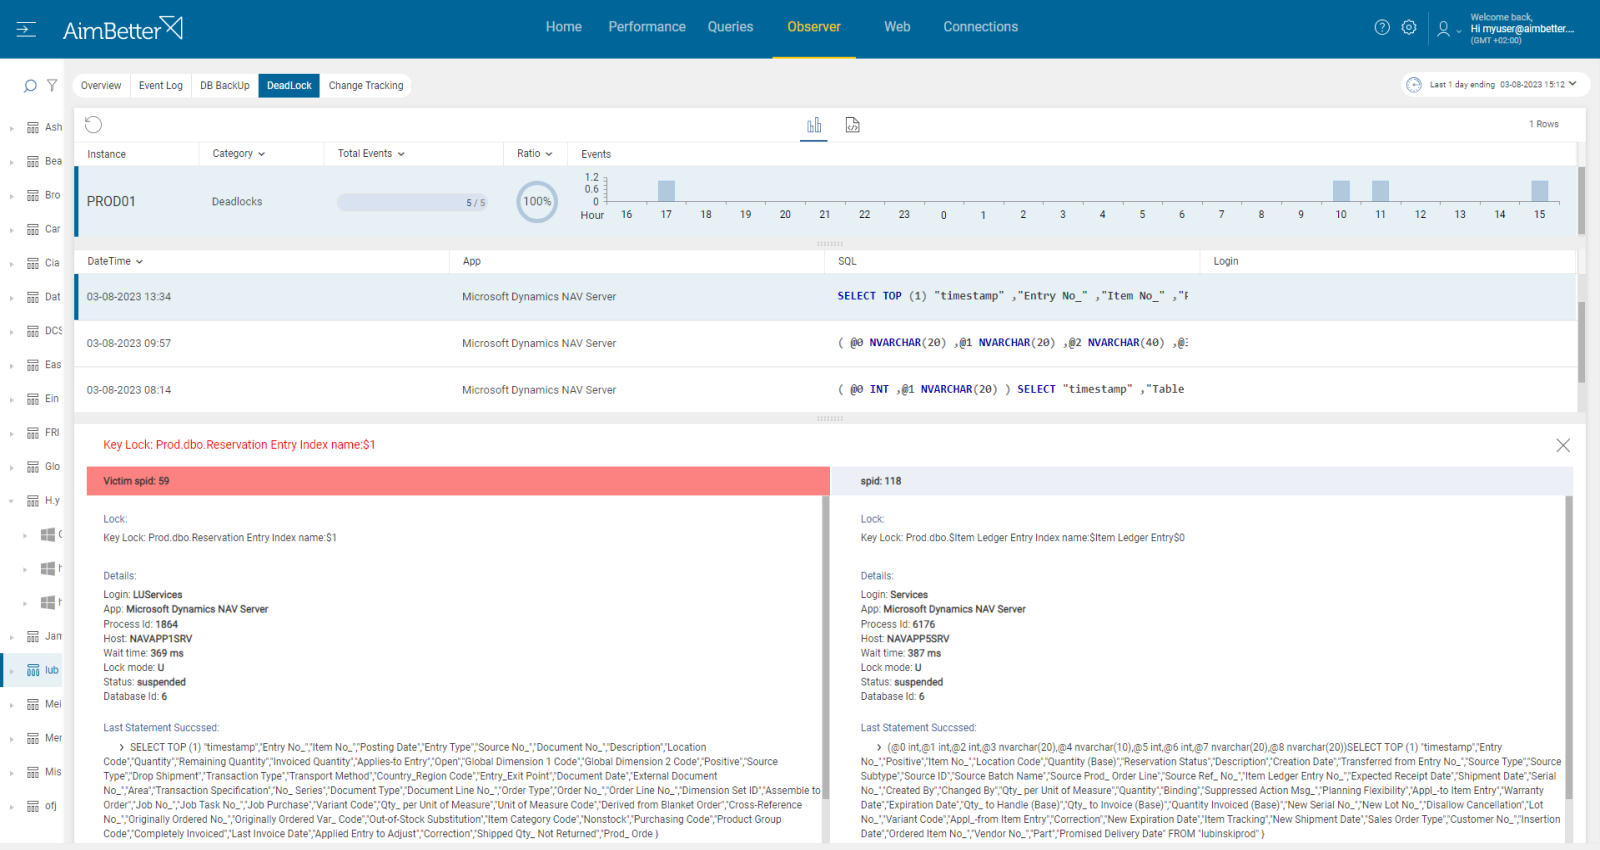
2- A distributed deadlock Priority: High
There is a difference between deadlock and distributed deadlock.
Deadlocks happen when multiple processes or threads are waiting for resources that are held by one another at the same resource (instance).
Distributed deadlocks happen when a distributed query involves multiple nodes and requires data from different sites. In this case, a query may block if some nodes are holding locks on resources that other nodes need to complete the query.
Unlike a conventional deadlock, a distributed deadlock is not detectable using the lock manager due to the fact that only one of the resources involved in the deadlock is a SQL Server lock. The other side of the deadlock is at the client application level or another node, over which SQL Server has no control.
Problem identification:
Identify the queries that were involved in distributed deadlocks while crossing them with blocking query.
- Check logs of queries and transactions in both nodes- database and application, or two other nodes. For that, you have to know well your database environment. By analyzing the logs, you may be able to identify queries that are frequently blocking and causing deadlocks. It might take time and be tiring even when knowing where to search. Other tools like Distributed Lock Managers (DLMs) can help in tracking the state of locks and identifying potential deadlock situations.
- Update a transaction timeout value. Once a transaction takes too long to complete, it might be a good indication of a deadlock.
- Set proper exception recordings (for SQL server, you can also use extended events) in order to catch details about deadlocks events. Take into account that you will only track historical events.
- Check for blocking query events and cross them with the distributed deadlocks events. You might use tracking tools such as SQL Server Profiler.
Recommended action :
Applications must properly manage transaction nesting levels, or they may cause a blocking problem following the cancellation of the query in this manner.
In addition, make sure that resources are allocated well-balanced between different nodes.
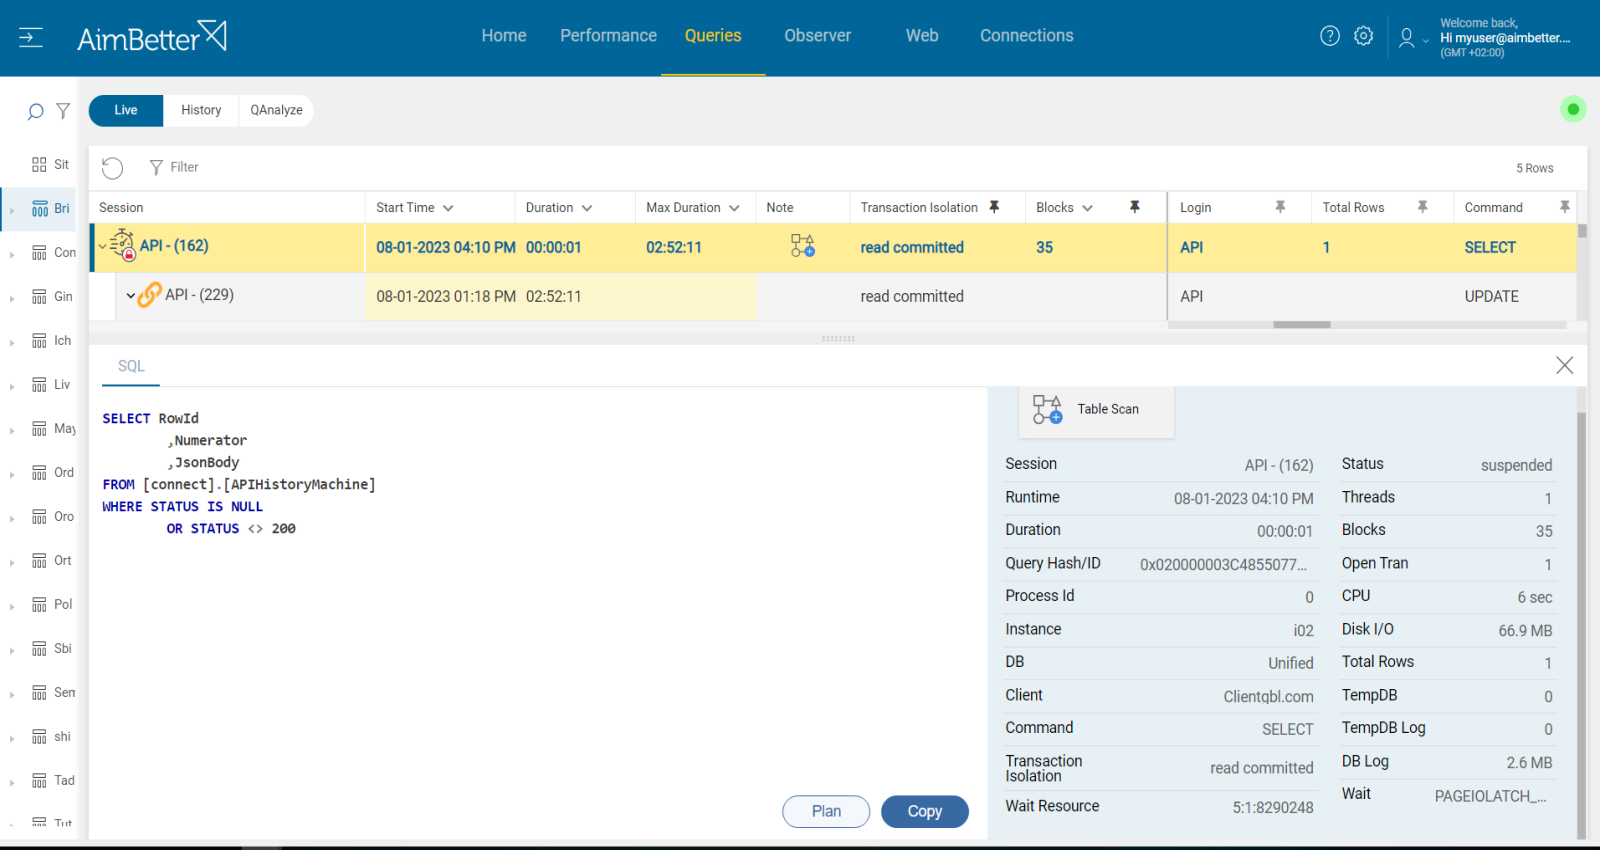
3- Unrecommended Transaction Isolation levels Priority: Low
Except for read uncommitted, any other set of transaction isolation might cause a blocking query. When a query is set to read committed, it acquires shared locks on data when reading, which prevents dirty reads. Therefore, it can lead to blocking when several transactions access the same data.
Problem identification:
Identify queries with transaction isolation set different than read uncommitted and compare it to blocking sources events.
- Use tracking tools (such as SQL Server Profiler) in order to identify queries transaction isolation out of next options: read committed, Serializable, Repeatable Read. It might be complicated since you have to prioritize these events (by duration or resources) and make sure you have all details needed.
- Identify blocked queries by using tracking tools, and cross it with the execution time of the other events.
- Check the database logs to look for blocking events and details about the queries and transactions while blocking has happened.
- Take into account that there can be multiple layers of blocking or complex dependencies. Therefore you might aim for a wider insight: analyze the settings and the overall database workload.
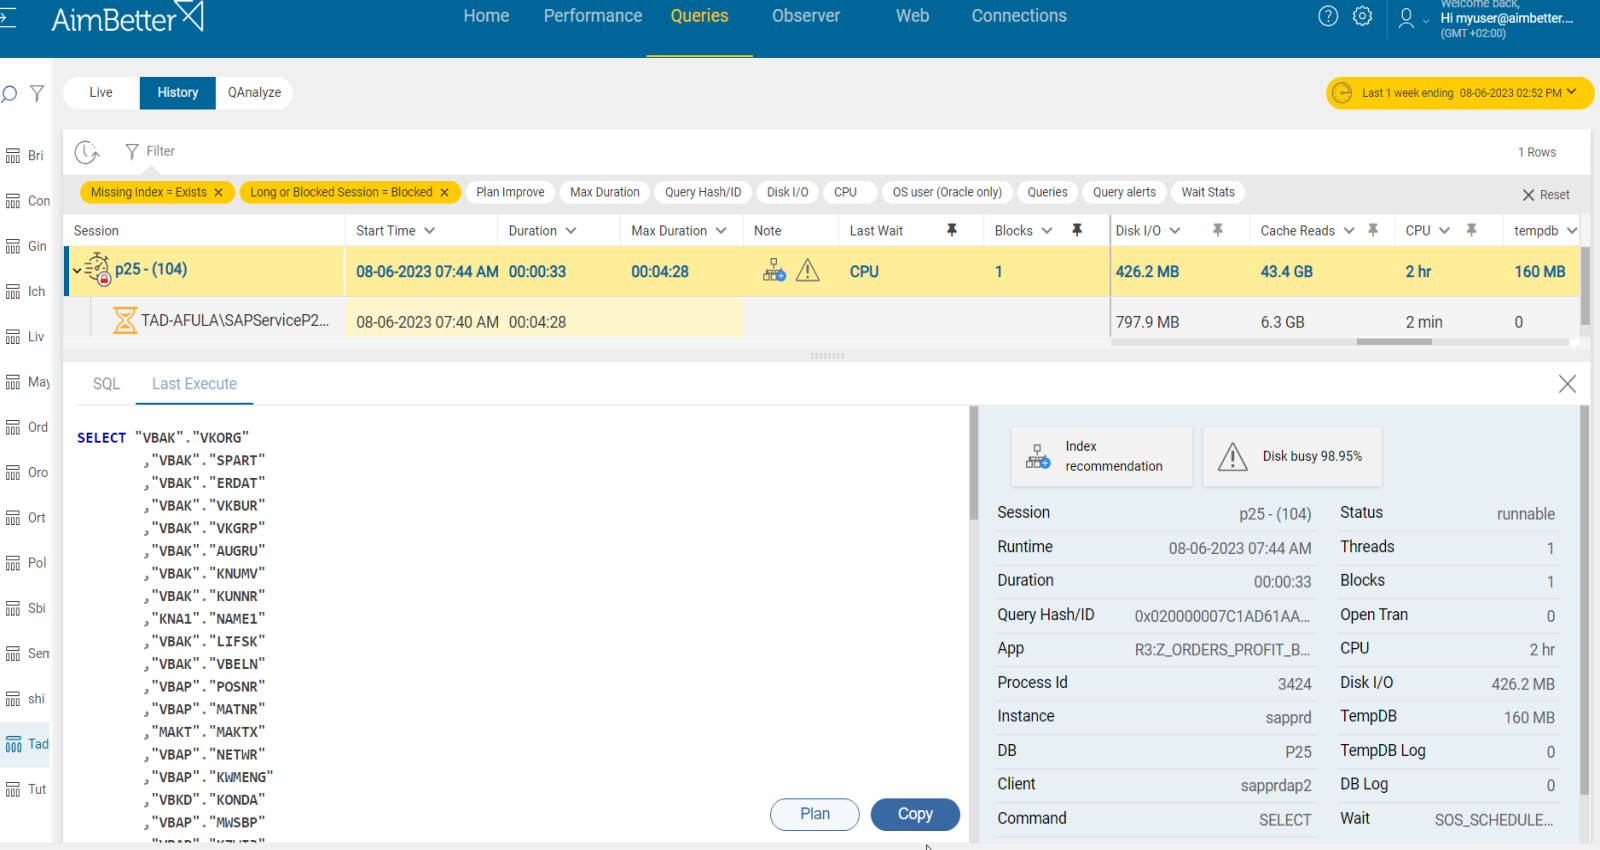
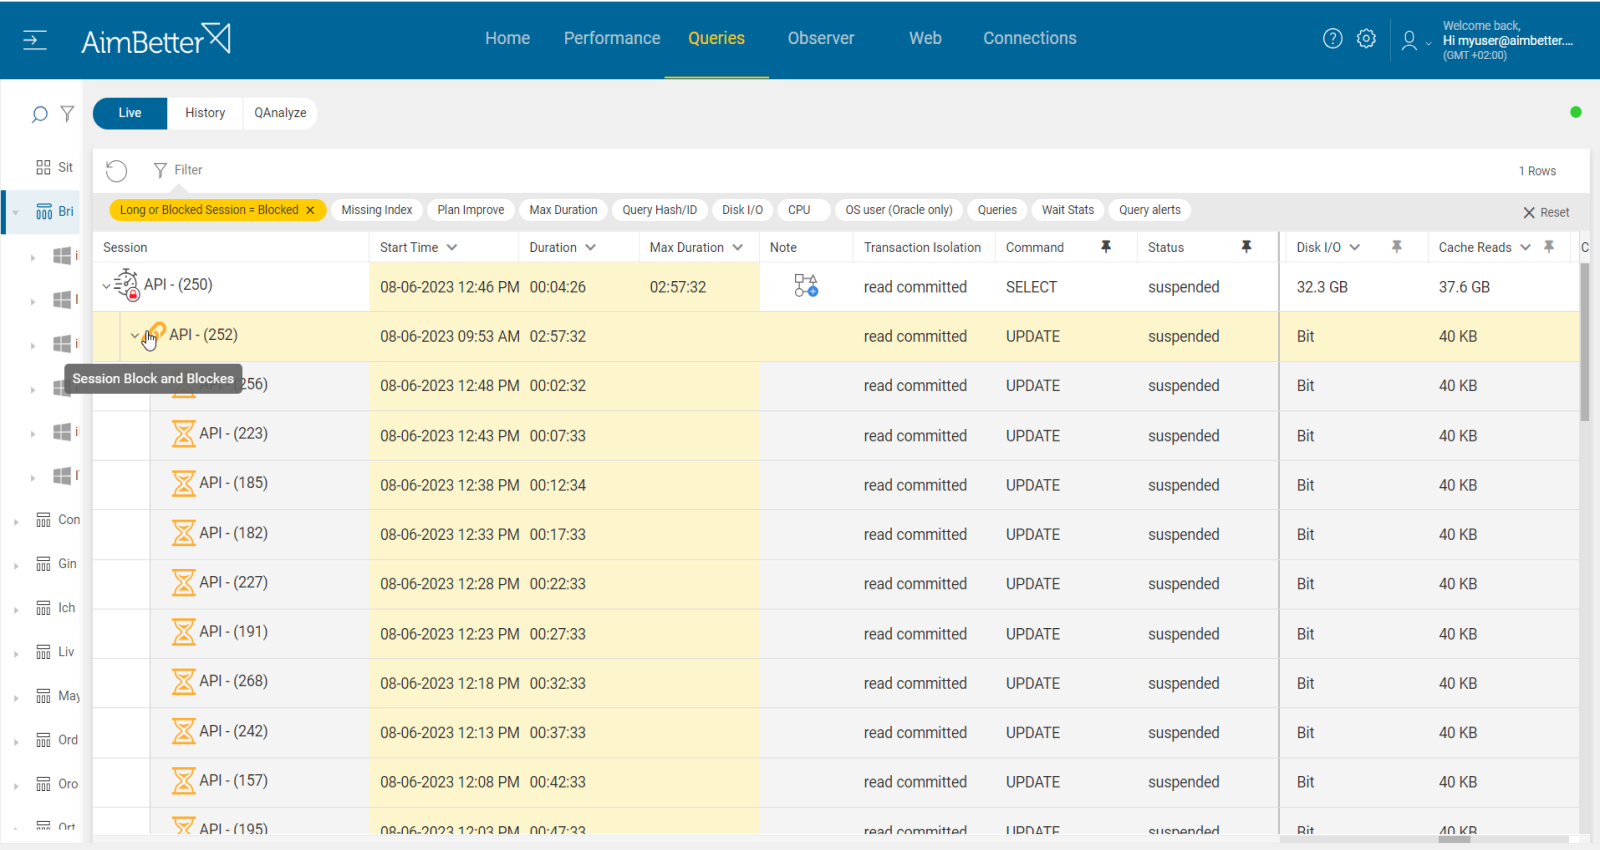
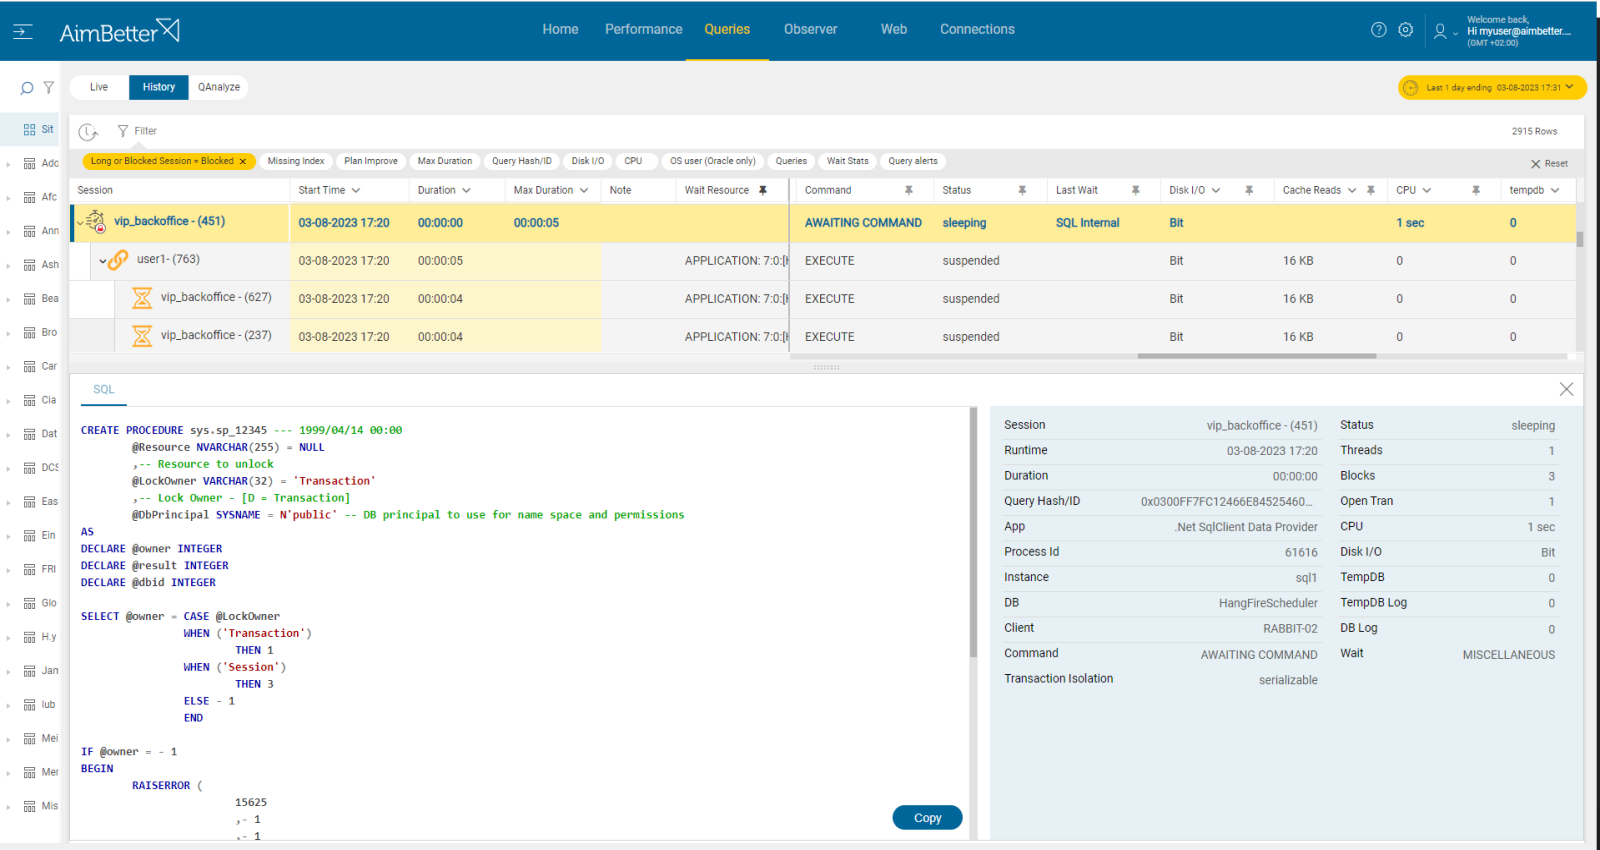
4- Query with a long execution time with running or sleeping statuses Priority: High
An active query might run for a long execution time since a database resource (for example, a table) is locked as long as the query’s execution process holds it.
A sleeping process causing blocking can often be identified by a SPID that is sleeping or waiting for a command yet whose transaction nesting level is greater than zero.
Problem identification:
Identify events of long-running queries or sleeping status queries and cross them with blocking query events.
- Track the database server activity: identify which SQL statements have high execution time and consume mostly the resources. For SQL Server, you can use the built-in activity monitors or SQL Profiler. This mission might be complicated and take hours or days of work, requiring a highly skilled DBA.
- In order to track sleeping processes with open transactions, use system views to have a list of active connections. Next, Look for connections with a status of “sleeping” or “idle” in the output of the active connections and check their transaction state. You should do that with a professional DBA.
- Identify which of the queries were blocking queries. You have to make sure that the database and table in the long-running queries are the same as the query which was blocking.
- Investigate the query code and execution plan, trying to look for missing indexes or excess subqueries. In order to get this data, you have to run the query live again from the management studio, which might increase the chance of blockings and the investigation time of this issue.
- Ensure that your application or code follows best practices for transaction handling. Make sure it’s as short as possible.
Recommended action :
The blocking queries should be optimized. This class of blocking problem may just be a broader performance problem- lack of statistics, indexing, and more. Check our article on long-running queries.
Applications must properly manage transaction nesting levels, or they may cause a blocking problem following the cancellation of the query in which a transaction was open.
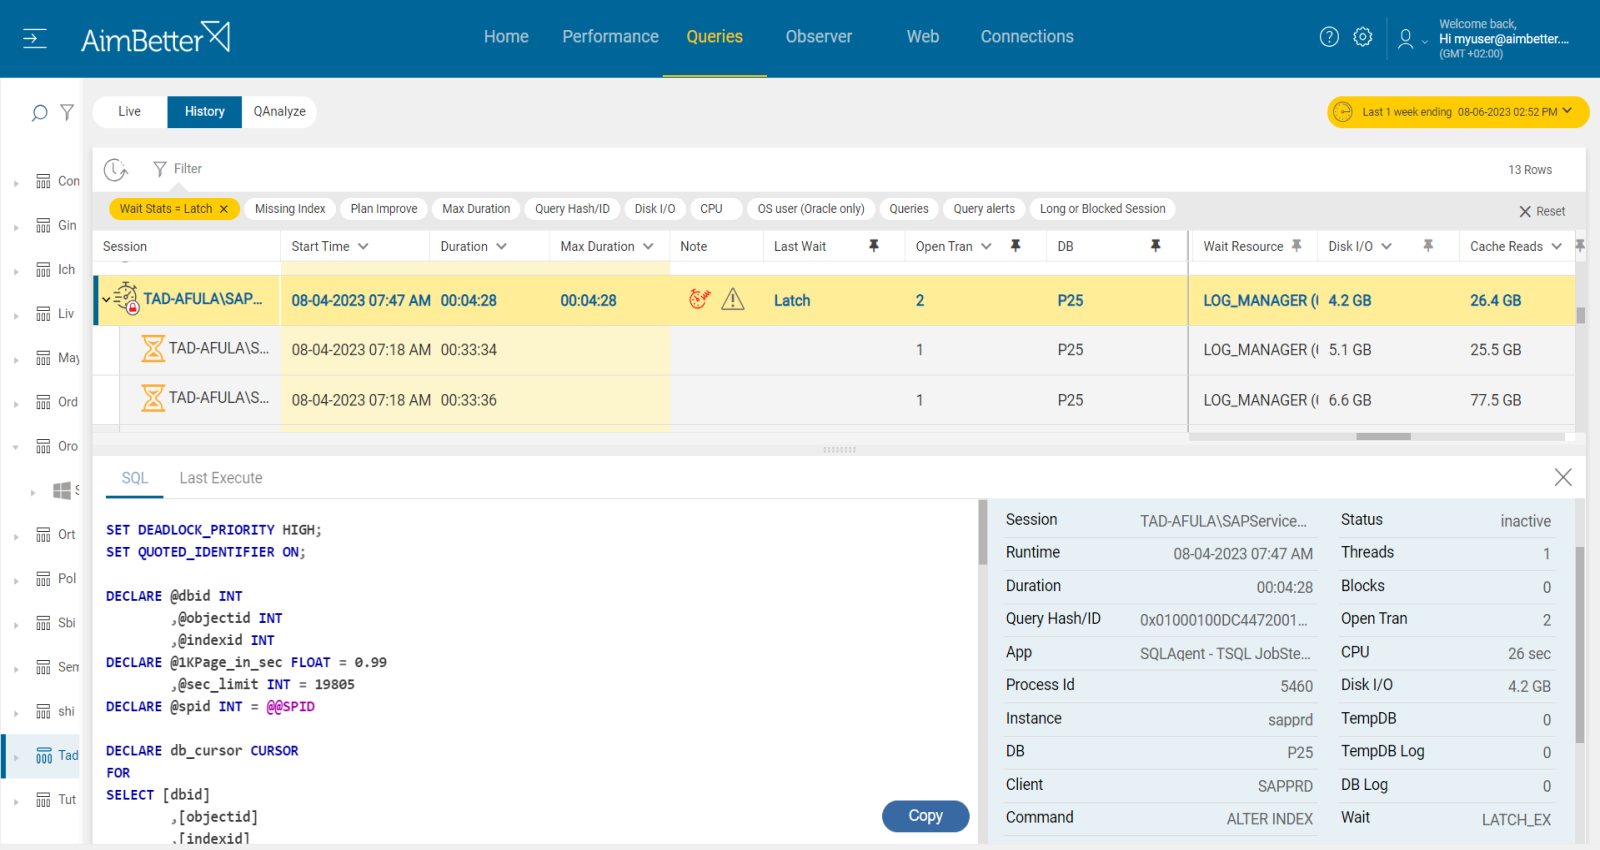
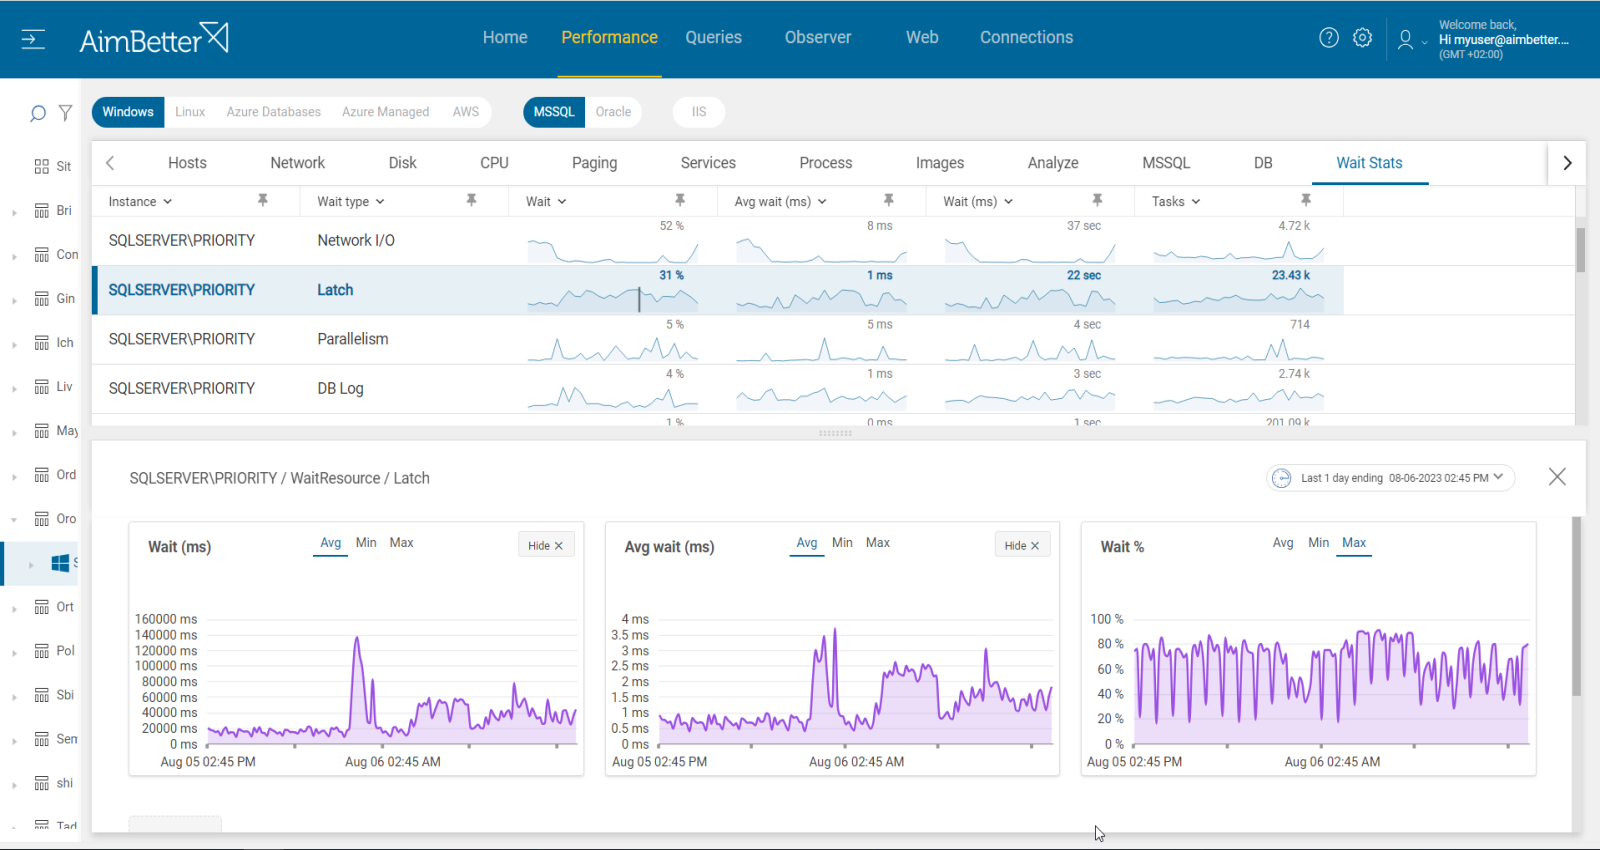
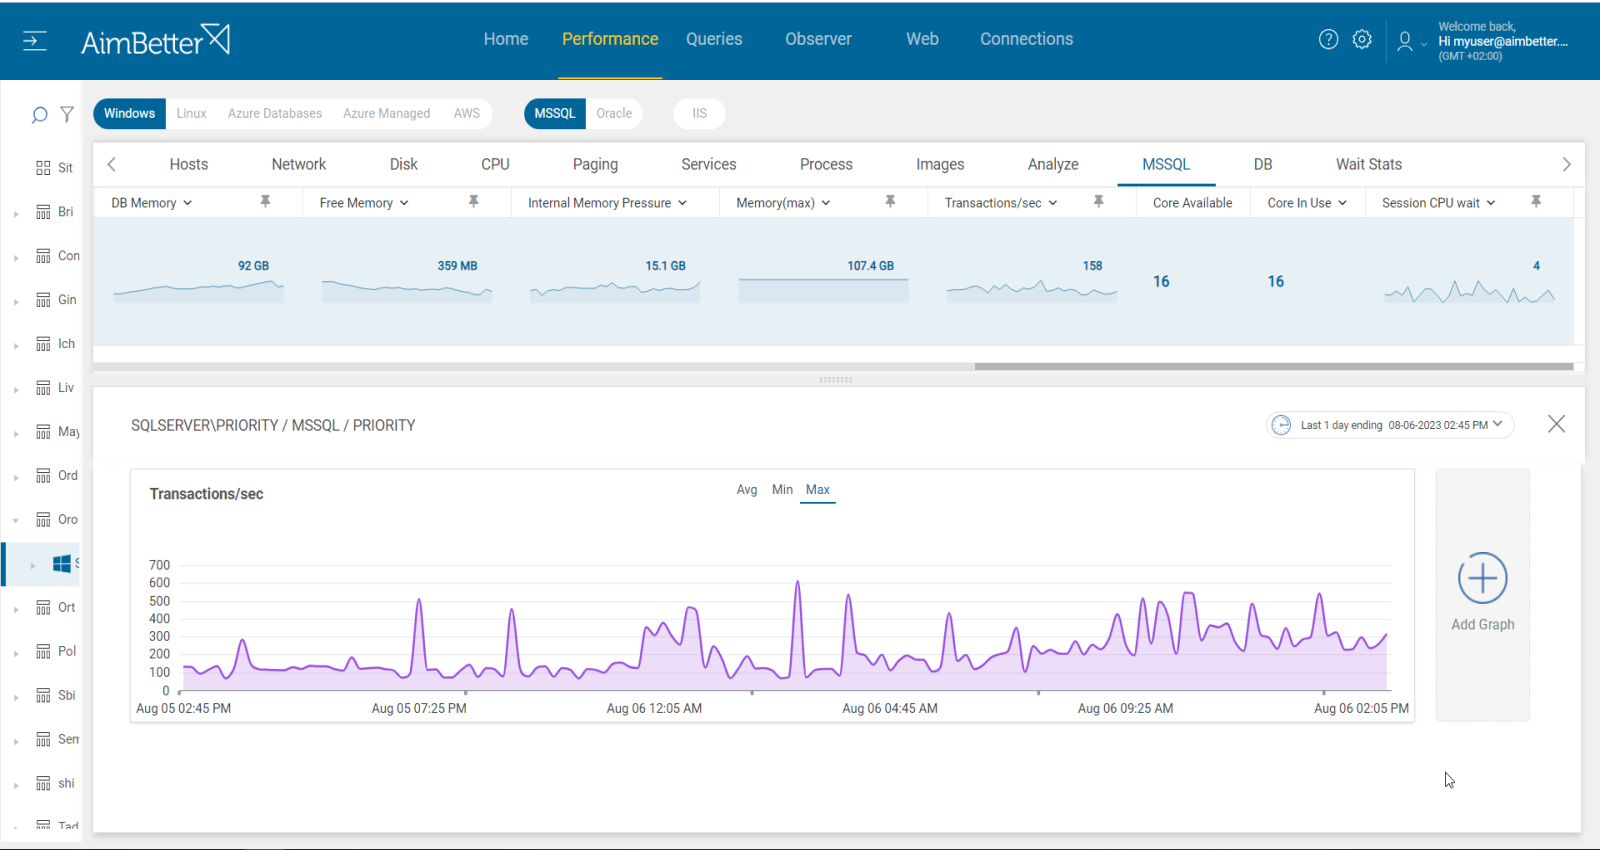
5- Latch contention increases while transaction per second decreases. Priority: Medium
Latches in SQL Server is a low-level synchronization mechanism used to protect shared data structures such as indexes, data pages, or internal memory structures.
When a system has a large number of CPU Cores and multiple threads or processes try to access the same latch in sequence, then latch contention might arise, thus leading to delays in performance and blocking occurrences.
The recommended behavior is when there is a correlation between the number of transactions and latches, both increasing gradually. It should also correlate with core adding. However, when transactions decrease while latches increase, it may indicate a latch contention, meaning waits for latches. It may also happen when I/O increases.
Problem identification:
Identify the increase in latch waiting types percentage and waiting duration and compare it to the number of transactions per second. Check if the system has enough CPU Cores (over 16). It’s normal for latches to increase as IO increases so this should be checked also.
- Go to Task Manager and check for the number of CPU Cores, whether it’s high or not. Open the resource monitor in order to follow the disk’s utilization. You also might use a performance monitor for that case.
- Use SQL Server Dynamic Management Views (DMVs) in order to identify latch contentions by running several scripts. You are also able to monitor wait stats related to latches or monitor transactions per second currently. In addition, you can use SQL Server profiler in order to activate a trace that will track this issue over time. Take into account that in both cases, you don’t have history data to compare with, and you should do this task with a DBA.
- Check the SQL Server error logs for messages related to latch contention.
- Identify queries that have non-optimal execution plans or missing indexes or statistics. In order to get this data, you have to run the query live again from the management studio, which might increase the chance of blocking and the investigation time of this issue.
- Follow up if there is a change in latches waiting time, which should decrease.
Recommended action :
When identifying that the blocking queries are caused due wait stats related to latch contention, you should consider improving queries performance.
Look for missing indexes and poor query execution plans and check the database design and settings.
Once there is an improvement in performance, you should see that latches’ wait stats decrease over time.
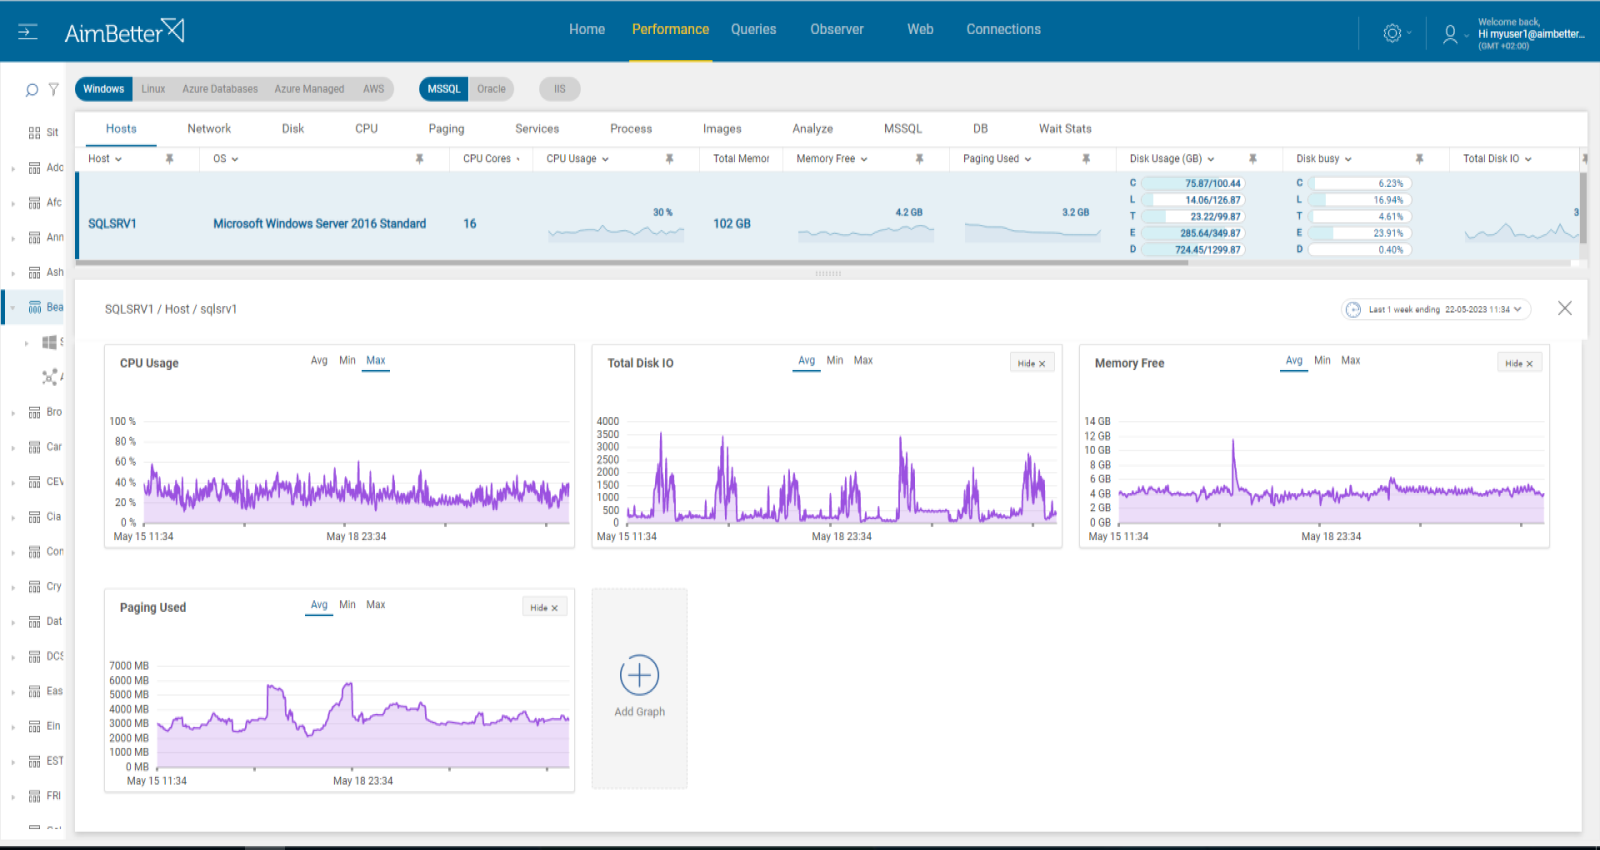
6- Overloaded or wrongly set hardware resources. Priority: High
Overloaded server resources such as CPU, memory, disk I/O, or network can slow down query execution. It might happen due to a specific application or many processes running at the same time. These processes might be external operations such as anti-virus scans, backups, and restores from networked data stores.
In other cases, the resource settings may not fit the requirements of the instance operation—for example, not enough cores or improper settings of disks.
If the OS resources are low, particularly memory and CPU, the database might struggle to allocate the necessary resources to complete the queries. In cases of locks, this might take longer to complete, leading to blocking queries.
Problem identification:
Check if CPU, memory, disk I/O, or network resources are highly utilized. Identify the source of the load and if it is recurrent. Try to reschedule heavy tasks to a time of low user demand.
- Check the Task Manager in order to identify the overload of hardware resources.
- Use OS tracking tools such as Performance Monitor in order to identify which processes use hardware resources. For network activity, use a network monitoring tool, and check how much traffic flows through your network and which applications or devices use the most bandwidth. Take into account that most tools help pinpoint when a problem starts, with which you can’t compare to old time frames.
- Check whether the long-running queries wait time is for a specific hardware resource and which hardware resource is more utilized than others while the query is running. For that, you should be using tracing tools such as SQL Server profiler. This step might be complicated and take time, and the result probably won’t be precise while checking only online statuses.
Recommended action :
Cancel unnecessary programs that cause high hardware utilization. Where possible, reschedule non-essential activity (e.g., virus scans, backup, etc.) to hours of lowest SQL demand.
Consider upgrading hardware if possible.
It’s important to make sure that the database system has sufficient resources available, including memory, CPU, and disk space.
Monitoring would be useful to follow up on this issue and prevent situations when there is low availability of OS resources.


