High response times generally occur when sessions are blocked or when either there is heavy network traffic or network problems or if the computer the SQL Diagnostic Manager Repository or the SQL Diagnostic Manager Console is hosted on is running slow due to various problems.
Find out how you can save hours of work when investigating the root cause of this issue.
Symptoms
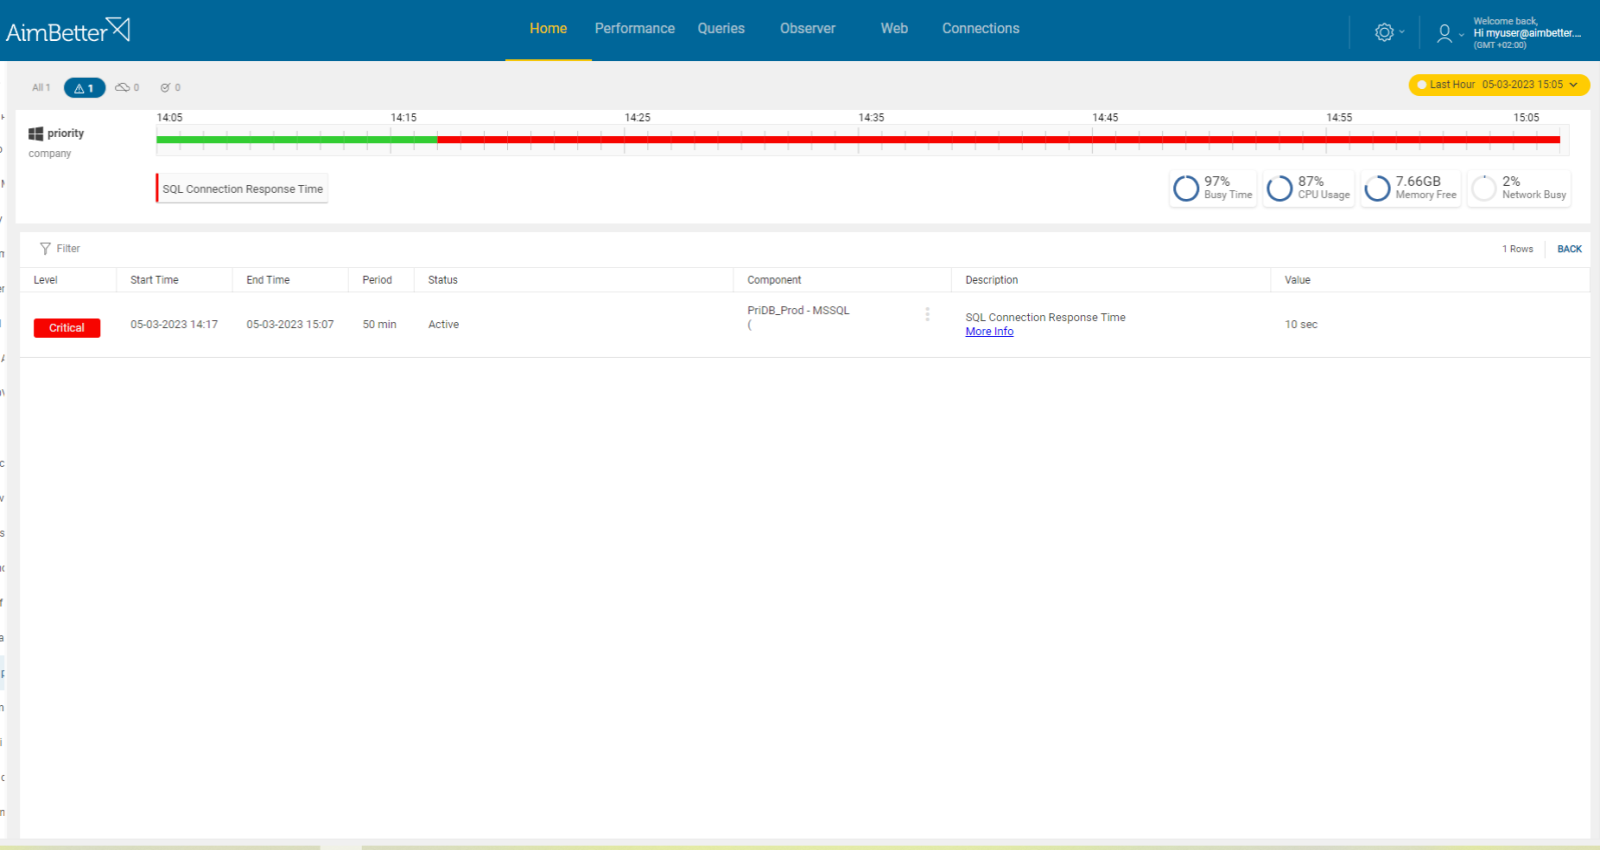
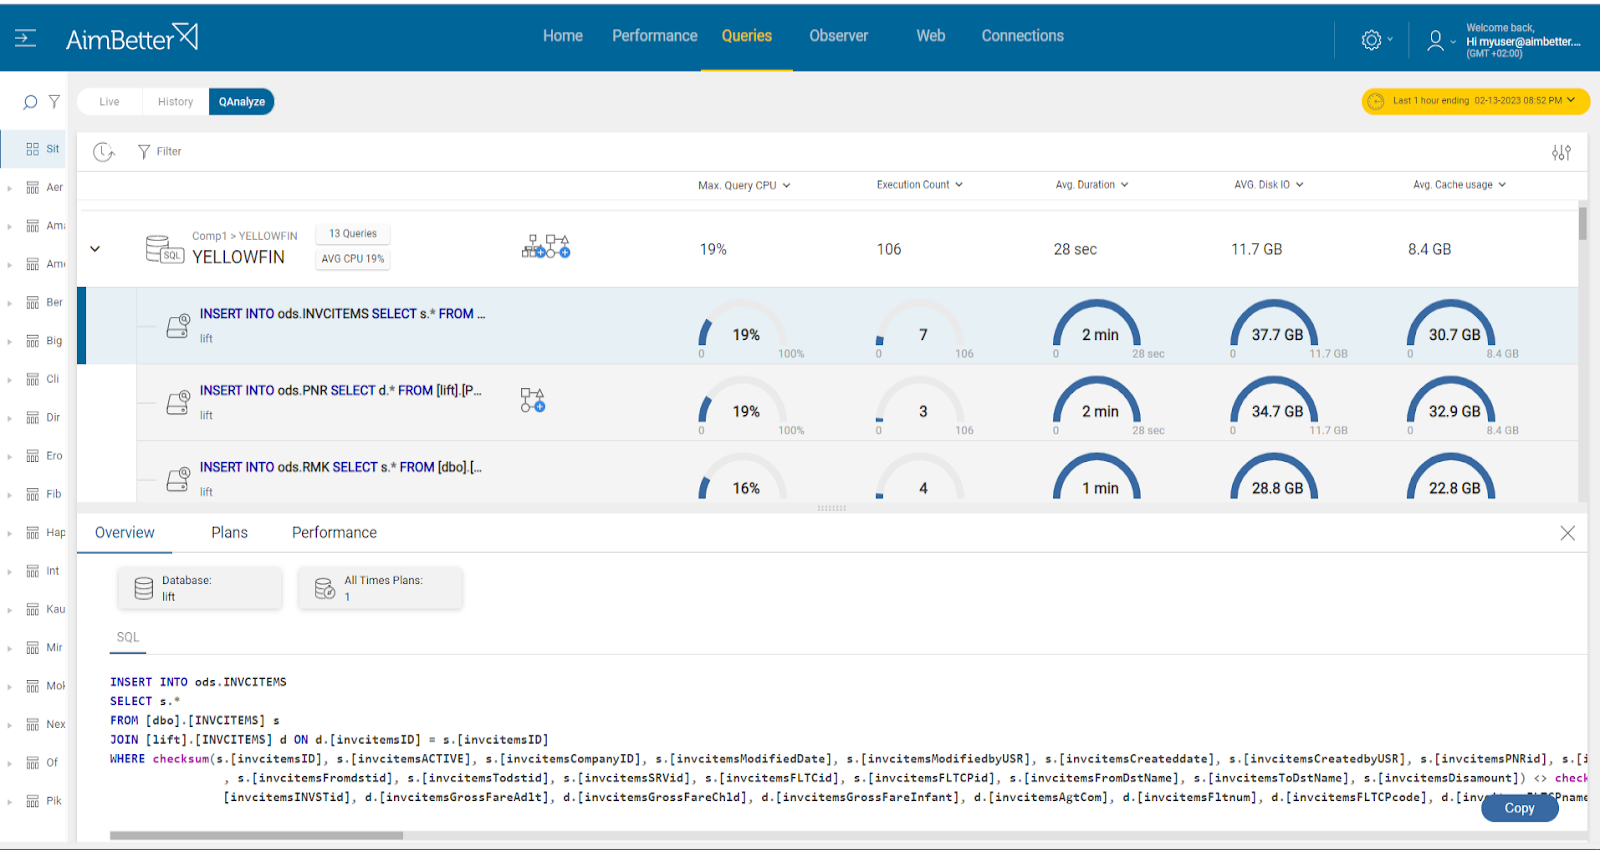
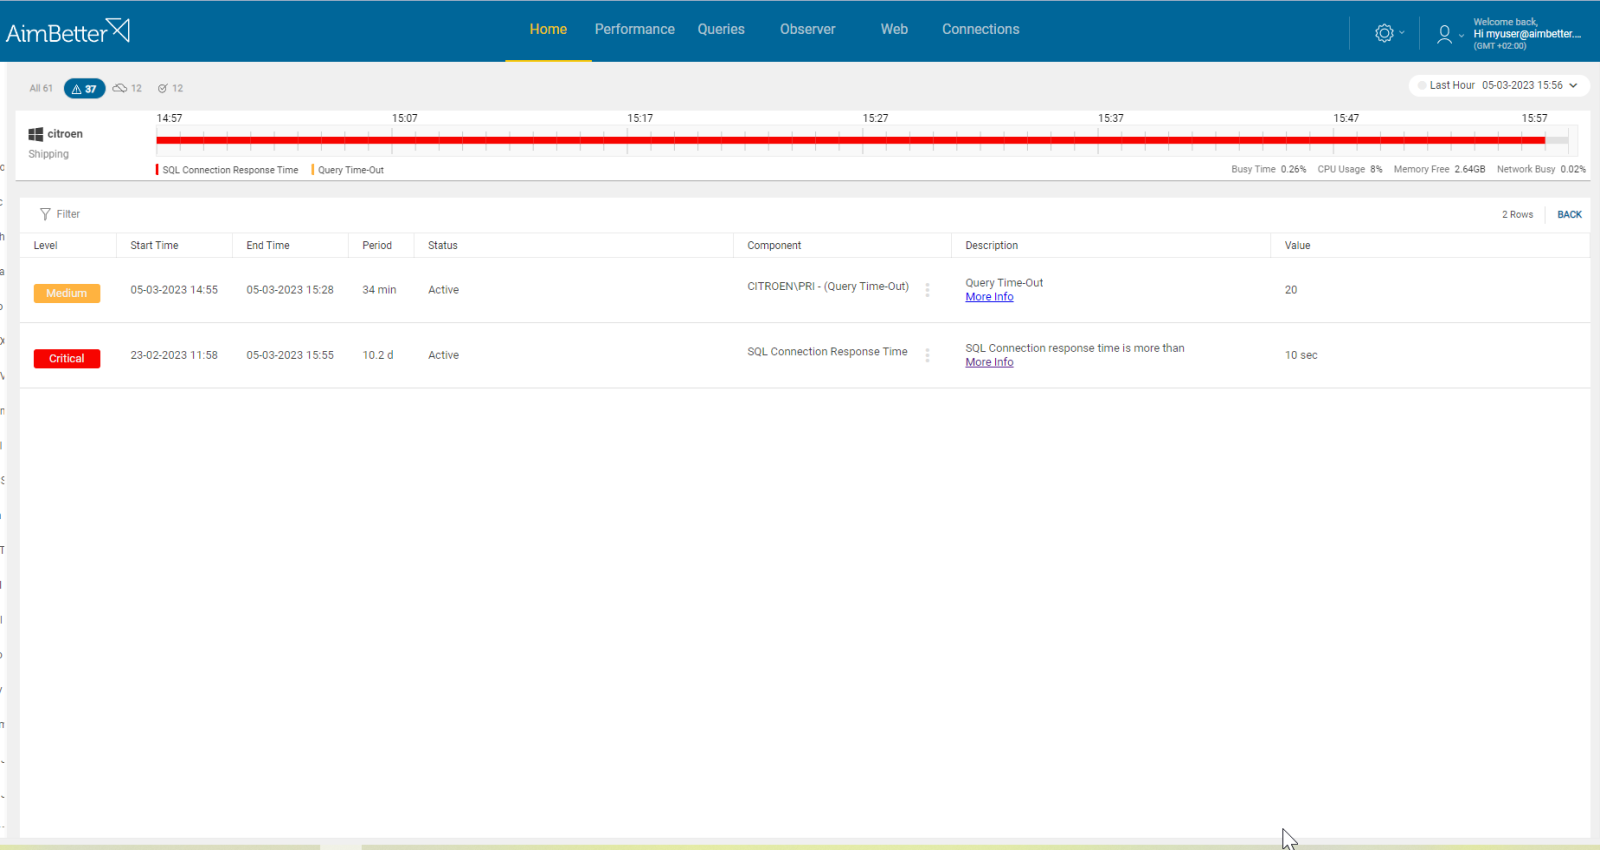
The database instance engine is responding too slowly to connection requests, reporting a long response time.
Impact: High
Slow SQL responses will degrade the user experience, resulting in poor efficiency of your organization’s operations.
Expected behavior :
Typically, this value should average below 2000 ms for a well-tuned network and server. Average values in excess of 2000 ms indicate either an excessively busy network segment or a stressed SQL Server.
This alert measures up to 30 seconds of slow response. When it reaches 30 seconds, it’s considered a time-out. 60 seconds of response time means unavailable SQL or Oracle instance by service level.
Possible causes:
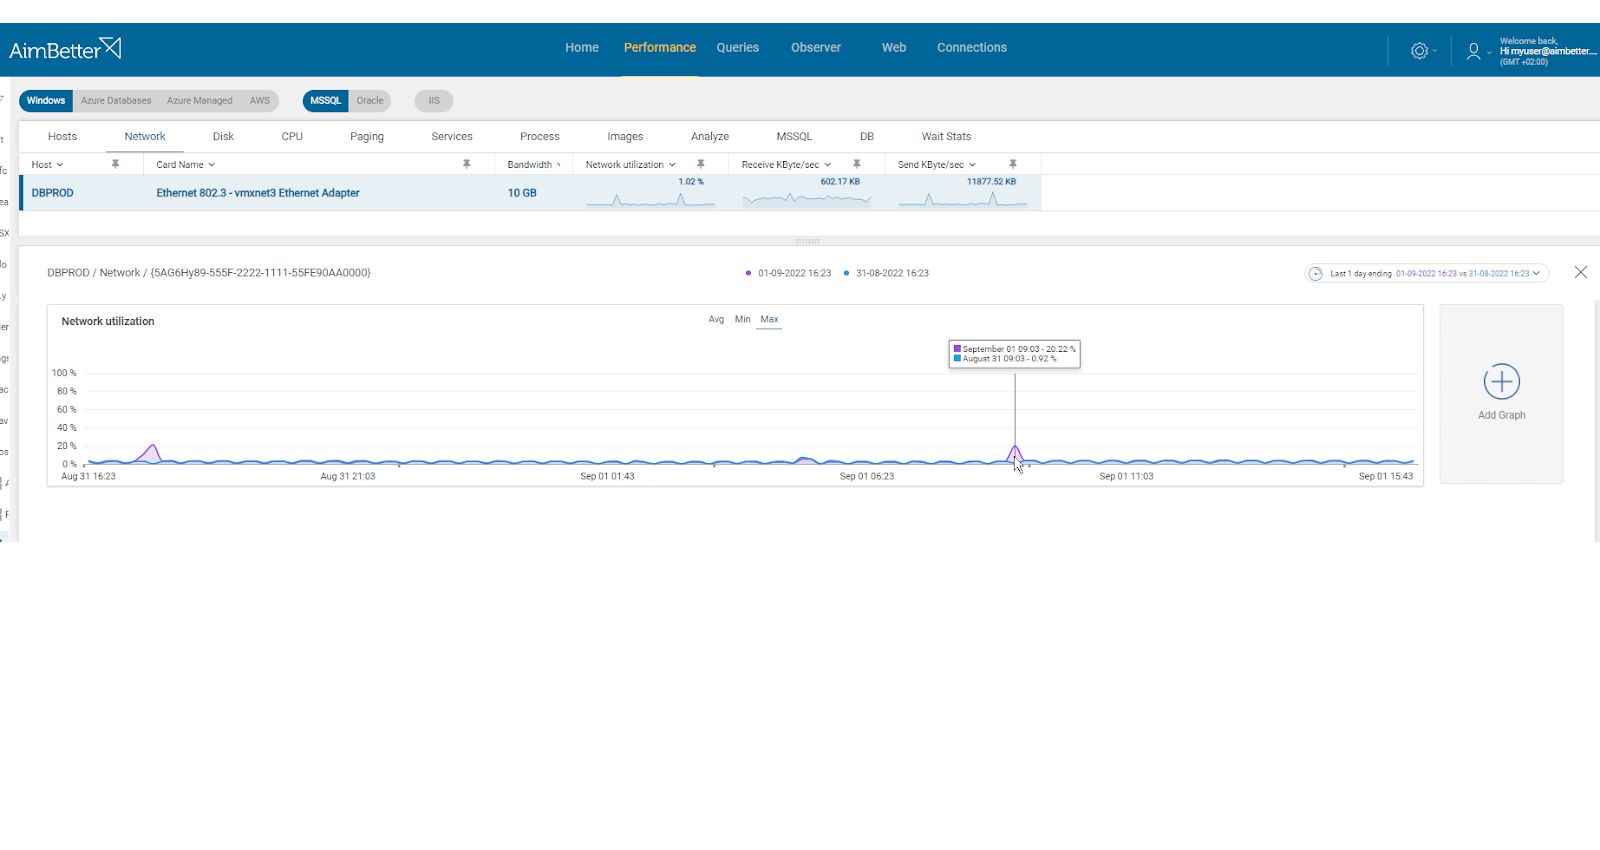
1- Slow network Priority: High
Failure of some hardware component handling data traffic is the most likely reason for this error.
Problem identification:
Identify the current status of the network performance, if it’s poor or not.
Hands-on approach
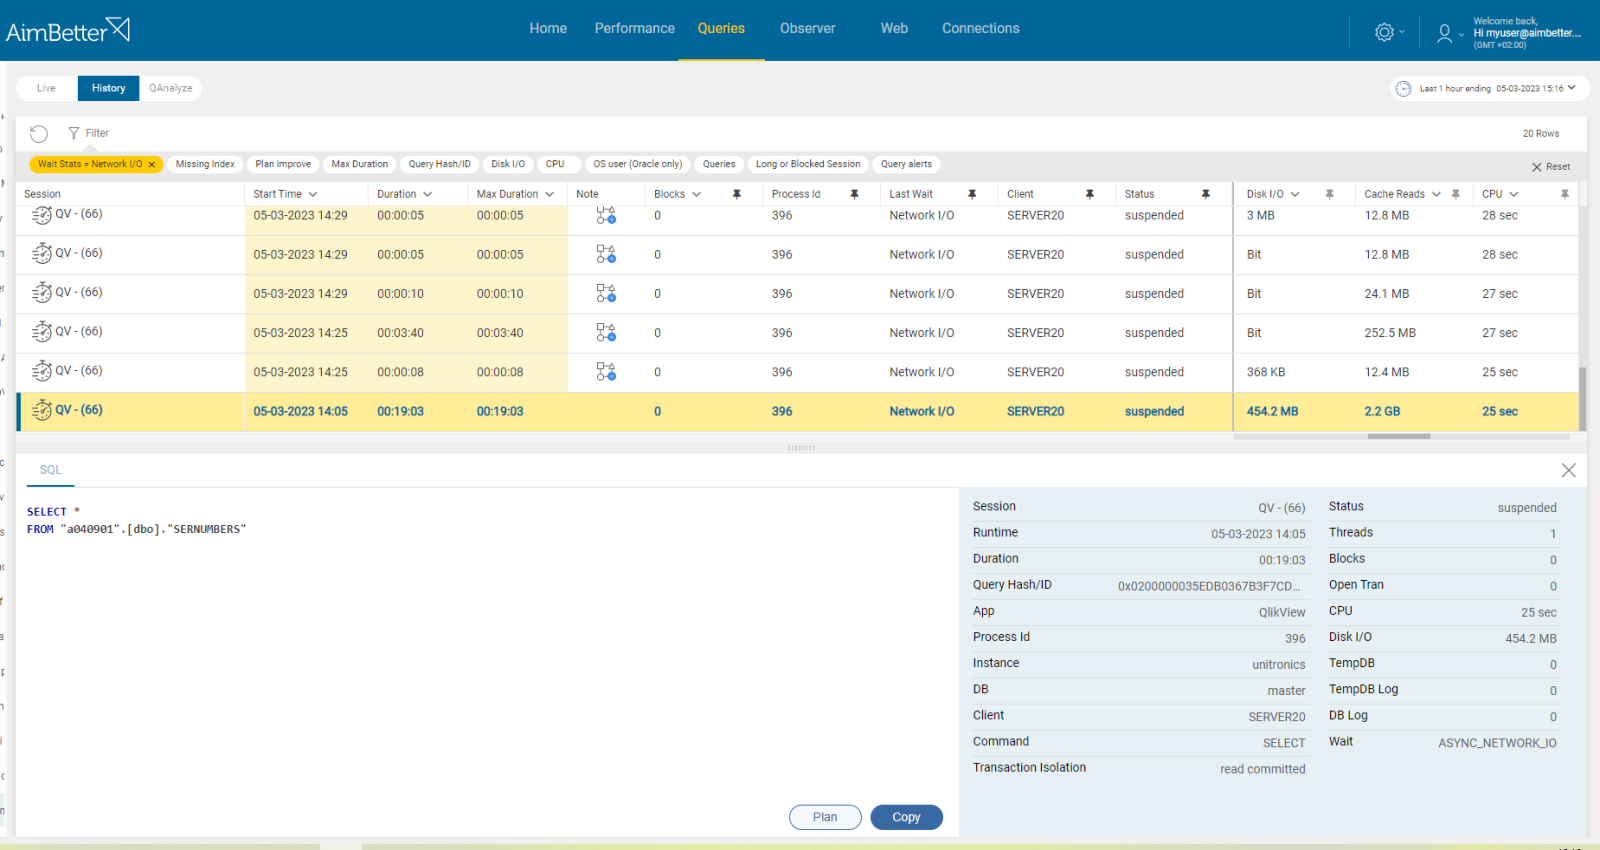
- You should use a monitoring tool in order to identify the source of poor performance, and if it occurs in parallel to slow SQL connection responses. You should also check for how much network traffic currently is used and by which applications. Take into account that most tools do not help pinpoint when a problem starts, and probably you could not compare different time frames.
- To check for errors, you can use event viewer or any other system tool relevant.
- Analyze network abnormalities, and check for network hardware and settings. Ensure that your network devices are configured for optimal performance and correct function. This task should be done by a qualified network management team.
Recommended action :
If the network traffic is slower than usual because of external operations, the network service provider must check what can be done. Scheduling high-volume activities to time frames with lower user demand can be helpful. If needed and possible, the network management team should consider whether to upgrade the network.
2- Non-optimal configuration settings Priority: High
Incorrect SQL Server or Oracle settings can cause slow SQL responses to new connections.
Problem identification:
Check current configuration settings and error logs in order to identify whether the settings should be changed or not.
- Run a script or check manually the current configuration settings.
- Change one setting at a time and check if the performance increases. This task might be complicated and should be done carefully by a DBA. Make sure to document the previous status of each metric, in order to be able to restore it in case of poor performance or even a downtime caused by the change.
- If current changes did not help and yet the connection response time is high, continue investigating this issue and look for other causes.
Recommended action :
Change current configuration settings with the help of DBA experts, if needed, our experts are able to help you. If needed, consider adding cores, and RAM memory, or upgrading the version of the Oracle or SQL Server instances.
3- Application Design Priority: Low
Poorly designed applications can cause slow response times to new connections. It is possible that the current timeout settings do not fit the needed settings for the database server.
Problem identification:
Check the application files and look for error logs or events.
- Enter the application files and check them, for that you have to know the correct application file path, and locate the correct logs at the correct time.
- Consider changing the application settings.
- Use profiling tools such as SQL server profiler for SQL Server or Oracle Trace for Oracle in order to identify delays on the side of the application or the database. You should have the help of a professional DBA.
Recommended action :
You should consult with application experts for this issue. Several solutions may be: upgrading the hardware of the server, upgrading the application version, or changing settings.
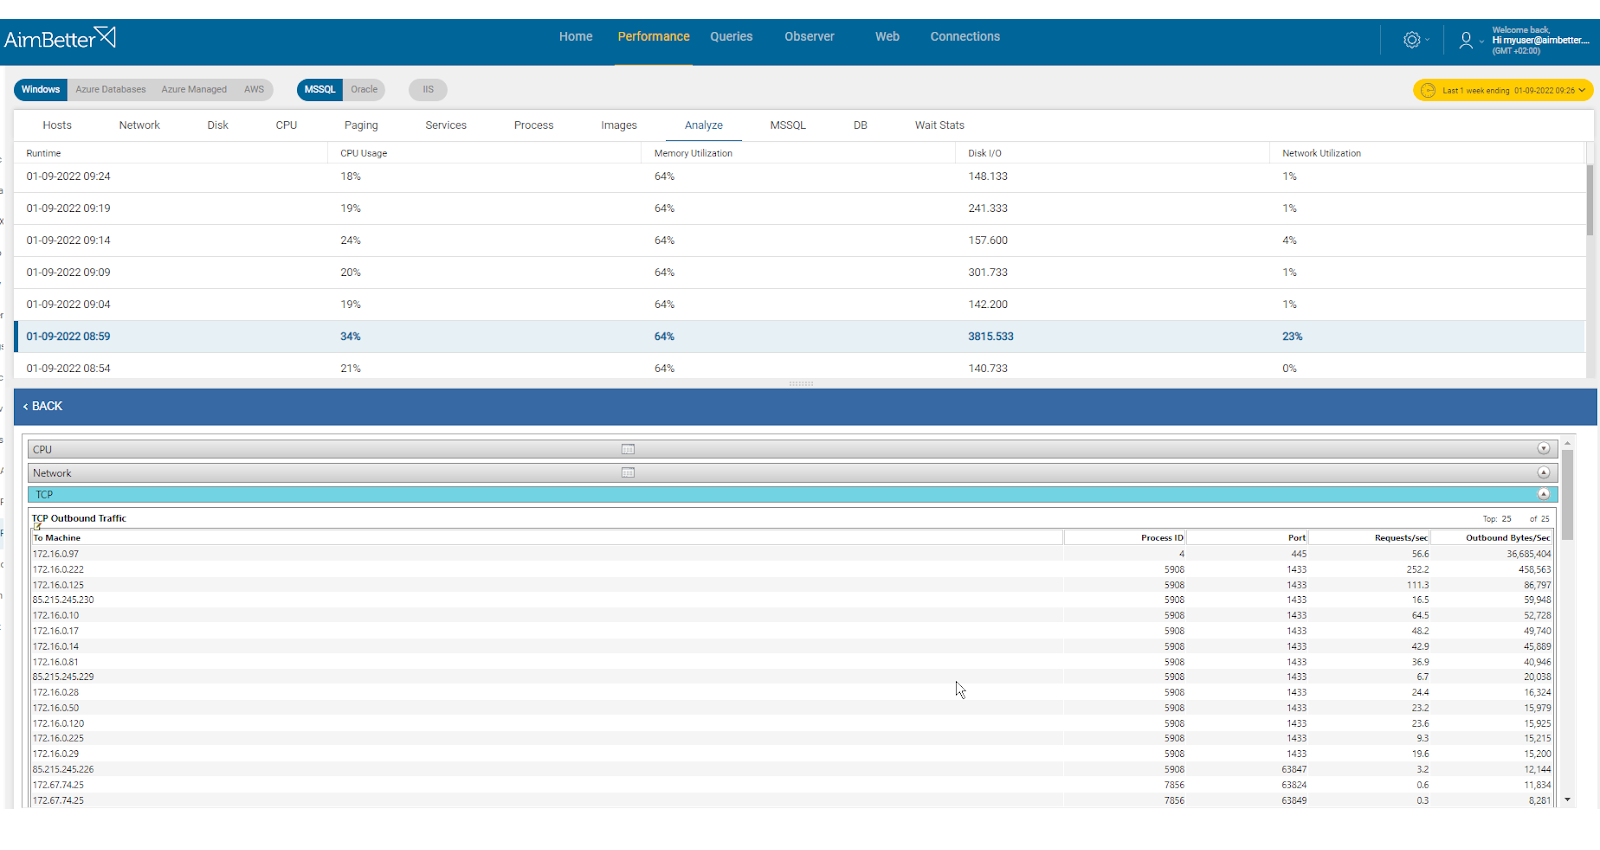
4- Operating system conflict Priority: Medium
Besides SQL database functions, the server performs functions relating to other operating system activities, such as anti-virus scans, disk clean-up, OS updates, etc. If an unusually high level of these coincides with high database activities, there may be an excessive load on the CPU from competing elements.
Problem identification:
Check the operating system activities and look for abnormal behavior.
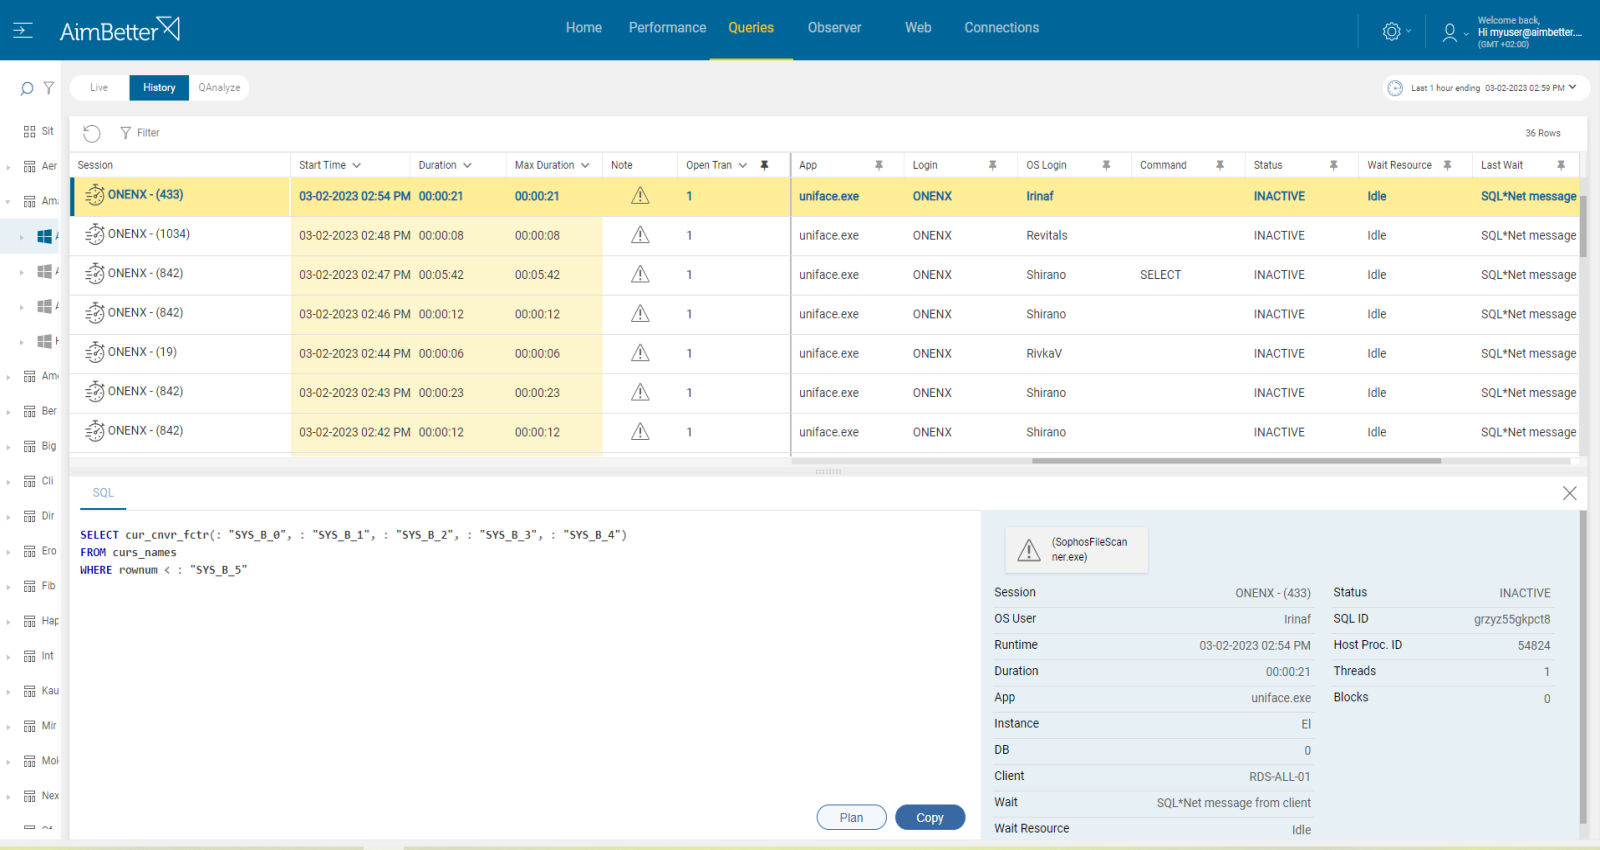
- Look for the anti-virus scan schedule. Antivirus software can sometimes conflict with database activities and cause slow response times. In order to identify which database activities are colliding with anti-virus scans, you will probably have to use tracking tools such as SQL Server Profiler for SQL Server or Oracle Trace for Oracle. This task requires DBA and might take significant time. It will also be inaccurate enough since checking from the current moment without comparing it to former events.
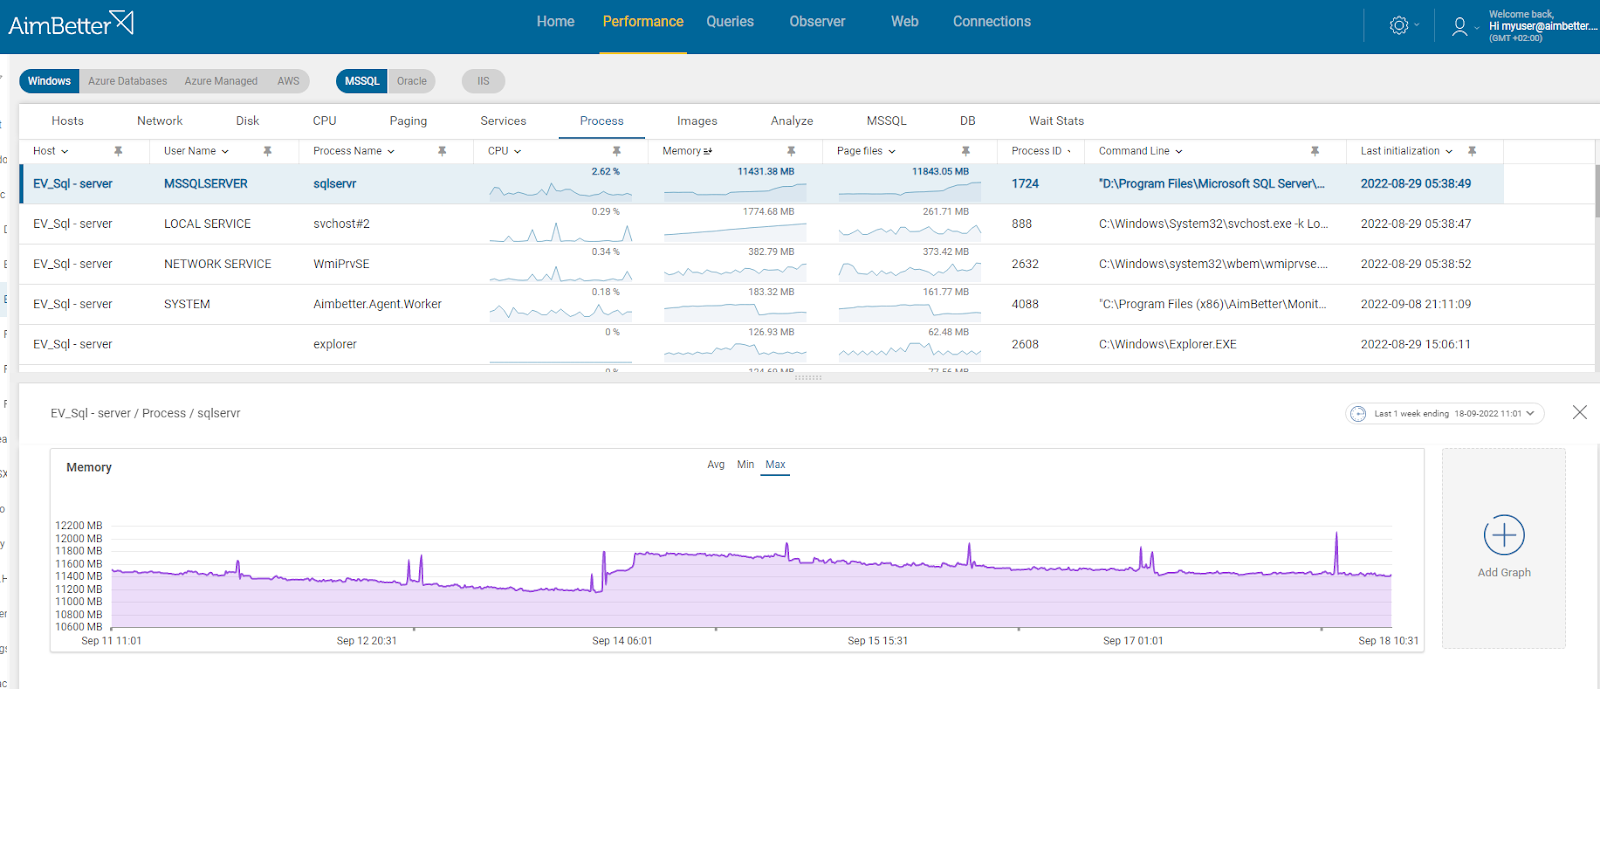
- Look for the current operating system’s activity. Higher system activity might be colliding with database activity and cause delays in response time. You should consider checking all operating system metrics, such as CPU, RAM memory, Disk I/O, and more. For that, use the task manager, performance monitor, or other system tools.
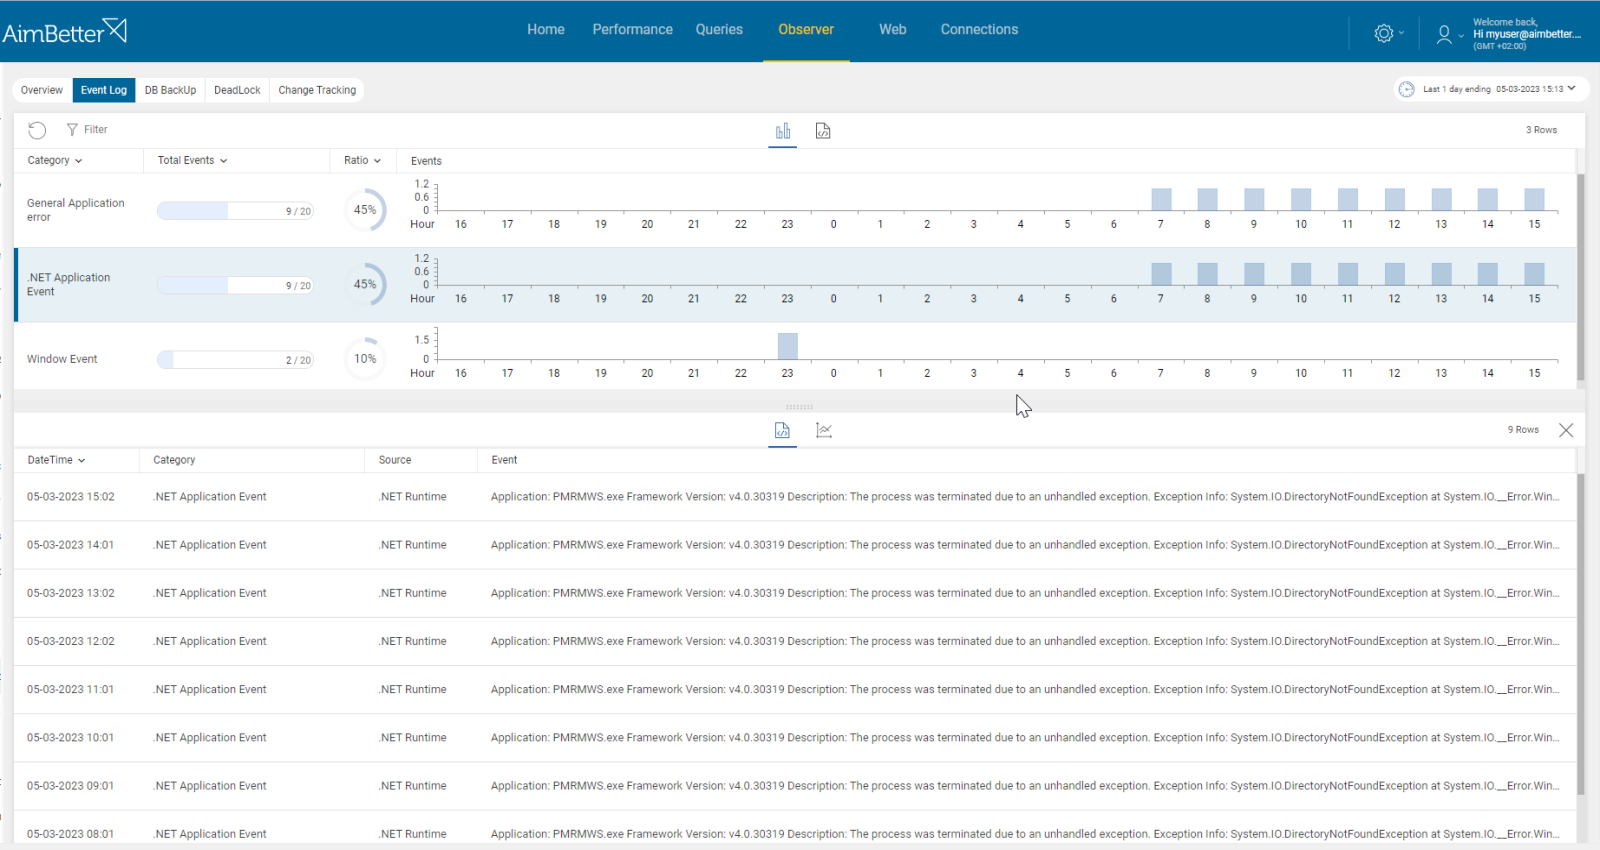
- In Windows OS, check Event Viewer for events that happened in parallel with slow response time. For example, look for notifications about system updates that occurred at the same time as when the response time was higher. For Linux, you can use ‘journalctl’ to view system logs or check ‘/var/log’ which is Linux’s temporary logs’ storage. This task might take time.
Recommended action :
Running an anti-virus scan during working hours should be avoided. However, if necessary, exclude database files from the scan. Address the errors found to the relevant team (DBA, System, or other) and upgrade current hardware, if possible.
5- Running out of disk space Priority: High
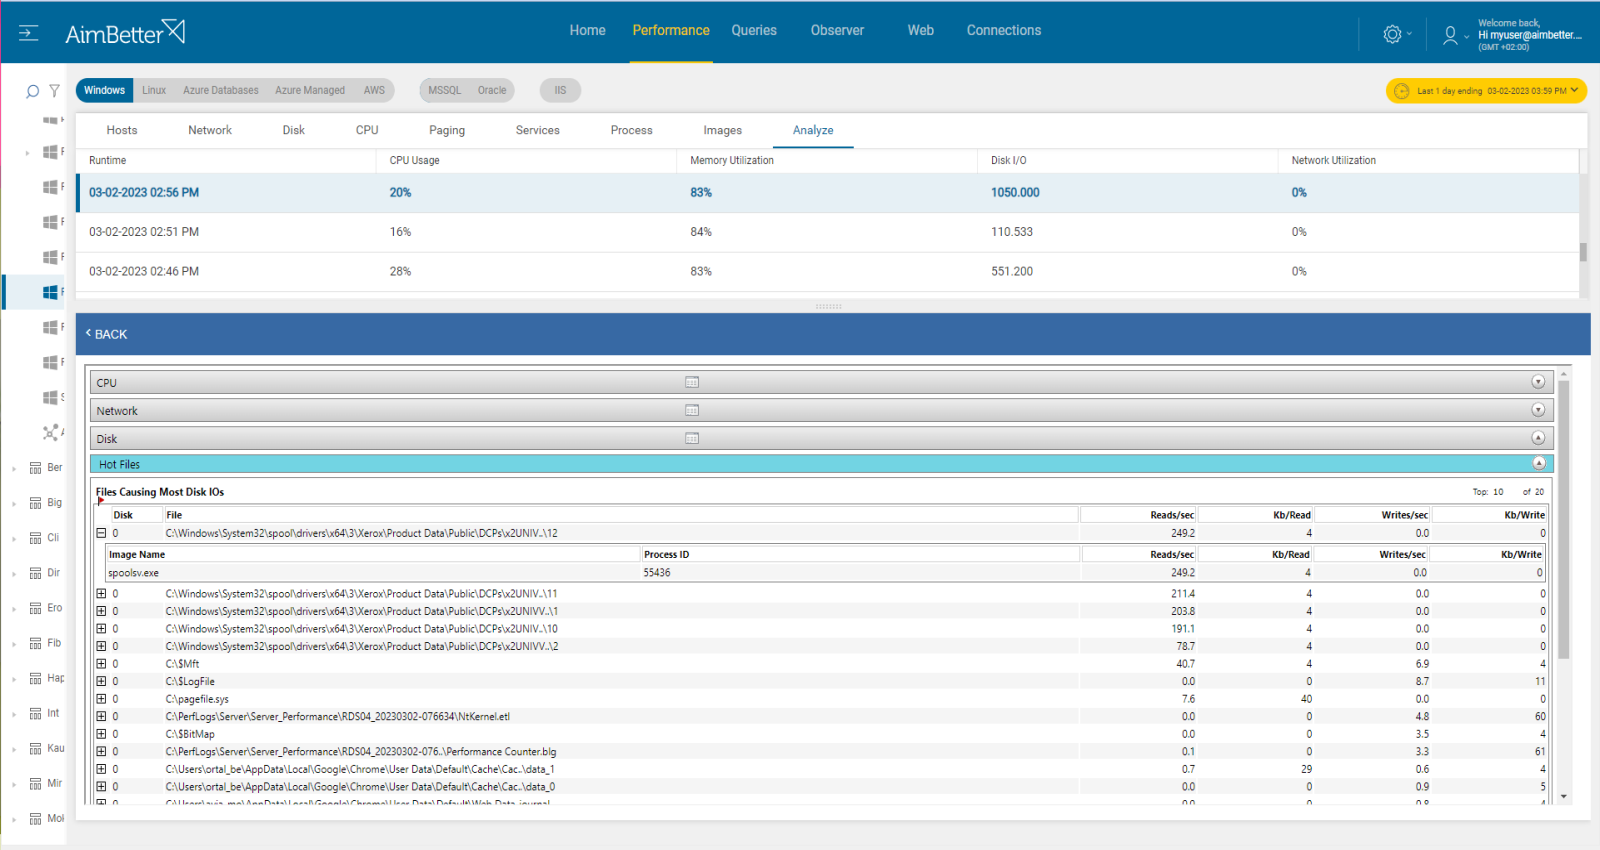
If the program calls for output to the disk ( I/O ) and the disk is nearly full (generally the optimal threshold is below 90% of total capacity), the disk will start to slow down as it searches for free space. This will cause the program to wait for progressively longer periods.
Read about possible causes in this article.
Recommended action:
By working with operating system reports, identify whether there is sufficient space in unnecessary files (for example, old or redundant copies of data), to delete these files and run a disk clean-up. If there is still not enough, further disk capacity must be added.
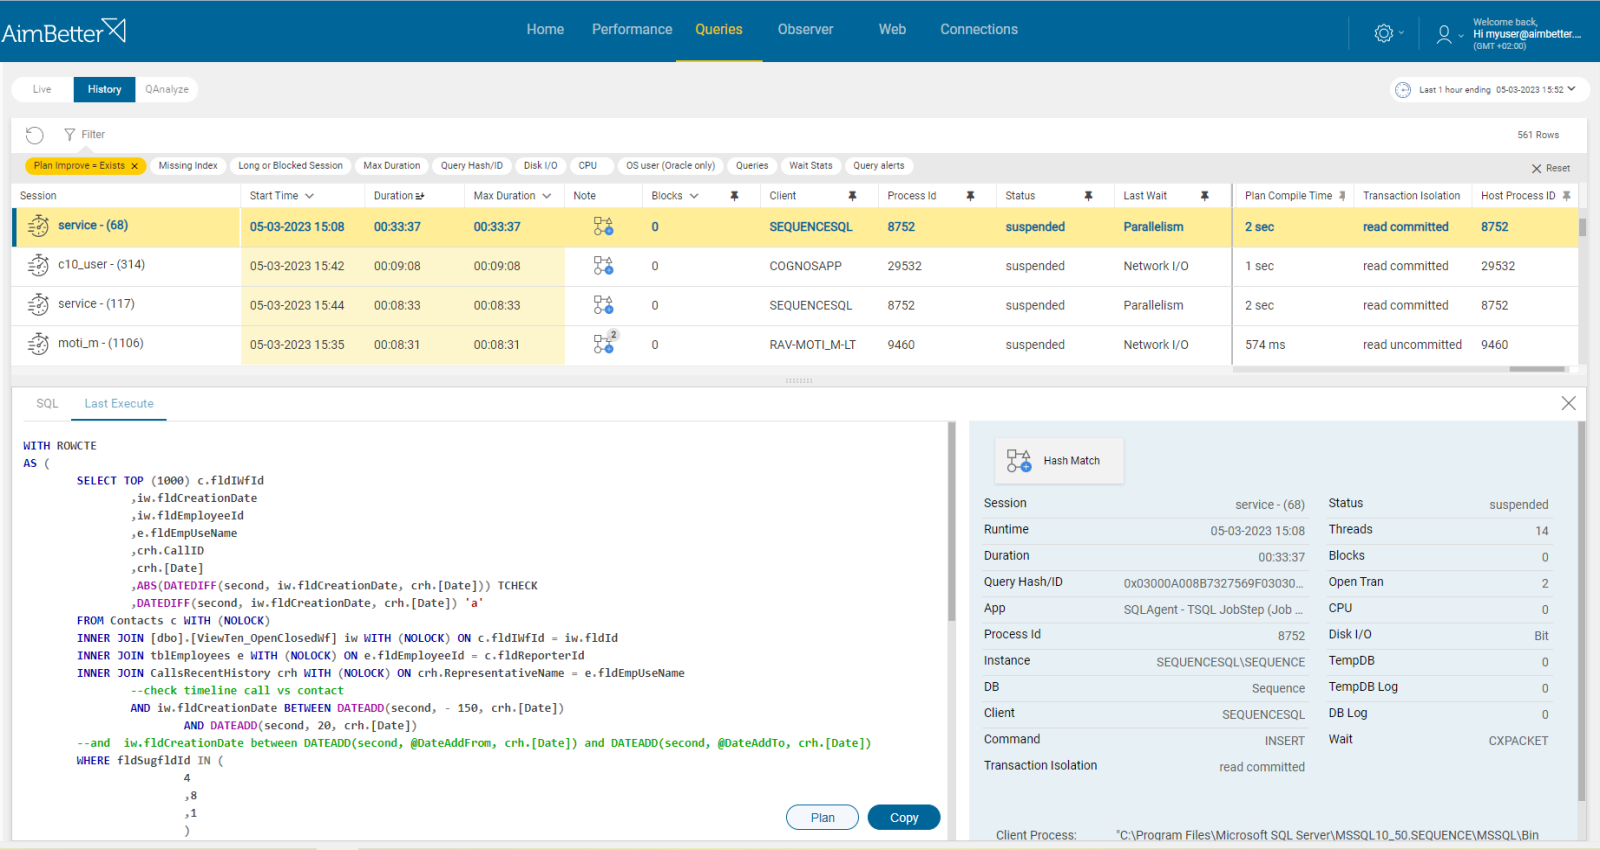
6- Deadlocks and Blocks Priority: Medium
Deadlocks occur when two or more transactions are waiting for each other to release a resource, resulting in a deadlock situation.
See our explanation regarding deadlocks here.
7- Missing or corrupt indexes Priority: High
Missing indexes means SQL Server is suggesting that your query could run faster with an index. In cases of corruption, 99% of the time, corruptions are disk or disk driver/firmware related. Therefore, missing indexes will cause extensive data searching.
Problem identification:
Investigate missing or corrupt indexes issues that could improve the buffer cache hit ratio in SQL Server following these steps:
Hands-on approach
- Identify the missing or corrupt indexes by running a performance analysis. You can use SQL Server Profiler or other performance analysis tools. This step is complicated, might take hours of work, and you can’t guarantee precise results when checking the online status with no historical events.
- Think about which appropriate indexes would optimize the queries. You can use the Database Engine Tuning Advisor or other tools to help identify the missing indexes. This mission might be complicated, requiring a highly skilled DBA that can view a complete SQL query plan that might be long and complicated.
- Check the existing indexes for corruption. If any index corruption is detected, rebuild or repair the indexes.
- Monitor the response times using performance counters. You lay on current moments.
- If the response time is still high, you may need to investigate the issue further.
Recommended action :
Using our “missing index” and “plan improvement” recommendations, you can refer to your system design team or our expert DBA Team. In case of corrupted indexes, direct your storage management team or our support experts for help. One possible remedy in cases where the corruption is repeating is to clone the database onto a new hardware configuration.
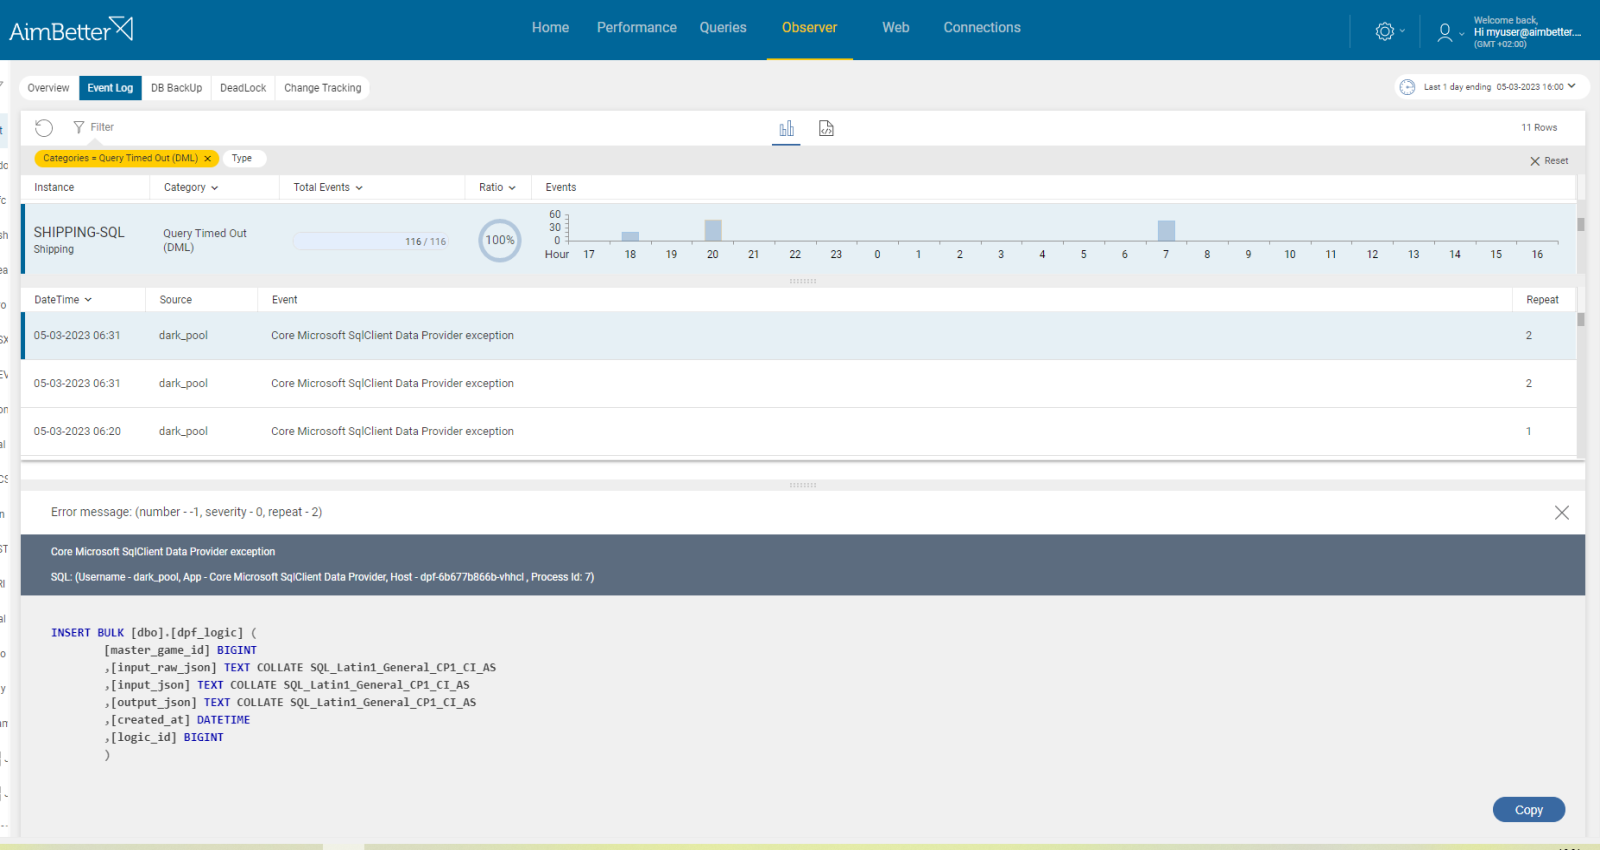
8- Time outs Priority: Low
This is relevant only if the response time metric reaches 60 seconds, or when error messages are related to an unavailable instance in the network.
Problem identification:
Check for existing time-outs errors.
Hands-on approach
This task might be complicated to identify, but here are several steps that might be taken:
- Use profiling tools in order to monitor in real-time exceptions of time-out errors, or check the error log of the database. This task might take hours of work and should be done with the help of a professional DBA. You can’t guarantee precise results since there is a chance you don’t have a history of events.
- Check for user reports about problems indicating timeouts.
- Identify whether the time-out events happened in parallel to the delay in connection time.
Recommended action :
Once the source of the timeouts is identified:
- if it’s a database consider improving queries’ performance, you can read the next articles.
- If it’s an application issue, consult the application team.
- If it’s a system issue, consult the system and IT team. You may consider upgrading the hardware.
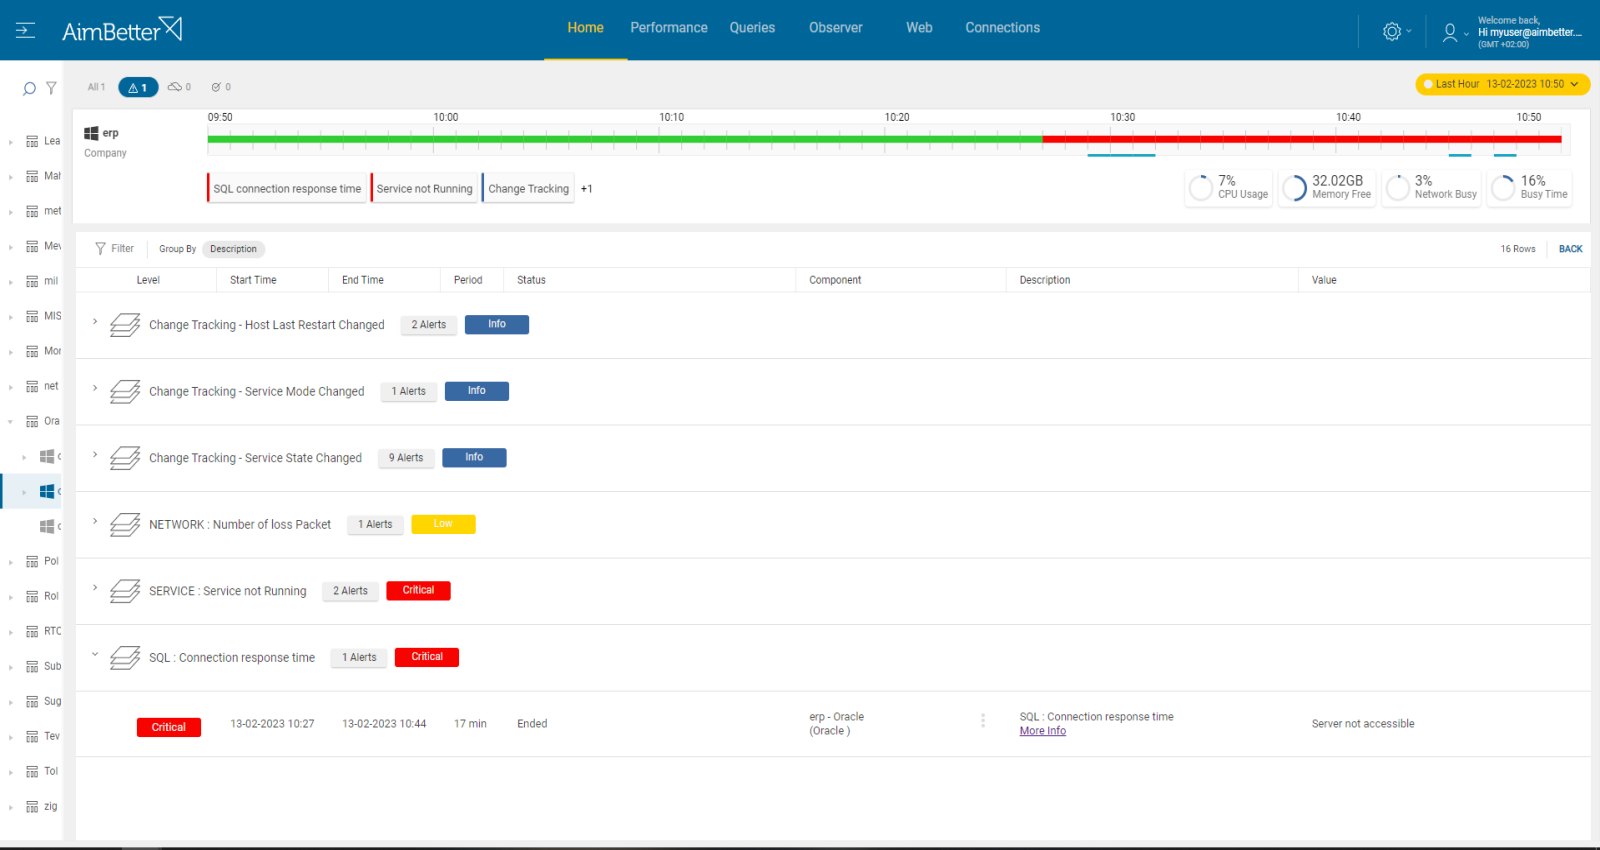
9- Unavailable Instance Priority: Low
This cause is relevant only when the test connection alert reaches 60 seconds.
Problem identification:
You’ll receive error messages related to the unavailable instance on the network.
Hands-on approach
- Users might report that they receive error messages related to the unavailability of the instance on the network.
- Check if the SQL Service or Oracle service is down, for that, you have to enter the task manager and check whether the service is running or stopped. If that’s the issue, check if the instance may have stopped unexpectedly due to a system crash or if the service has been intentionally stopped for maintenance time.
- Check for a firewall block. This could be because of port blockings: the default for SQL Server is port 1433, and for Oracle, it’s port 1521.
- Check for a stuck policy update. A policy could be preventing the instance from being accessed.
Recommended action :
If it’s a service issue, run the service and consider how you can avoid the issue from happening again. If the service stop was initiated, make sure not to have maintenance time during working hours.
If it’s a firewall issue or a stuck policy issue, consult with the IT team.


