A log switch occurs when Oracle fills a redo log file and switches to the next available redo log. Redo logs record all changes made to the database to ensure recoverability in case of failure.
Tracking log switches per hour is critical because an unusually high number of switches can indicate excessive transaction activity, potential misconfigurations, or underlying system performance issues. Ignoring this can lead to performance degradation, archive log space exhaustion, and longer recovery times during database restoration.
The Oracle Log Switches per hour metric tracks the frequency at which Oracle switches redo log files during database operations. By configuring a threshold, AimBetter can notify when the number of log switches exceeds a normal range, helping to prevent potential performance or storage issues.
Possible causes
1. High Transaction Volume
The database is processing an unusually large number of transactions per hour.
Problem identification:
Determine which operations or applications are generating excessive redo logs.
- Query V$LOG_HISTORY and V$LOG to track log switches over time.
- Use V$SQL to identify SQL statements with high DML activity.
- Check active sessions in V$SESSION to see which users are executing heavy transactions.
- Analyze redo generation with V$SYSSTAT for redo size.

Recommended action :
- Optimize batch jobs
- Reduce unnecessary commits
- Reschedule heavy operations to off-peak times.
2. Redo Log File Size Too Small
Redo log files are undersized, causing frequent switches even under normal workload.
Problem identification:
Determine if the current log file size is appropriate for transaction volume.
- Query V$LOG to review current redo log file sizes.
- Check V$LOG_HISTORY for the frequency of switches.
- Compare log file size to redo generation rate in V$SYSSTAT.
- Consider the expected workload and growth trends.
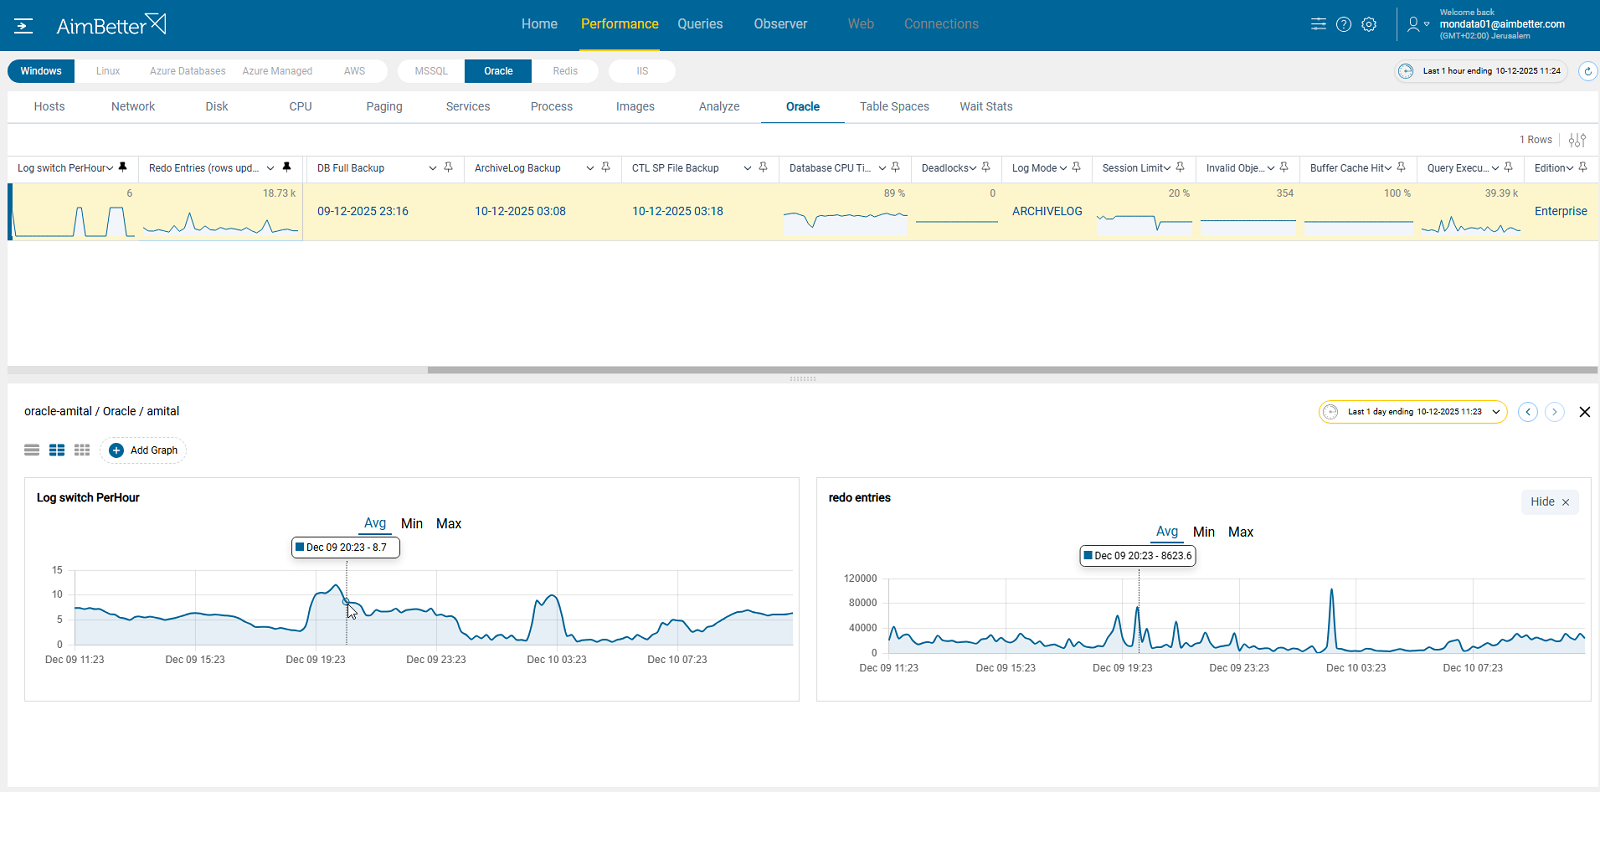
AimBetter does more than just count log switches per hour — it also tracks redo entries generated across time.
You can easily identify whether switches are proportional or excessive, making it clear when redo logs are switching too fast, even at normal redo volumes, pointing directly to undersized log files.
With historical baselines, you can confidently decide whether to increase the redo log size.
Alerting when redo generation grows over time, helping plan future resizing.
Recommended action :
- Resize redo logs based on workload trends
- Consider adding additional redo log groups for smoother switching.
3. Inefficient DML or Uncommitted Transactions
Poorly optimized data modification statements or long-running uncommitted transactions generate excessive redo.
Problem identification:
Identify SQL operations that produce high redo volume or remain uncommitted for long periods. Redo logs are generated only by database changes (INSERT, UPDATE, DELETE, MERGE, etc.).
- Use V$SESSION to find long-running transactions.
- Query V$TRANSACTION to monitor active and pending transactions.
- Analyze redo size per SQL in V$SQL or V$SQL_MONITOR.
- Optimize indexes or batch processing to reduce redo generation.
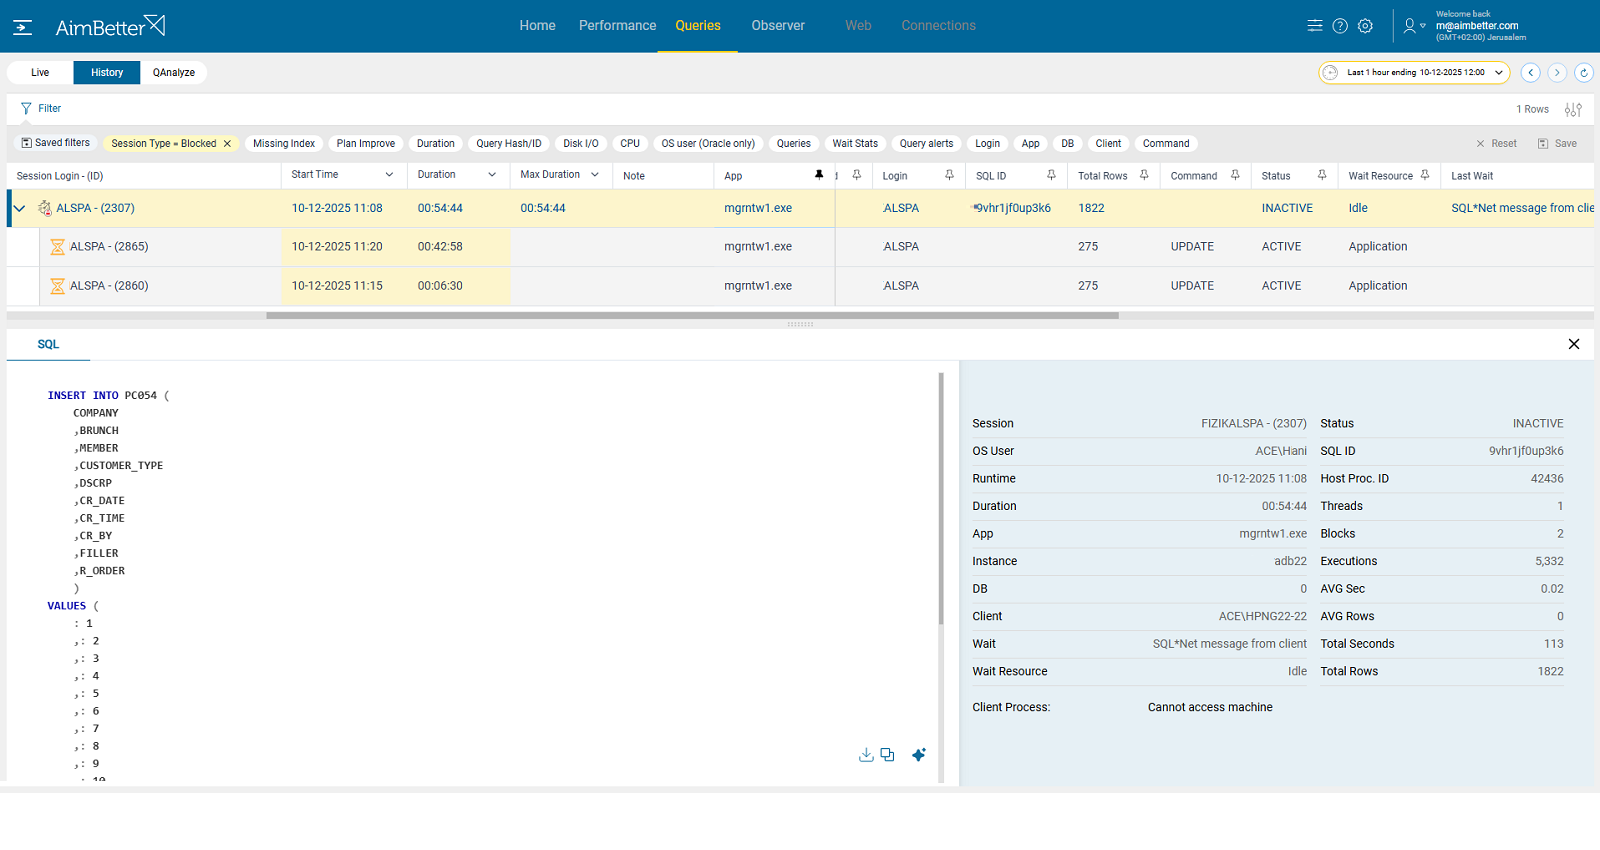
AimBetter makes it easy to identify the source of redo spikes by showing blocking and waiting sessions in real time and correlating them with the exact timestamps of log switch peaks. You can filter by session type (blocking) and queries’ code (INSERT, UPDATE, DELETE, MERGE, etc.) to quickly reveal which sessions and SQL were stuck and caused the surge.
Recommended action :
- Refactor inefficient SQL
- Use proper indexing
- Enforce smaller commit intervals to reduce redo generation.


