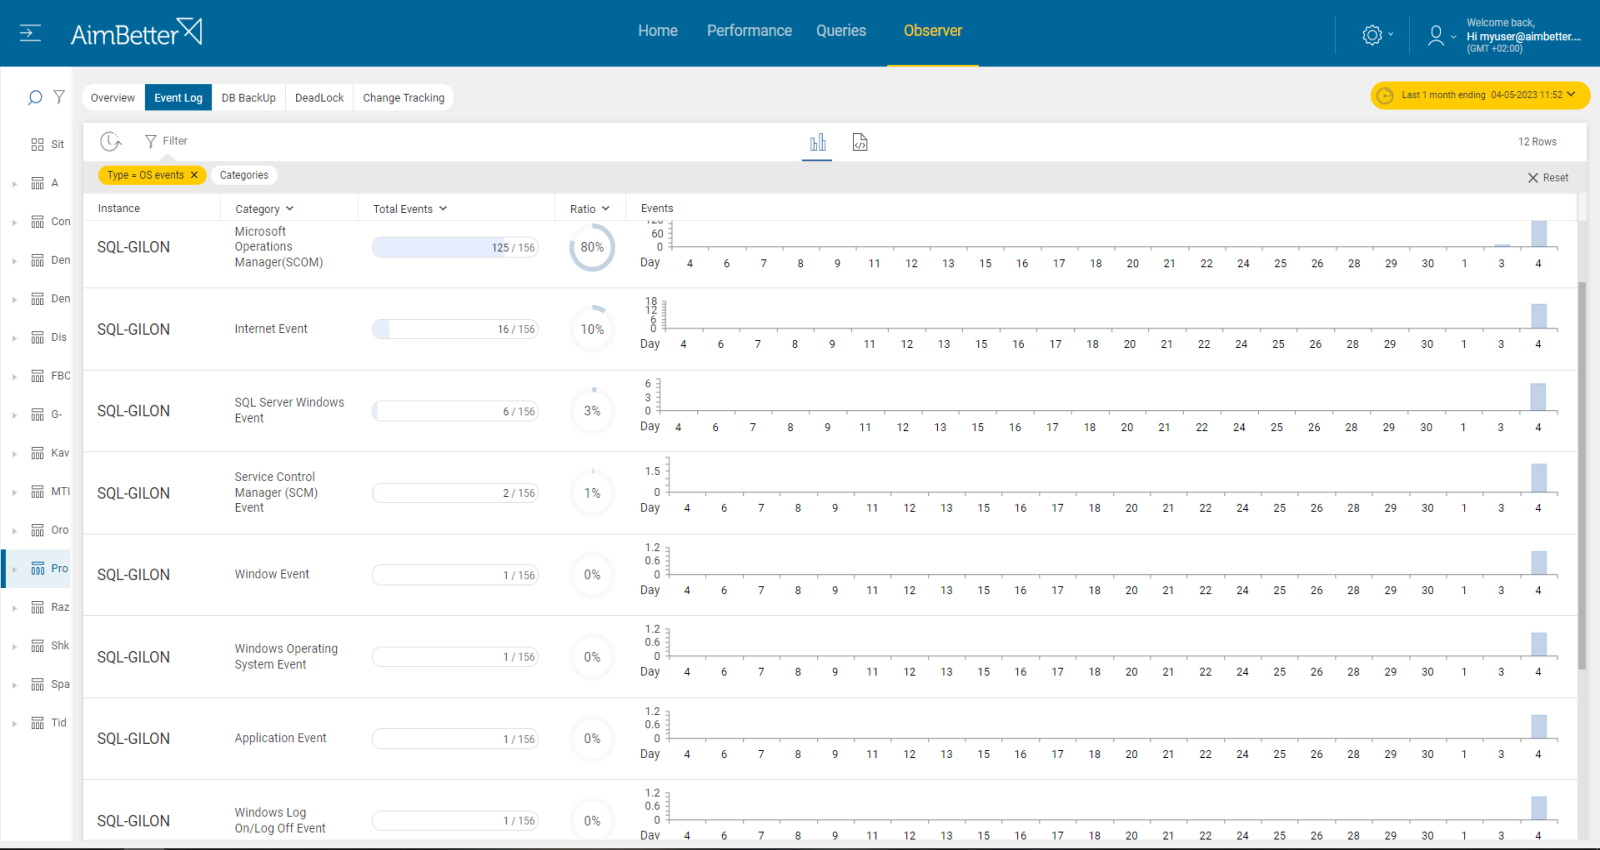
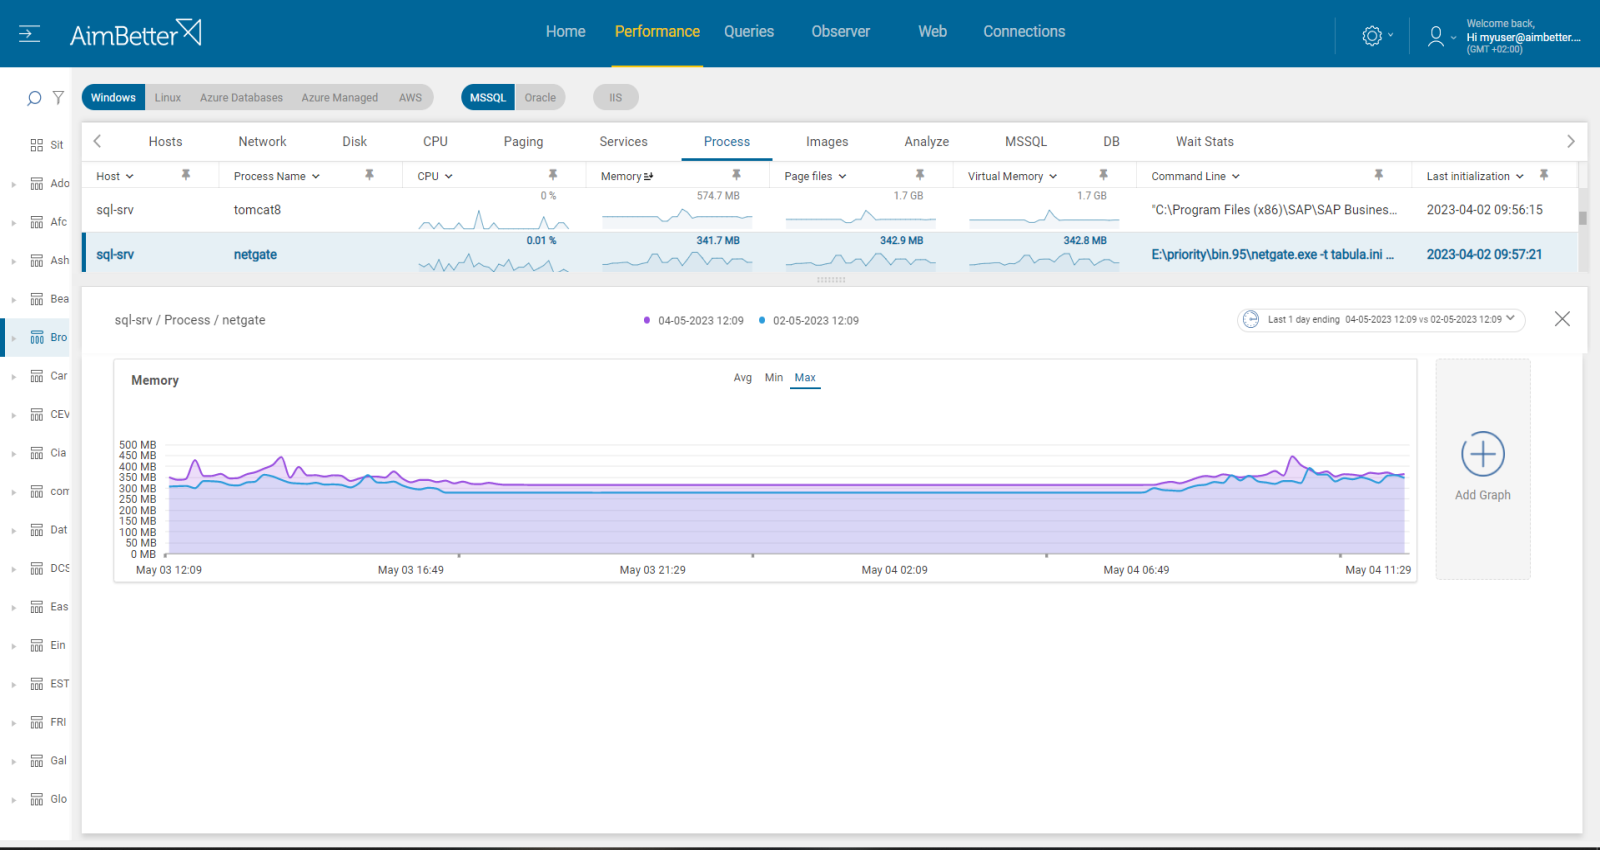
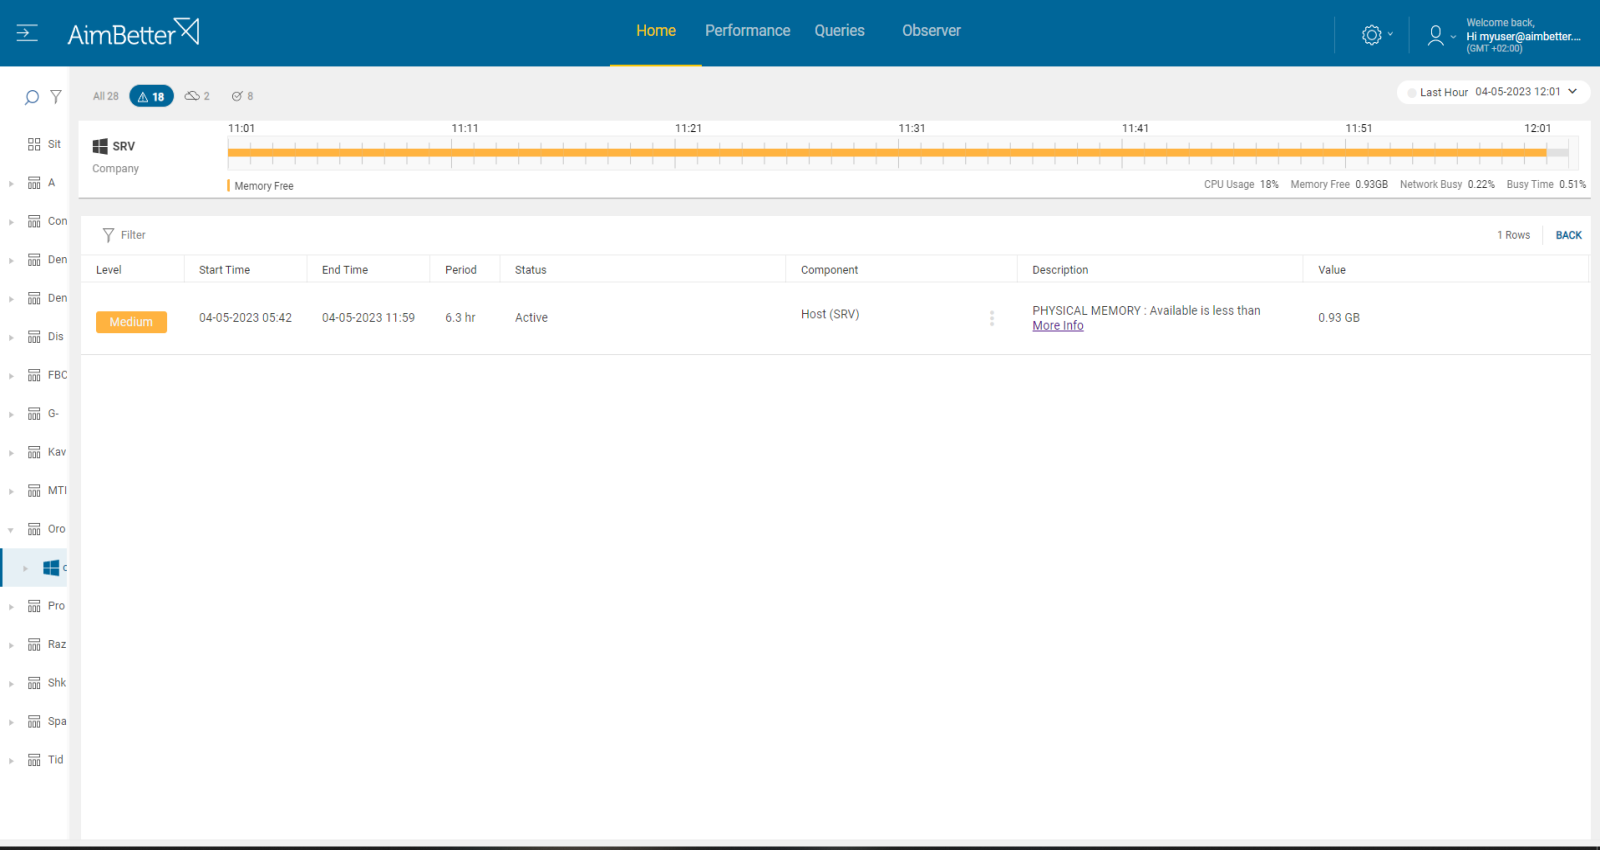
This metric indicates excessive memory use by a specific executable image, which can reduce memory available to other applications and system operations and may increase paging activity.
Low available system memory can increase disk reads and writes as the operating system moves memory pages between RAM and the paging file. This physical I/O can significantly degrade server performance. When a specific image consumes an unusually large amount of RAM, it can contribute to memory pressure and affect the performance of both the image itself and other applications running on the server.
Image Memory indicates when a specific executable image running on the server utilizes RAM memory. The image may represent an application, system program, background service, or other executable.
Find out how you can save hours of work when investigating the root cause of this issue.
Symptoms :
A specific image is consuming an unusually high amount of RAM, potentially reducing available memory for other applications and system operations. As memory pressure increases, paging activity may increase, and overall server and application performance may deteriorate.
Impact: Medium
High memory consumption by a specific image can reduce the memory available to other processes and increase paging and physical disk activity. This can result in slower responses and degraded user experience.
Expected behavior :
Image memory consumption depends on server activity, the specific application or service, and the number of image instances running on the server. Some applications may legitimately consume large amounts of memory during intensive operations, while consistently increasing or unusually high memory consumption may indicate a problem.
Evaluate the impact relative to the server’s total available memory and overall memory pressure. Investigate a single image that repeatedly consumes more than 500 MB over time, especially when it is associated with low available memory or increased paging activity. For memory-intensive applications, higher consumption may be expected and should be evaluated according to the application’s normal behavior.
Possible causes of high Image Memory load
1- Poor application design caused by heavy tasks or non-optimal settings. Priority: Medium
In some applications, there are tasks that are running by default on working hours, which might overload workflow. In other cases, the application settings are not optimal for needed workflow or do not fit the host server.
Problem identification:
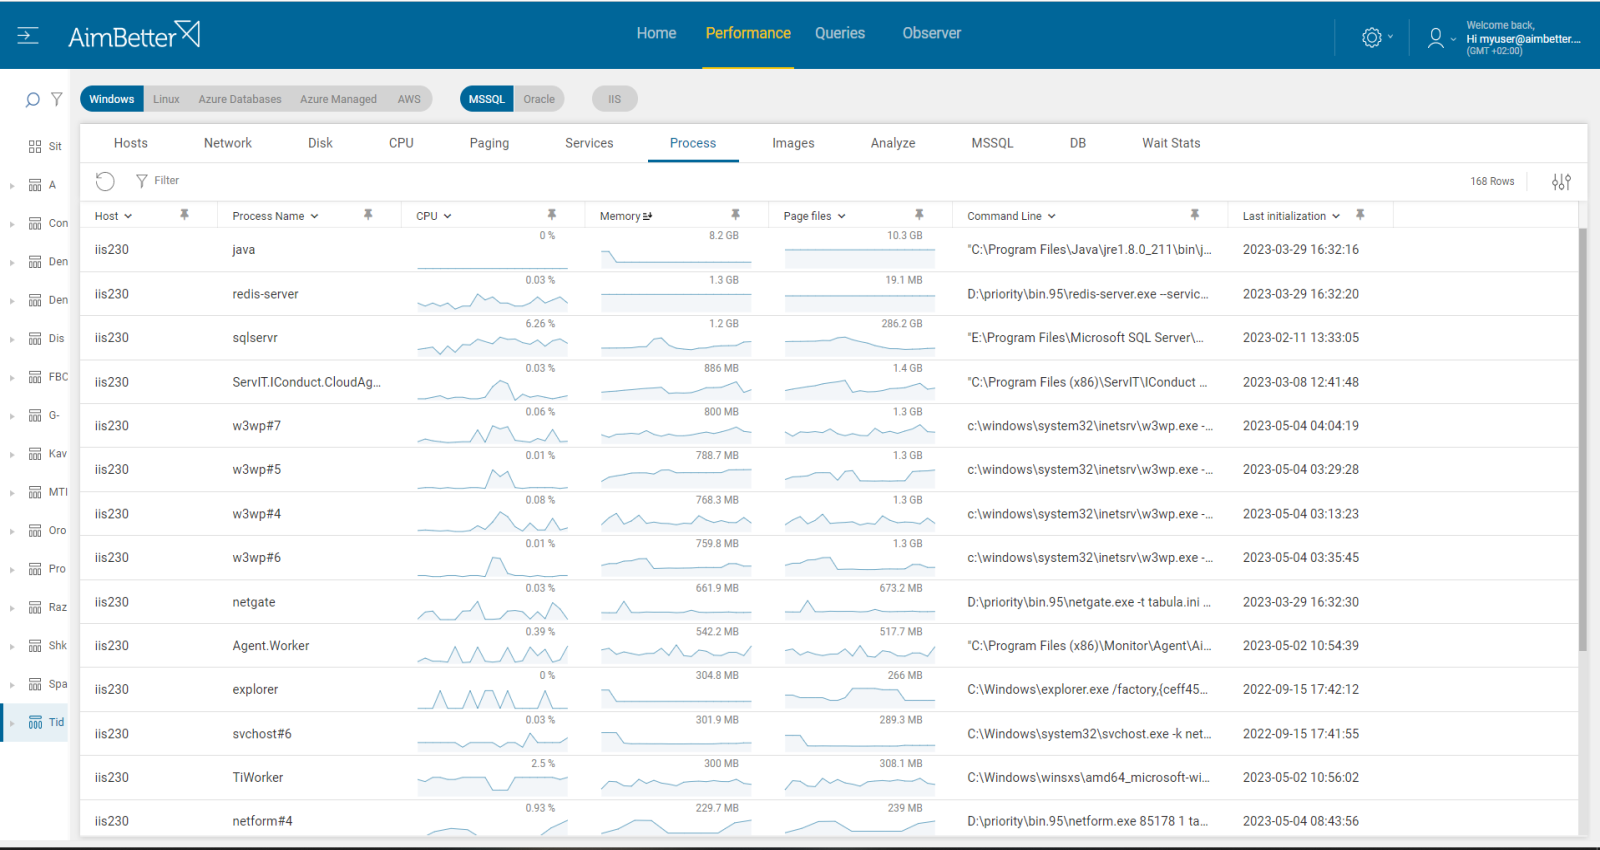
Search for processes consuming much RAM memory and seen on the command line as part of the suspicious application that is checked currently.
- Enter the Task manager and follow up on specific processes that consume much RAM memory compared to other processes running. Follow if the processes are related routinely to the same application. Take into account that you can only see live data without historical events.
- Look for errors related to that application. Consult the application team to check if these errors might be related to non-optimal application settings.
- Consider changing application settings by consulting with the application team. For example, consider removing specific overloading tasks to non-working hours in order to reduce total RAM consumption in working time. You should track this issue over time, which might be hard to do without proper monitoring.
Recommended action :
Try making changes to current application settings while consulting with the application team. Track any change that is done.
2- The server does not fit application requirements. Priority: High
There are cases when the server does not fit the application requirements for better resources than exist in the hosting machine. This results from insufficient memory available on a system to support a particular program or workload.
Problem identification:
Search for processes causing high RAM memory and seen on the command line as part of the suspicious application that is checked currently. Look for errors.
- Enter the Task manager and follow up on specific processes that are consuming at least 500MB RAM memory. Search for the command line in order to check whether these processes are assigned to the same application repeatedly. Take into account that you can only see live data without historical events.
- Review the total RAM memory available in the machine.
- Look for errors related to the most RAM-consuming application, which might be related to non-fit hosting machines. You should do this step with the application team.
Recommended action :
Consider upgrading hardware and consulting the application team.
3- Long-running queries with open transactions Priority: Medium
Long-running queries can consume excessive system resources such as CPU and cache, which can cause other queries to slow down or fail, and may even crash the database server. In addition, it can cause further problems, including locks, data consistency issues, and rollback failures.
Problem identification:
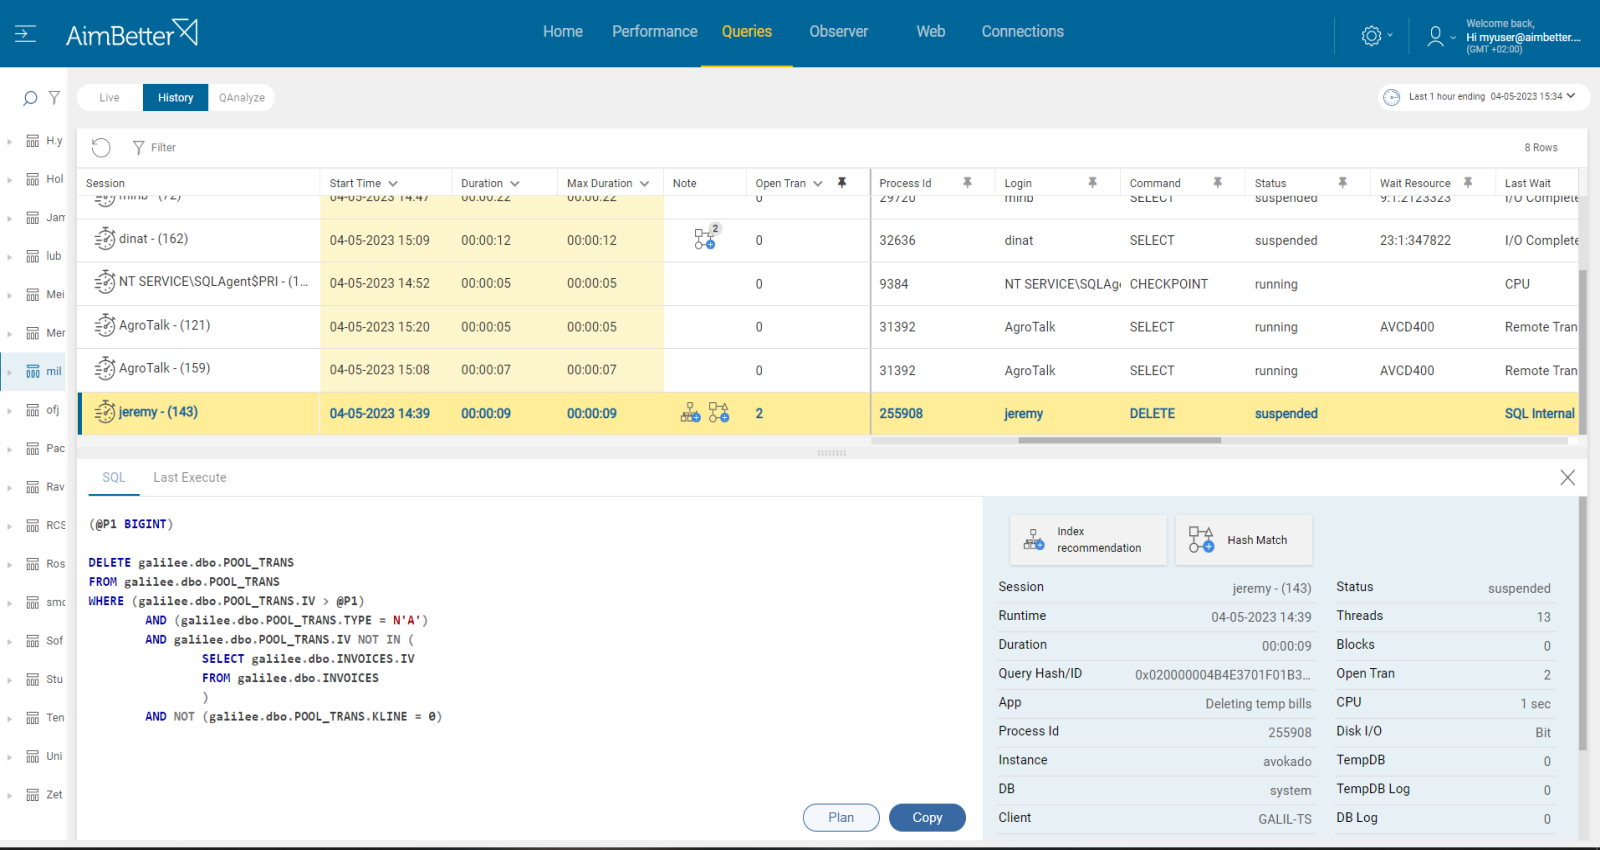
Identify long-running queries with open transactions that hold on OS resources while focusing on cache usage and the applications that consume most RAM memory.
- Use SQL Server Management Studio to identify the long-running queries with open transactions that are consuming more memory. For Oracle, you should use Oracle Dynamic Performance Views or other tools. In both, include searching for the program which activates the queries.
- Look for queries with code written ineffectively. Consider how to improve the performance of these queries. Try to look at improving query code, reducing transaction length, or identifying inefficient operations in the query’s plan. This task might be complicated, requiring a highly skilled DBA.
- You may need to increase the amount of memory allocated to SQL Server or Oracle.
Recommended action :
Optimize the application code – avoid starting a transaction in your application that is having long conversations with the SQL Server or risks leaving one open too long. If doing operations on large numbers of rows, consider batching them up into more manageable chunks and specifying the log time to recover.
Improve the query execution plan, increase the allocated max memory, or consider upgrading your hardware to increase the amount of RAM available to the server.