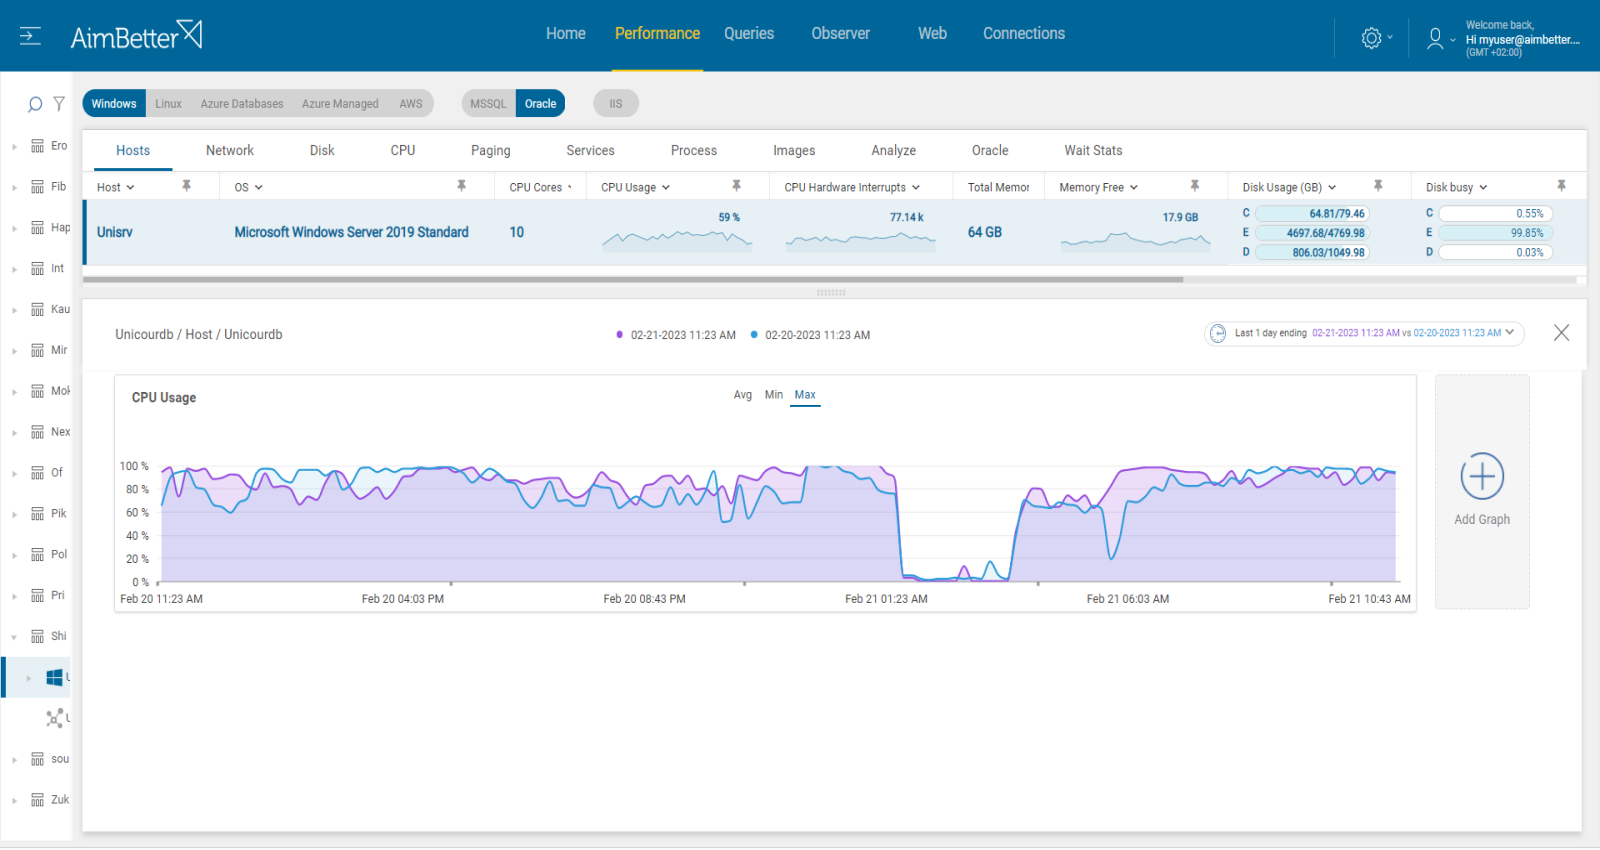
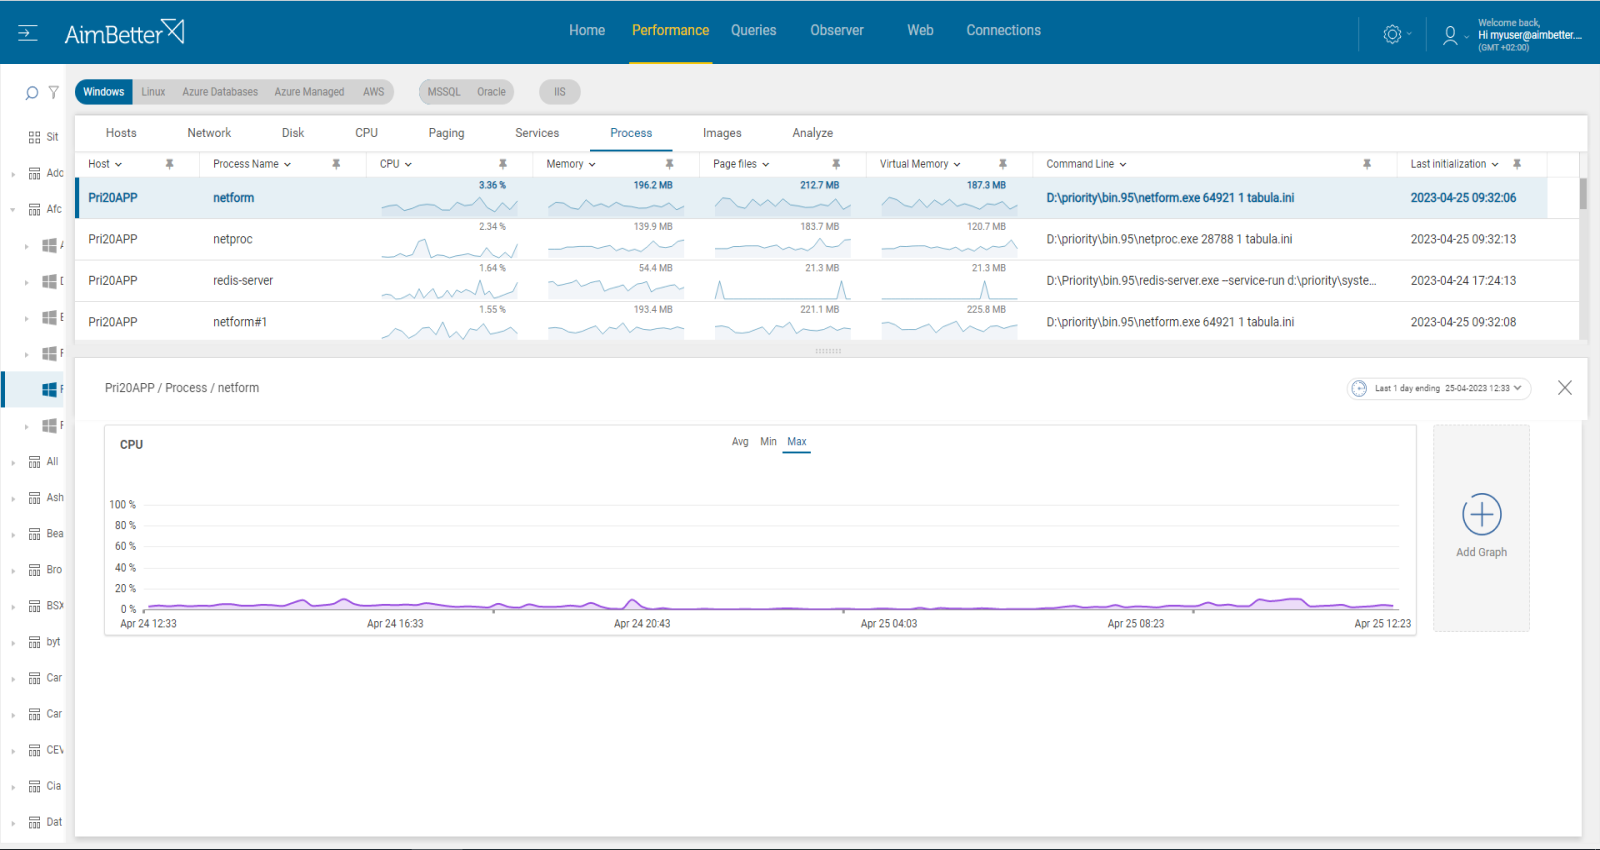
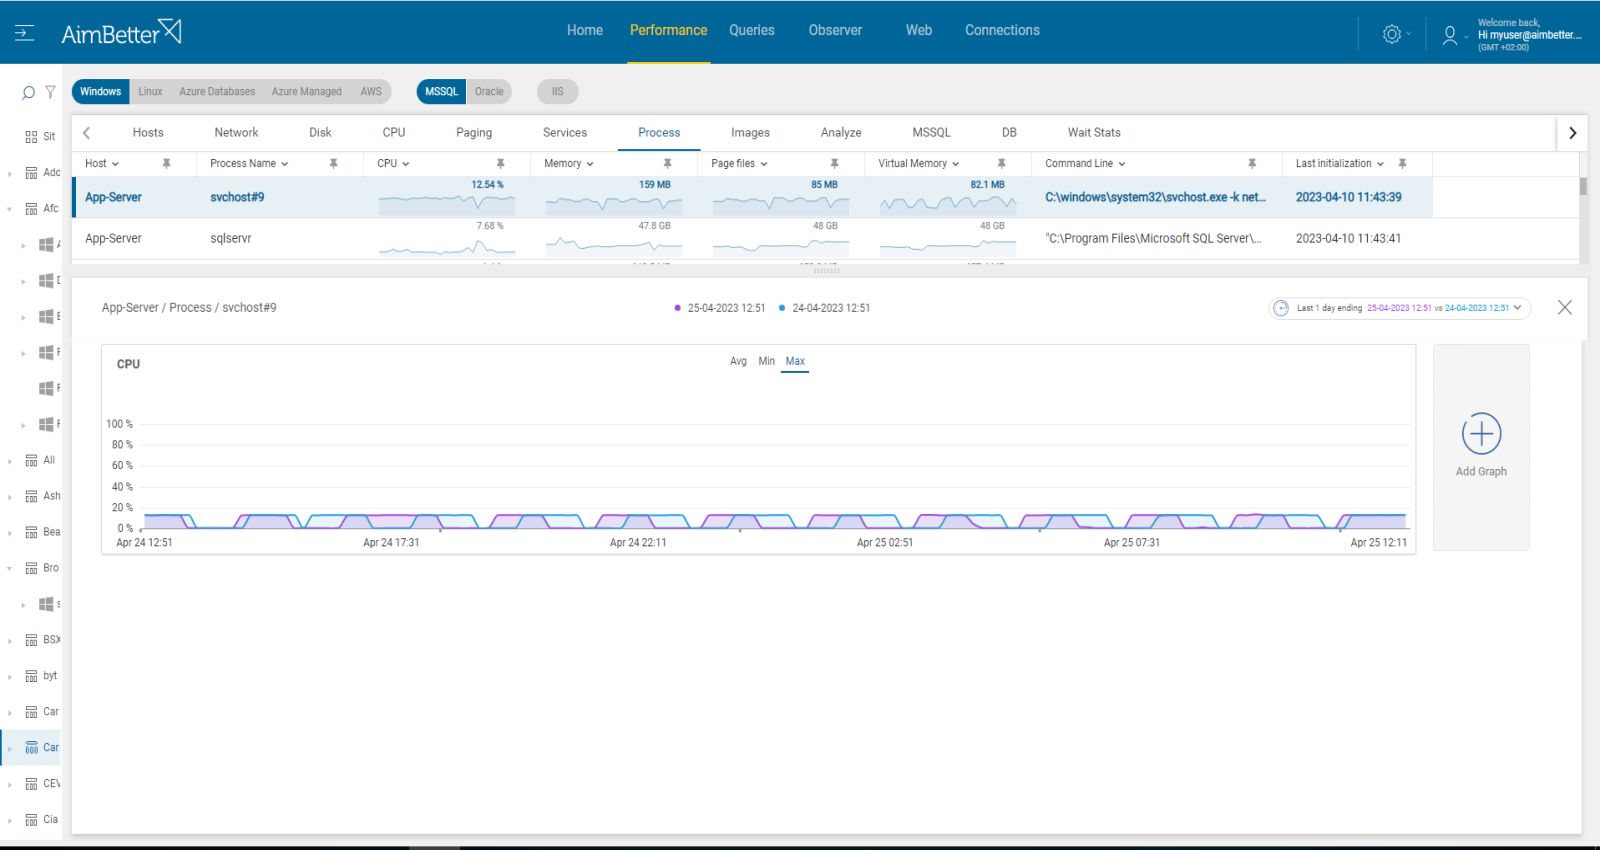
Image CPU measures the CPU utilization and processing time consumed by a specific executable image running on the server. An image represents the program or executable responsible for the CPU activity, such as an application, system process, or background service. Unlike overall CPU utilization, Image CPU helps identify which specific executable is responsible for excessive CPU consumption.
Find out how you can save hours of work when investigating the root cause of this issue.
Symptoms :
Individual executable images consume excessive CPU, which can affect overall server performance and the responsiveness of other applications and services.
Impact: Medium
High CPU load can degrade user responses, reducing efficiency across all operations. In addition, the program itself may run more slowly than usual, causing all operations to execute more slowly.
Expected behavior :
Figures will vary based on user activity levels, time of day, application workload, and the number of image instances running on the server. CPU consumption by an image may increase temporarily during intensive operations and does not necessarily indicate a problem.
The impact of Image CPU depends on the specific executable and its role in the system. Some applications may run multiple instances of the same image simultaneously, while others may use only one. Evaluate the total CPU consumed by an image relative to the server’s overall CPU capacity and number of CPU cores. Even relatively low CPU utilization by a specific image may affect user activity if the application is performance-sensitive.
Possible causes of high image CPU load
1- Long system tasks Priority: Medium
System tasks might run longer when multiple applications or processes run on the server and require CPU. This can cause the CPU of a specific process to be higher due to a heavy workload.
CPU loads might occur once many users are using the same application on the same machine, which happens regularly in Terminal servers. Otherwise, unusual levels of CPU load activities may be coming from external operations (anti-virus scans, backups, restores, etc.) from networked data stores. Probably part of the application will require using only an individual core.
Problem identification:
Identify the source of the load. If it is recurrent, try to reschedule some applications to a time of low user demand or regulate the overall performance of the applications.
- When trying to identify the source of the load, check the Task Manager or Activity Monitor: use built-in OS tools such as Performance Monitor to identify which processes are using CPU resources. You can’t guarantee precise results when checking the online status with no historical events.
- Identify the process causing high Core usage and then determine the cause of it. You can use a process explorer tool like Process Explorer for Windows or Htop for Linux.
- Look for unnecessary startup programs: Some programs may start automatically and run in the background, consuming CPU resources. You should disable it. It might take time to identify it.
- Make sure your software and drivers are up-to-date.
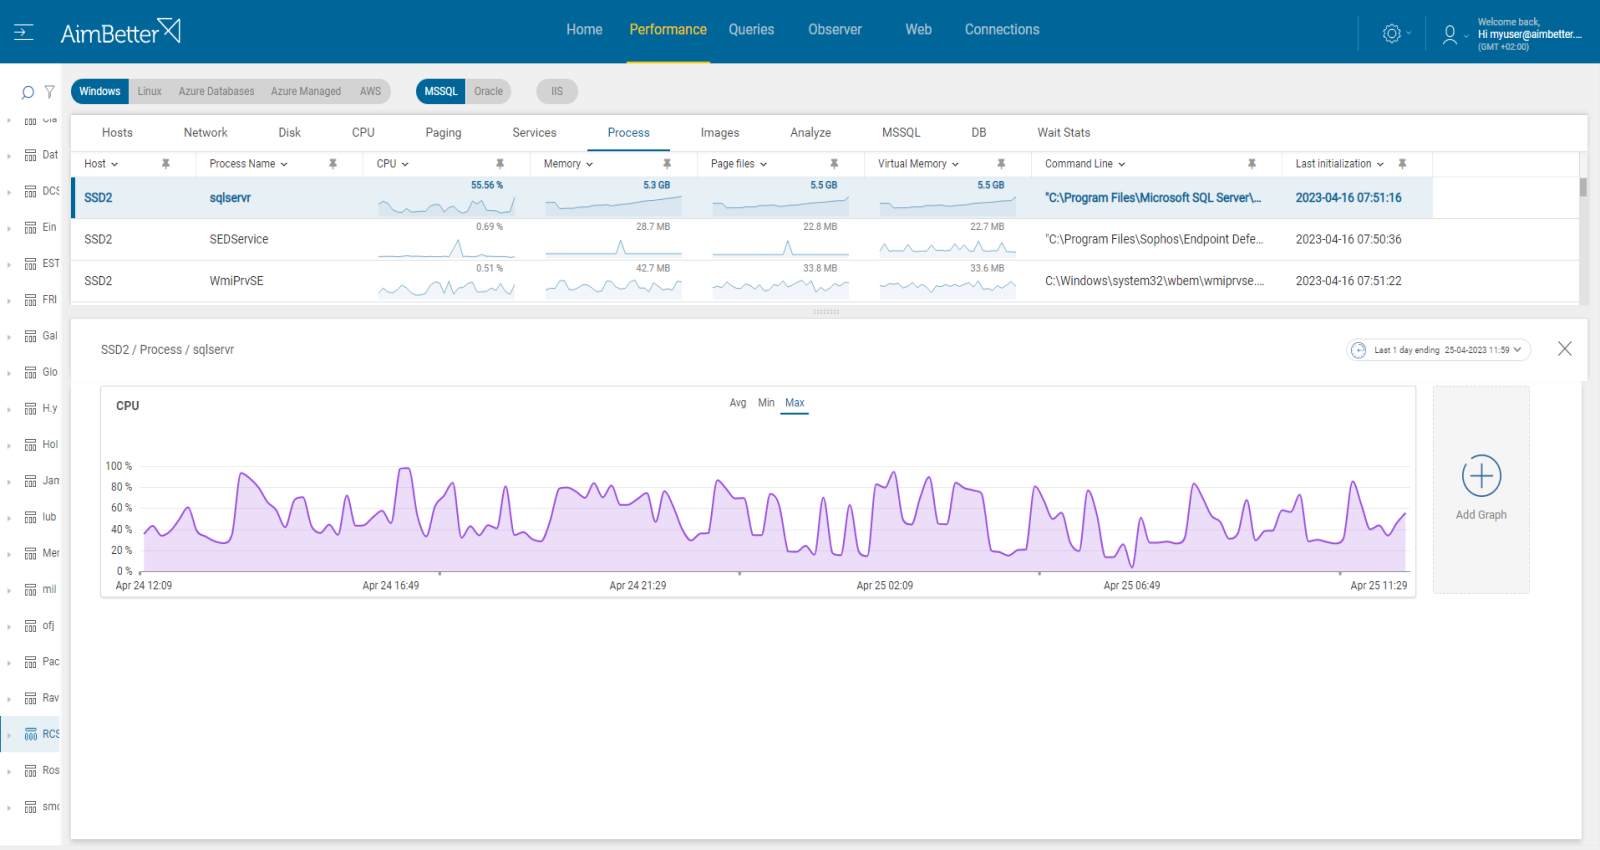
Recommended action :
Cancel unnecessary programs that cause high Core utilization or change their execution to a time when work demand is lower. Upgrade software and hardware if needed.
2- Long SQL tasks Priority: Medium
Several of the programs might depend on the performance of queries.
It loads the CPU due to long tasks performed, such as :
- accessing data where indexes are missing or corrupt (causes long loops)
- pulling large volumes of data (results in many threads or long loops)
- coding problems (inefficient organization, missing indexes causing many threads or long loops)
Problem identification:
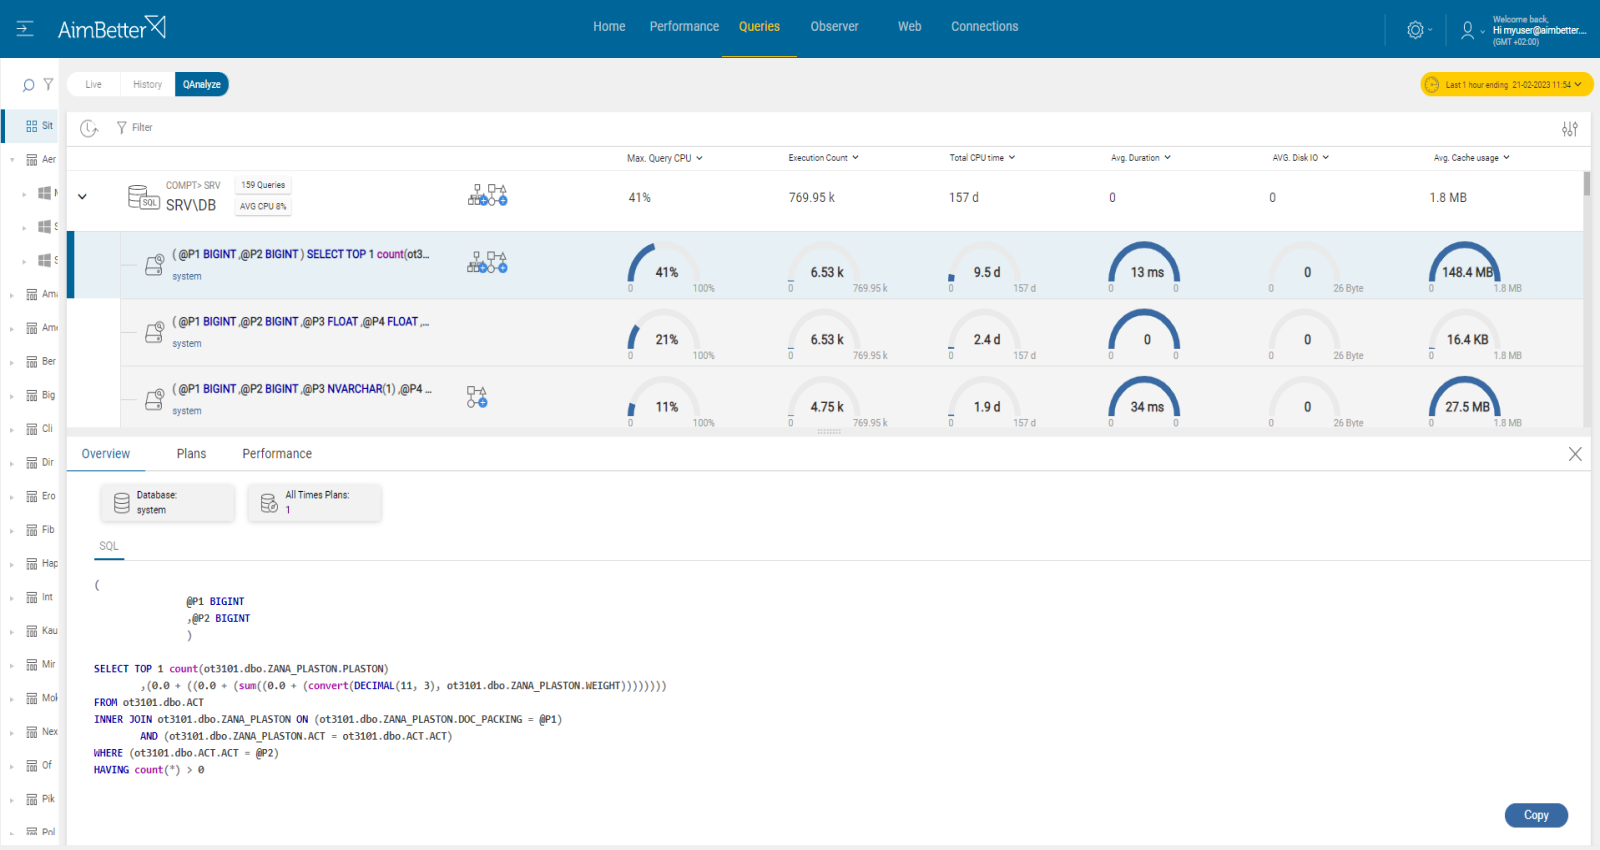
Identify high CPU-consuming queries which are running from applications that currently consume high CPU for their process.
- Check the database server activity: You can monitor the database server activity to identify which SQL statements are consuming the most CPU resources. You can use the built-in activity monitors or SQL Profiler for SQL Server. You can use tools like AWR to identify the top SQL statements for Oracle. This mission might be complicated and take hours or days of work, requiring a highly skilled DBA.
- Check the database server configuration. Make sure they are optimized for your workload.
- Check the query execution plans for the top CPU-consuming SQL statements to identify inefficiencies or potential improvements. This mission might be complicated, requiring a highly skilled DBA that can view a complete SQL query plan that might be long and complicated.
- Look for a way to optimize the SQL statements for better performance. This may involve rewriting the SQL statements, adding or removing indexes, or making other schema or database settings changes. It might be complicated and take days of work.
- Check for hardware issues. Consider adding cores if needed.
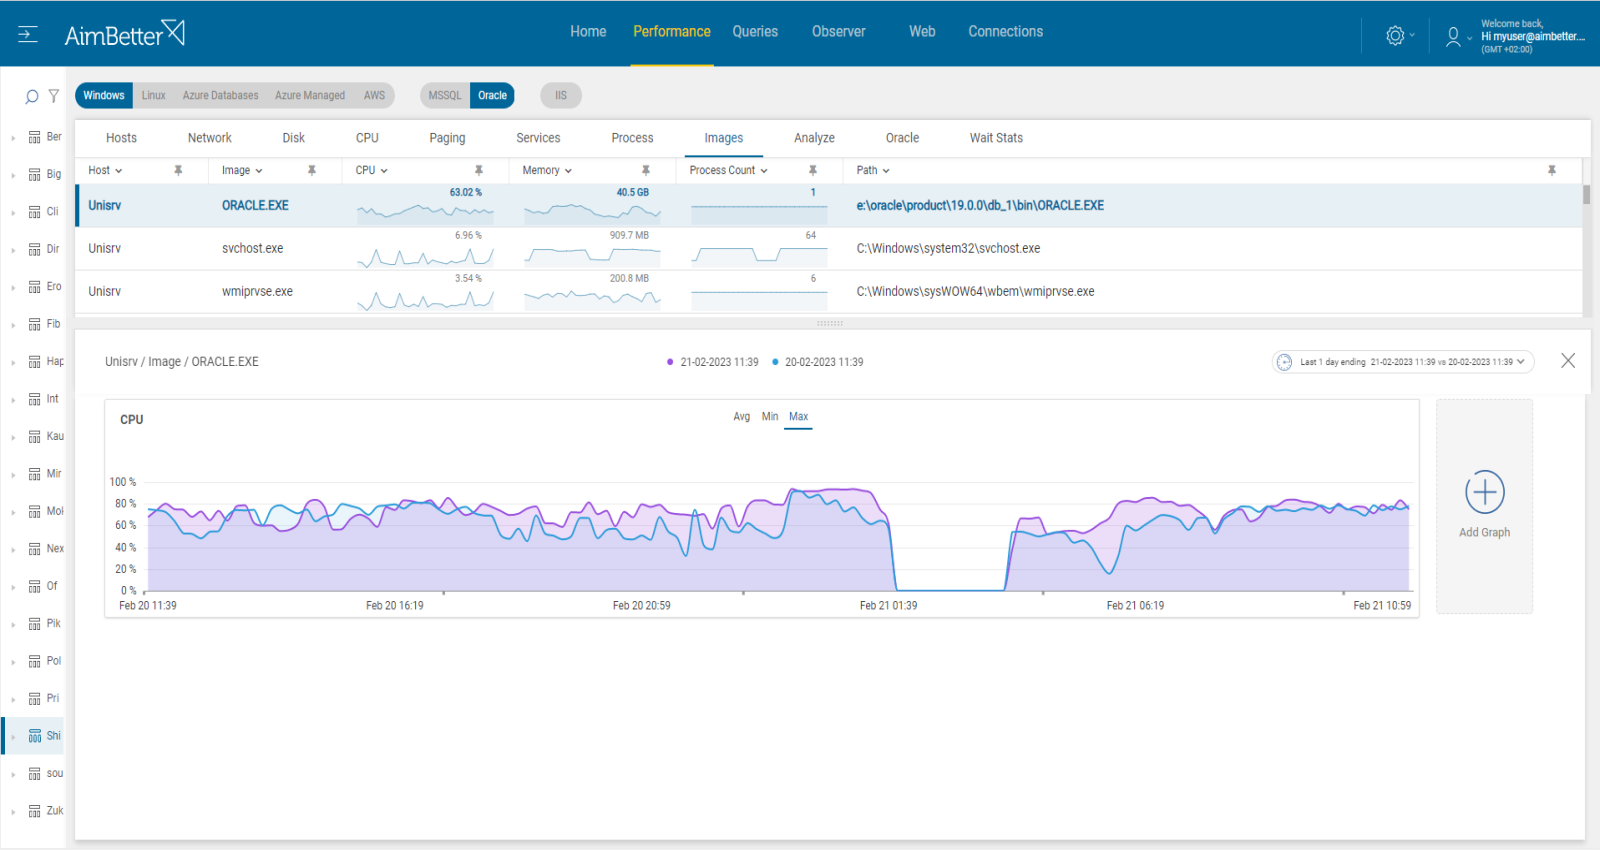
Recommended action :
Fix database server settings that are not optimal and might cause low performance. Look for functions over fields that can be tuned or avoided in order to improve performance. Optimize queries’ execution plans, add or remove indexes (while detecting it by using query execution plans), and make changes to database schema or database settings. Add cores if possible.
Break complex queries into more simple steps. Make sure that each transaction has COMMIT (in case of no errors) and ROLLBACK (in any case of an error) statements where applicable.
3- Application-related issues Priority: Low
In some applications, there are tasks that are running by default on working hours, which might overload workflow.
In some cases, the application settings are not optimal for needed workflow or do not fit the host server.
In other cases, the server does not fit the application requirements for better resources than the existent in the hosting machine.
Problem identification:
After trying to check long system tasks or long SQL tasks, you should try checking this issue. Search for processes causing high CPU and seen on the command line as part of the suspicious application that is checked currently. Look for errors.
- Enter the Task manager and follow up on specific processes that are consuming high CPU. Search for the command line in order to check whether these processes are assigned to the same application repeatedly. Take into account that you can only see live data without historical events.
- Look for errors related to that application, these errors might be related to non-optimal application settings or to non-fit hosting machines. You should do this step with the application team.
- Consider changing application settings or upgrading hardware if needed. You should track this issue over time, and it might be hard to track without proper monitoring.
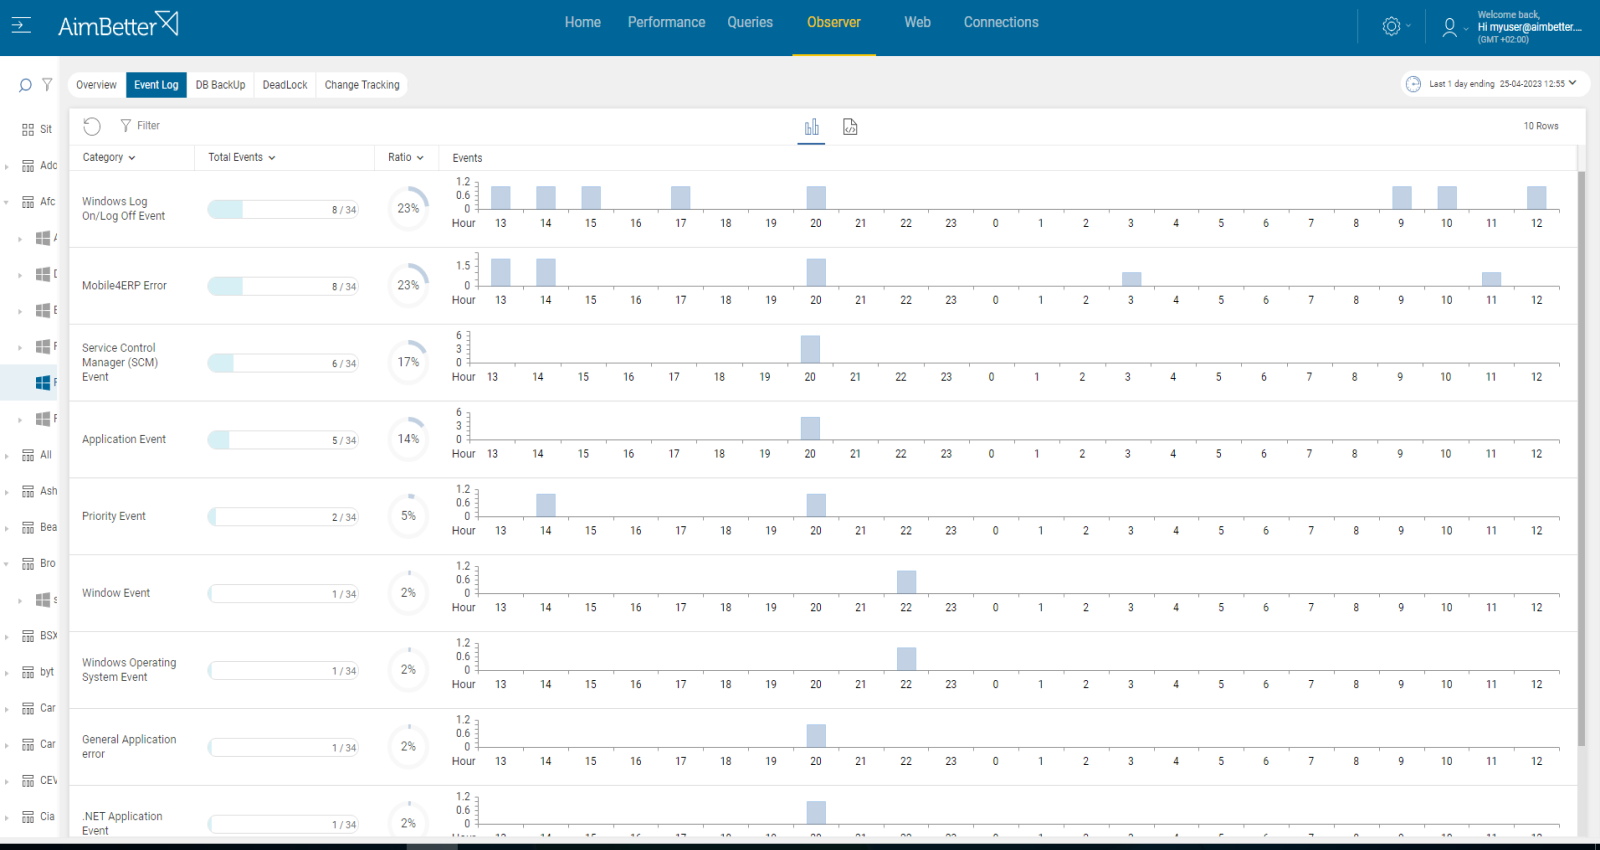
Recommended action :
Try making changes to current application settings while consulting with the application team. Track any change that is done. Consider upgrading hardware if needed.