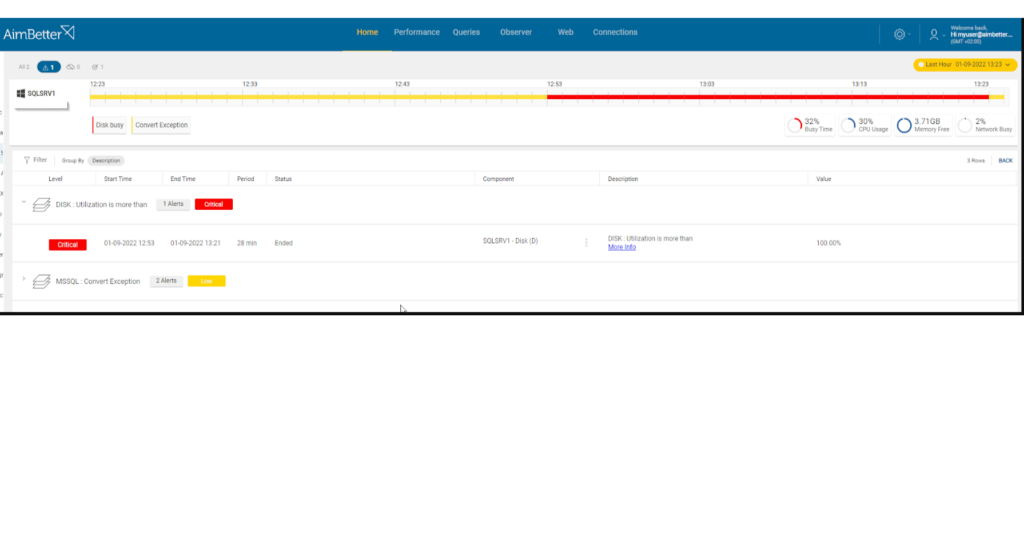
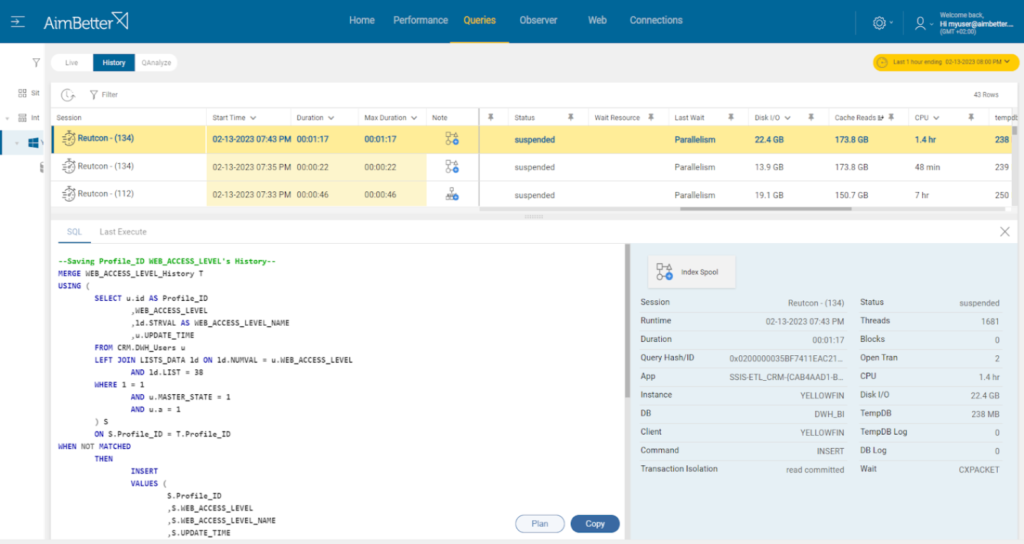
This alert indicates that the hard disk is too busy, therefore cannot apply the input/output operations at the pace that the programs demand. Since demand for disk activity may be coming both from the operating system and database activity, you should identify queries that are performing high levels of physical I/O or CPU usage.
Disk I/O overload can also manifest itself as an exceptionally high CPU load. A task waiting for disk IO will be taken off the CPU until it has been answered by the scheduler. What this means is that the CPU is 100% busy but in power saving mode because of all the waiting while longer query queues are forming. This will slow all CPU-dependent processes, resulting in overall degradation in server performance.
Both Microsoft SQL Server and Oracle use Microsoft Windows operating system input/output (I/O) calls to perform read and write operations on your disk. SQL Server manages when and how disk I/O is performed, but the Windows operating system performs the underlying I/O operations. The I/O subsystem includes the system bus, disk controller cards, disks, tape drives, CD-ROM drive, and many other I/O devices. Disk I/O is frequently the cause of bottlenecks in a system.
Find out how you can save hours of work when investigating the root cause of this issue.
Symptoms:
Applications are running slower than normal.
Impact: Medium
High levels of disk I/O may result in slow disk response times. This may create a bottleneck, degrading the user experience, and resulting in poor efficiency of your organization’s operations. A long-term consequence of over-activity in disk hardware may be a reduction in hardware life, or even catastrophic disk crashes in real time.
Expected behavior :
There is no standard metric for the disk utilization level. An alert means your threshold has been passed. Based on our experience, disk utilization should be less than 70%. As well as this metric, other AimBetter metrics such as Page Life Expectancy, Disk available space, Disk read/Disk write response, and Memory free % should all be reviewed to get a full picture of the cause of any bottlenecks.
Possible causes:
1- Operating system conflict Priority: Medium
Besides database functions, the server performs functions relating to other operating system activities, such as anti-virus scans, disk clean-up, OS updates, etc. If an unusually high level of these coincides with high database activities, there may be an excessive load on the disk from competing elements.
Problem identification:
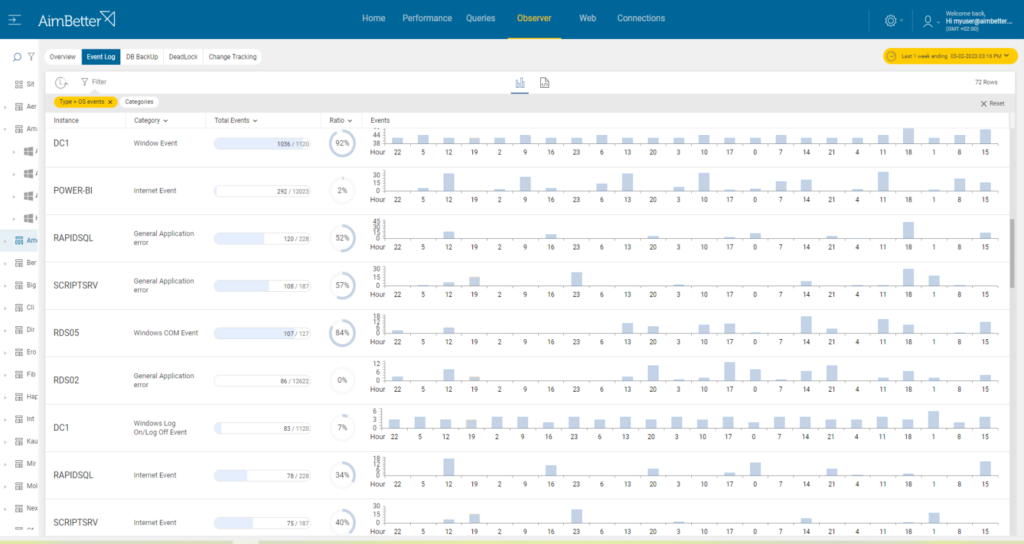
Check the operating system activities and look for abnormal behavior.
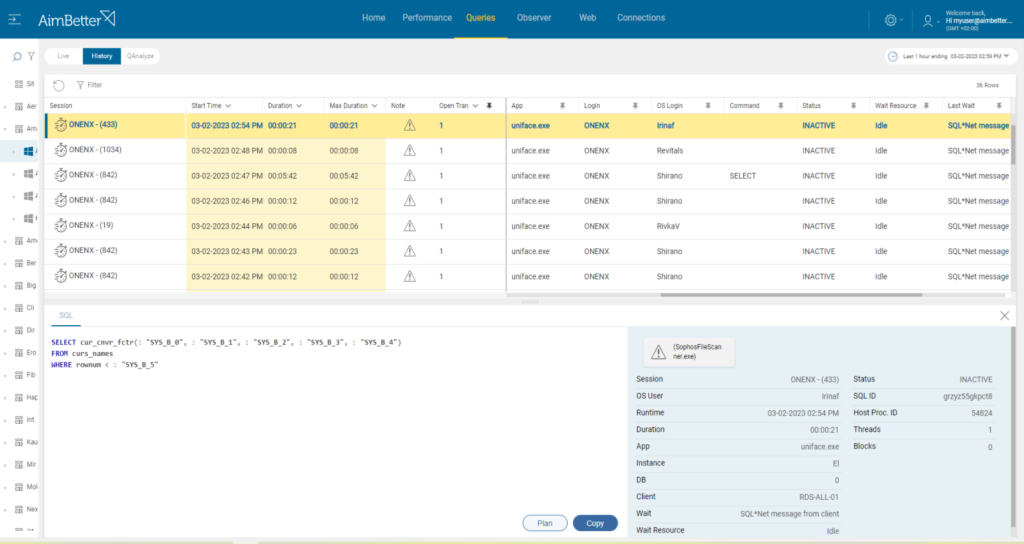
- Look for the anti-virus scan schedule. Antivirus software can sometimes conflict with the operating system or database activities and cause high disk IO. In order to identify which database activities are colliding with anti-virus scans, you will probably have to use tracking tools such as SQL Server Profiler for SQL Server or Oracle Trace for Oracle. This task requires DBA and might take significant time. It will also be inaccurate enough since checking from the current moment with no option to compare with former similar events.
- Look for incompatible drives, sometimes the driver is not compatible with the operating system’s current activity. There is higher system activity which might be colliding with the usage of the disks. Most operating systems do not have the correct tools that can check it.
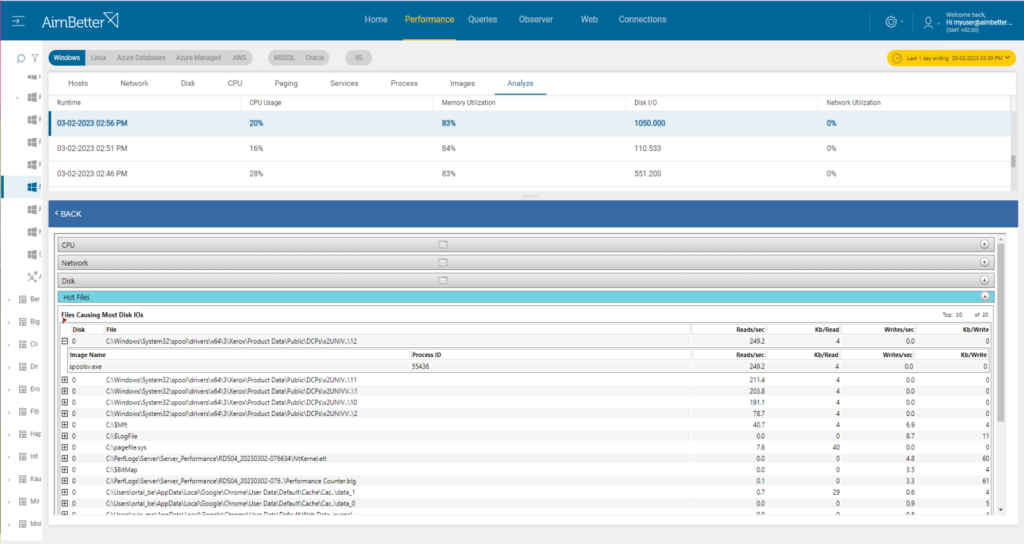
- Use task manager or other system tools, and look for tasks consuming high disk I/O. This check won’t be precise since it focuses only on the exact moment, with no history of events.
- Look for fragmented files, it might cause high disk I/O.
With our solution, each query has a note regarding an anti-virus scan while it’s running.
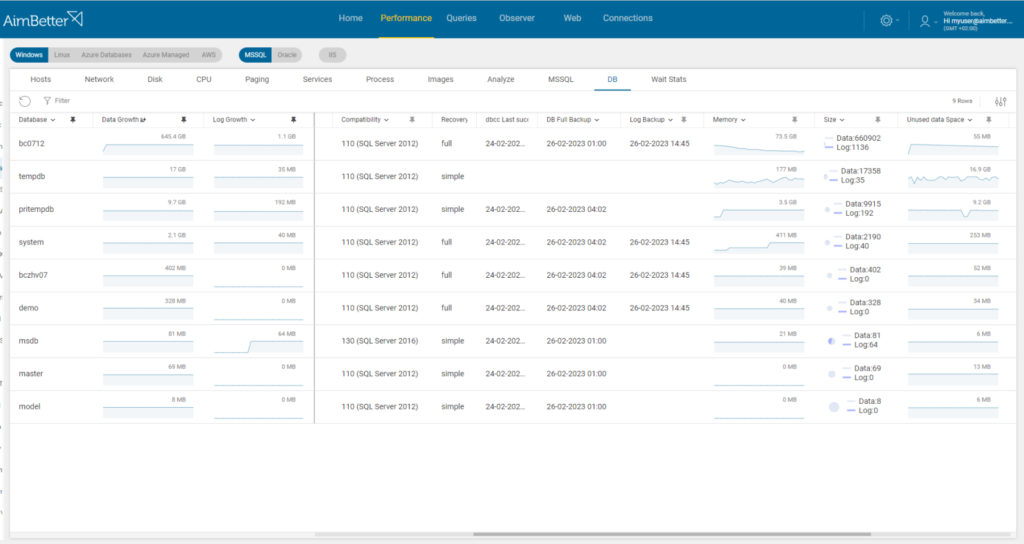
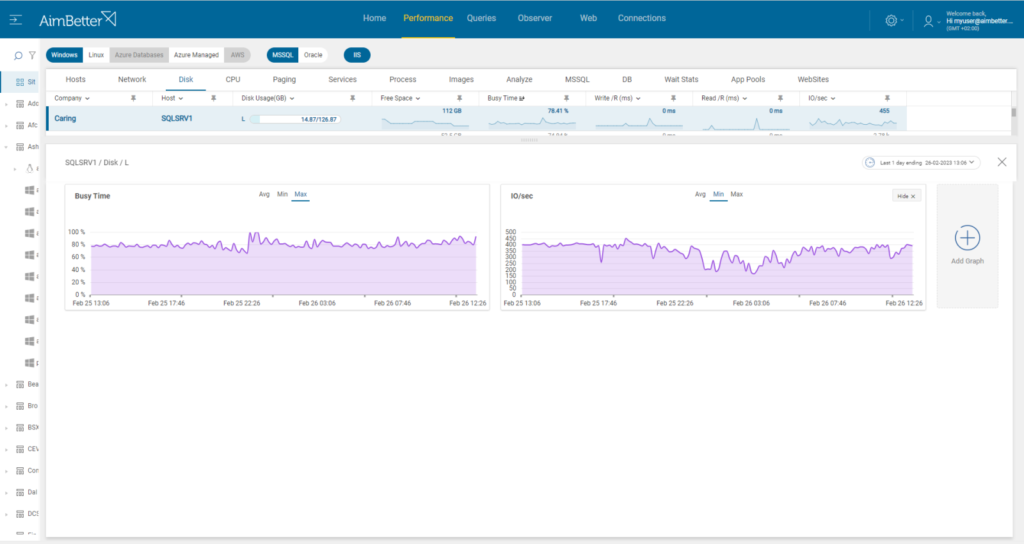
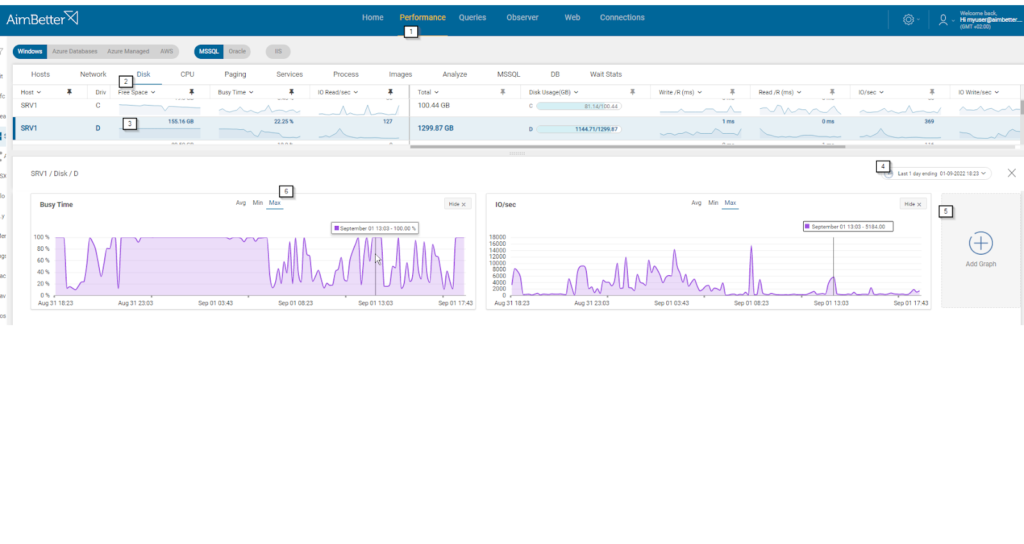
It also enables an easy view of the current performance of the disk.
It’s also easy to track with the updating logs, the tasks that have a high consumption of disk I/O.
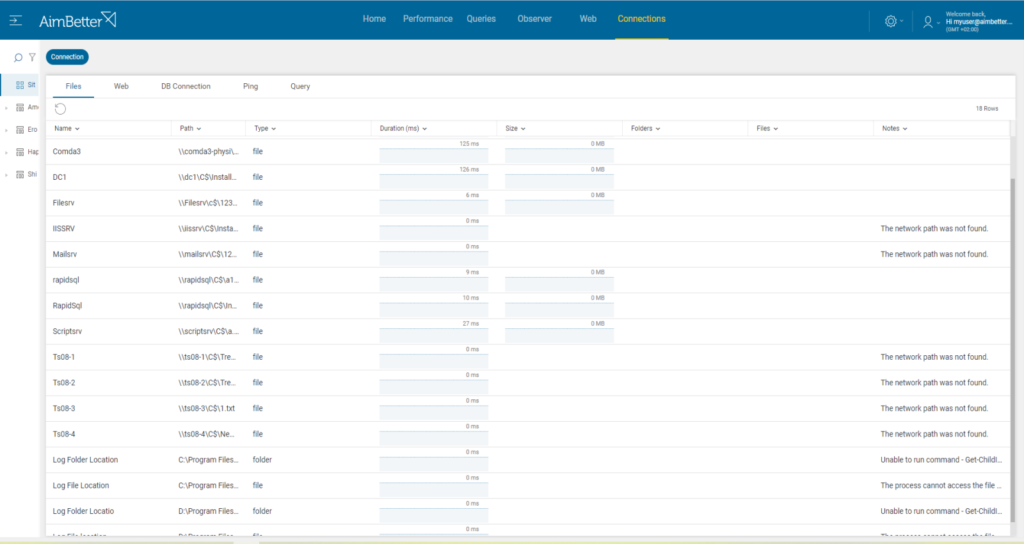
In addition, our system will notify if files are fragmented when specifically monitoring file connections.
Recommended action :
Avoid running an anti-virus scan during working hours. However, if it’s necessary, exclude database files from the scan. Replace the drive with one that can provide higher performance and I/O utilization, you will probably need downtime for this process.
Improve queries performance: Redesign the program to maximize the use of indexed data. Redesign table structures to match the requirements of the programs by building indexes. Make use of temporary tables.
2- Faulty storage hardware Priority: Medium
A storage issue like a bad controller battery or general issue at the Virtual Machine. This issue might be related to reading or writing slow responses or a system crash.
Problem identification:
Check the disk I/O performance in order to determine which is the general hardware fault currently.
- Look for slow write/read speeds. If it occurs, it might cause high disk utilization. This can be tested by running disk benchmarks or monitoring disk activity. However, these checks are not accurate since they relate to the current moment with no history.
- Look for disk errors, it might be hard to find.
- Follow up on whether the server or the virtual machine freezes or crashes, if so, then after this event there is a possibility for disk I/O. However, it might be tiring to follow it.
- Look for connectivity issues with the virtual machine, it might be identified with packet loss. You can read more in this article about lost packets.
Recommended action :
The faulty hardware component should be replaced immediately.
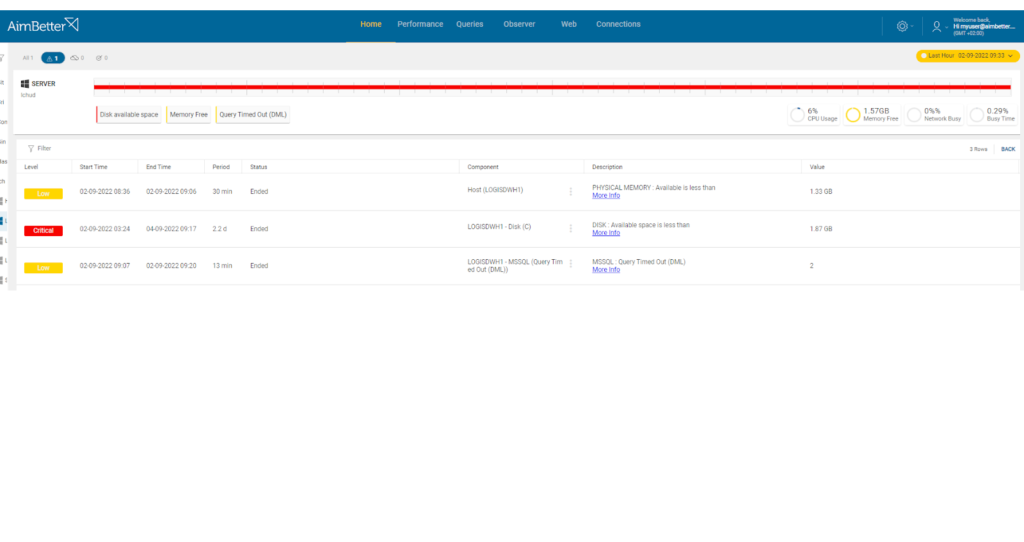
3- Running out of disk space Priority: Medium
If the program calls for output to the disk ( I/O ) and the disk is nearly full (generally the optimal threshold is below 90% of total capacity), the disk will start to slow down as it searches for free space. This will cause the program to wait for progressively longer periods.
Problem identification:
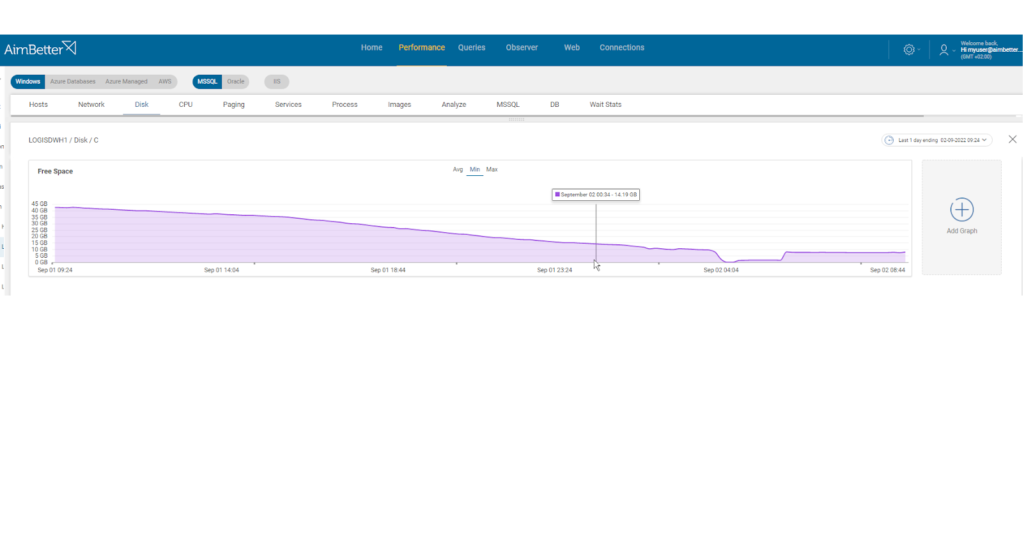
Check if the disk free space is low and run a full-scan of the disk’s content in order to locate higher data files.
- Look for the disk available space using the file explorer.
- Run a full-scan of the disk’s content in order to locate the cause of it.
- When finding the cause, try to figure out why this exact file has increased and how you can prevent it from happening again. Without proper events history, it might be hard to do.
Recommended action :
Examine the disk free-space reporting. If necessary, working with operating system reports, identify whether there is sufficient space in unnecessary files (for example, old or redundant copies of data), to delete these files and run a disk clean-up. If there is still not enough, further disk capacity must be added.)
4- SQL queries with high disk I/O Priority: Medium
When the program calls for rapid disk reads – typically when searching and analyzing random data, disk utilization will increase rapidly.
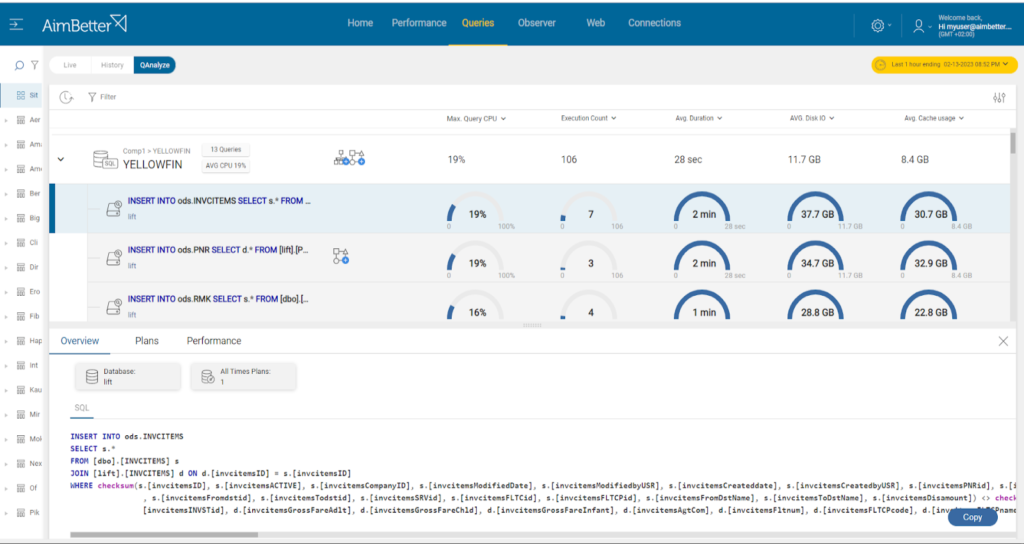
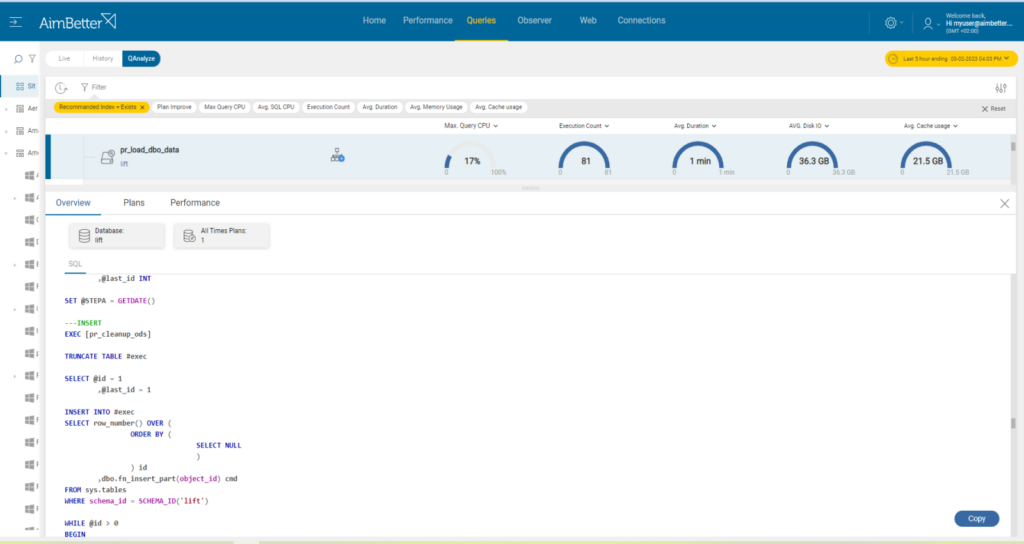
- Identify the queries that are highly consuming disk I/O by running a performance analysis. You can use SQL Server Profiler for SQL Server or AWS for Oracle. This step is complicated, might take hours (or days) of work, and you can’t guarantee precise results when checking the online status with no historical events.
- Look for a way to optimize the queries by reducing the amount of I/O utilization they retrieve or by tuning their execution plans. You should consider deleting or adding new indexes. This mission might be complicated, requiring a highly skilled DBA that can view a full SQL query plan that might be long and complicated.
- While improving the queries, you have to follow up on this issue, if the disk I/O is still high, consider doing a further investigation or looking for other ways to improve the queries.
Recommended action :
Optimize the queries’ performance. This can help reduce the disk I/O consumption of each query. You should consider changing the queries’ execution plan or removing and adding indexes.
Redesign the program to maximize the use of indexed data, redesign table structures to match the requirements of the programs by building indexes, and make use of temporary tables.
5- Missing or corrupt indexes Priority: Medium
Missing indexes will cause extensive data searching from disk, resulting in page swapping. When it happens, SQL Server or Oracle suggests that your query could run faster with a new index.
Problem identification:
Identify the missing or corrupt indexes, if they exist, while the disk I/O of the query is high.
To lower disk utilization when missing or corrupt indexes are the issue, you can take the following steps:
- Identify the missing or corrupt indexes by running a performance analysis. You can use SQL Server Profiler for SQL Server or Oracle Trace for Oracle. This step is complicated and might take hours of work, and you can’t guarantee precise results when checking online status with no historical events.
- Think about which appropriate indexes would optimize the queries. You can use the Database Engine Tuning Advisor or other tools to help identify the missing indexes. This mission might be complicated, requiring highly skilled DBA that can view a full sql query plan that might be long and complicated.
- Check the existing indexes for corruption. If any index corruption is detected, rebuild or repair the indexes.
- Monitor the disk utilization while using performance counters. You lay on current moments.
- If the disk utilization is still high, you may need to further investigate the issue. This task might be hard.
Recommended action :
Implement new indexes and delete corrupted indexes. One possible remedy in cases where the corruption is repeating is to clone the database onto a new hardware configuration.
See our explanation for missing/corrupt indexes here.


