Azure Max Worker measures the total task load performed by the cloud instance. The impact of the SQL instance’s workload is shown in percentage. This value is part of the Azure DTU metrics and is provided for Azure Database and Azure Managed Instance monitoring.
Azure service enables the choice of the number of worker threads available for database queries, which is set according to the specific pricing for each package. Once you reach the limit of the available threads or close to it, the system will face slowness and degradation in performance. Specifically for this environment, queries won’t be killed or timed out but will enter standby mode while waiting for resources. Once an alert about Azure Max Worker is received, you should choose whether to solve the slowness or update to a package with more resources.
Find out how you can save hours of work when investigating the root cause of this issue.
Symptoms :
Slowness in performance. Routine operations are performing less well, and users complain about slowness. Processes stand by, waiting for their operation to be completed.
Impact: High
When the Azure Max Worker value is high, and there is a high volume of incoming requests, a bottleneck may occur, affecting the performance of the database instance and related applications. Queries will probably wait for enough resources to be available for their performance.
Expected behavior :
For optimal performance, we recommend that the Azure Max Worker should be less than 70%. However, this guideline may be different based on business demand.
Possible causes of high Azure Max Worker:
1- High Workload Demand. Priority: High
Higher traffic might cause a higher Azure max worker value. This might be a temporary spike or a long-term high utilization, and you should analyze which of these scenarios is your case.
Increased user traffic, processing requirements, or data processing demands that are too intense for current system resources might result in a higher max worker value. This might be temporary or long-term. If it’s a long-term situation, you will have to choose whether to upgrade current resources or terminate what is possible.
Problem identification:
Identify patterns of increased Azure activity related to database activity. You should track more queries running than usual involved with a higher user connection count.
- Monitor the incoming request rates or workload throughput for your Azure services. Check if the number of queries or database connections has increased (compared to past connections). Review historical performance data and workload patterns to identify recurring events.
- Check for errors or increased response latency, which can be indicators of high workload demand exceeding the capacity of current settings.
- Check Azure Log Analytics in order to track unusual database activity, which might indicate increased activity.
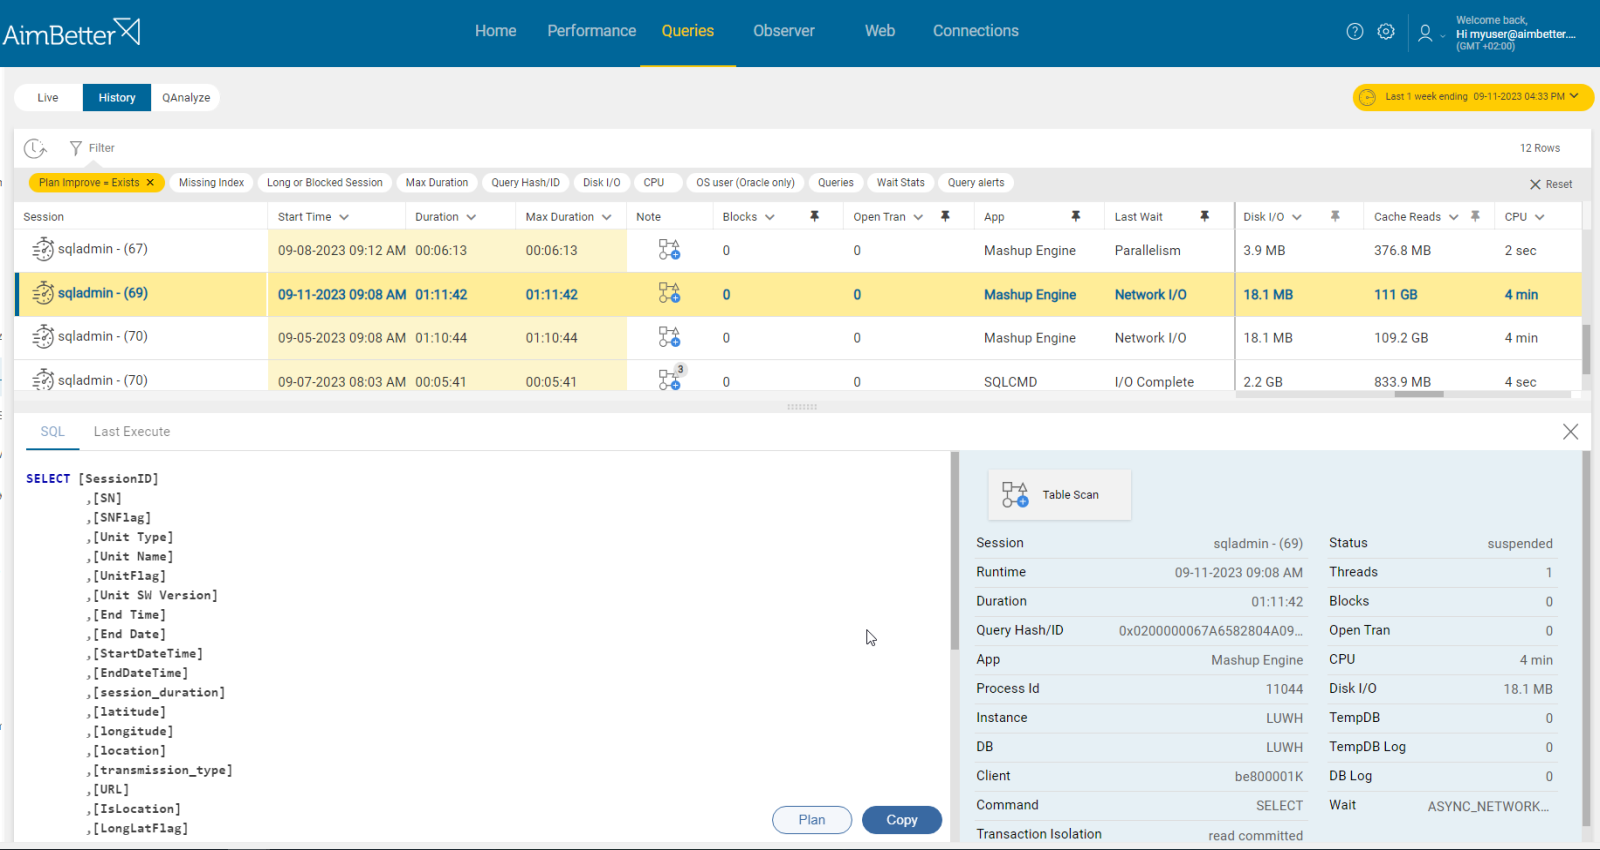
- Try using DMVs to identify queries that seem to be new ones, increasing the database engine’s total activity. Out of these, you should identify which queries caused the Azure max worker percentage to be higher.
- Define threshold values for workload indicators and configure alerts or alarms to notify you when thresholds are exceeded.
Recommended action :
In some cases, terminating unnecessary tasks will be enough. Before doing so, you should prioritize tasks again and delay those that are not urgent to lower activity times.
Ensure that you are not opening more connections than necessary.
2- Queries are inefficient. Priority: Medium
Inefficient queries often require more computational resources. It can increase the overall processing time for requests, leading to longer response times.
This might happen because these queries are too complex, missing indexes, have inefficient execution plans, or have inefficient code. This can include missing or outdated statistics, inappropriate use of joins or subqueries, unnecessary sorting or grouping, or inefficient use of functions.
Execution plans provide valuable insights into how the queries are being processed and help identify areas of inefficiency.
Problem identification:
Identify which queries are running long and whether there is increased high Azure Worker usage. Check indexing and query execution plan.
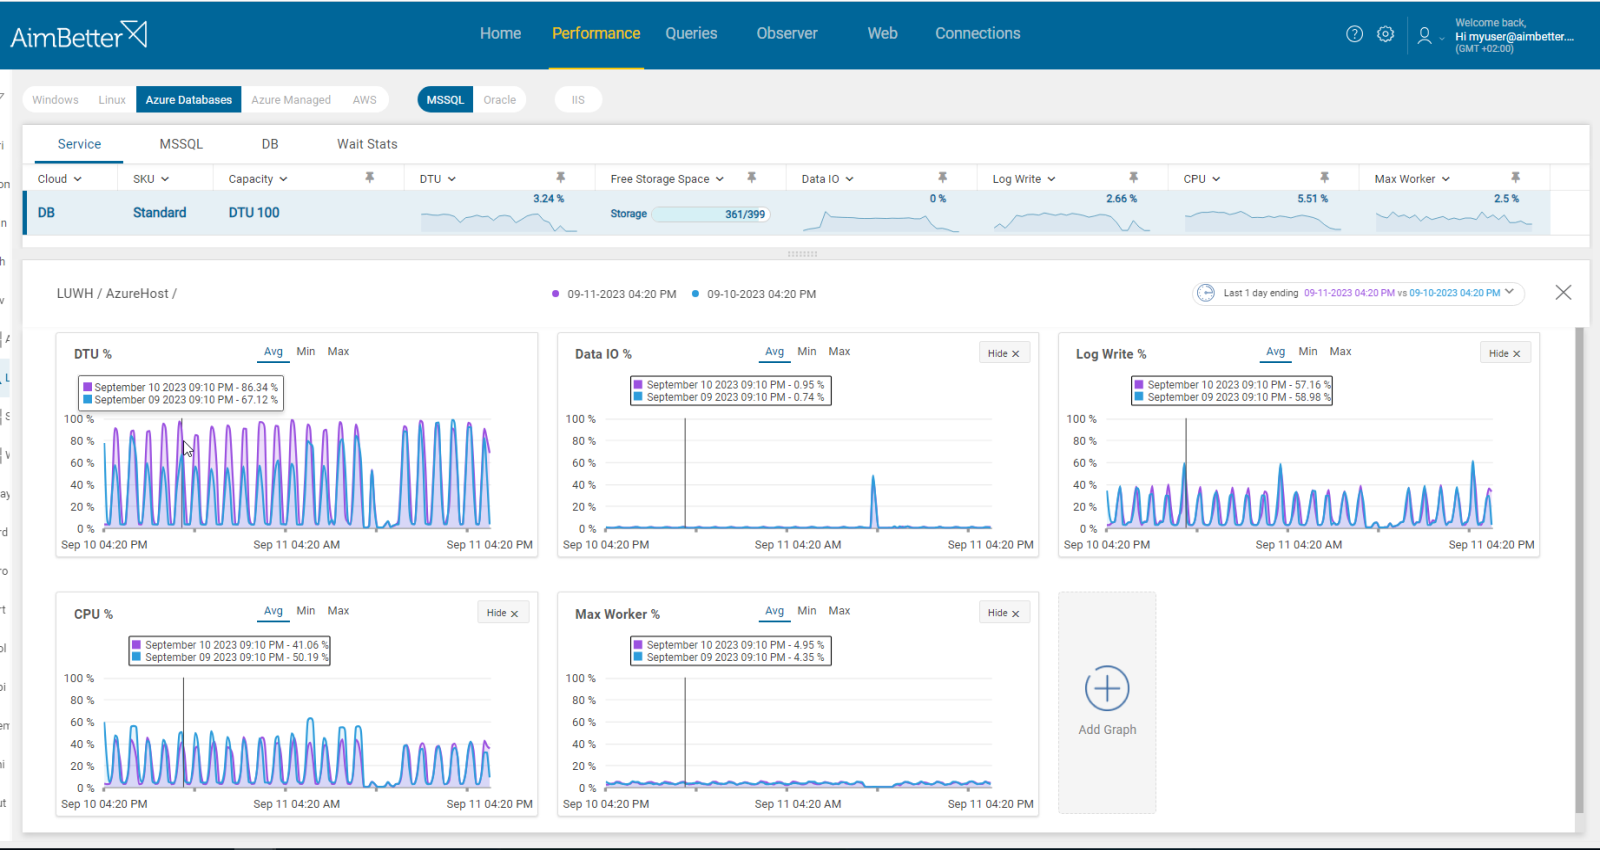
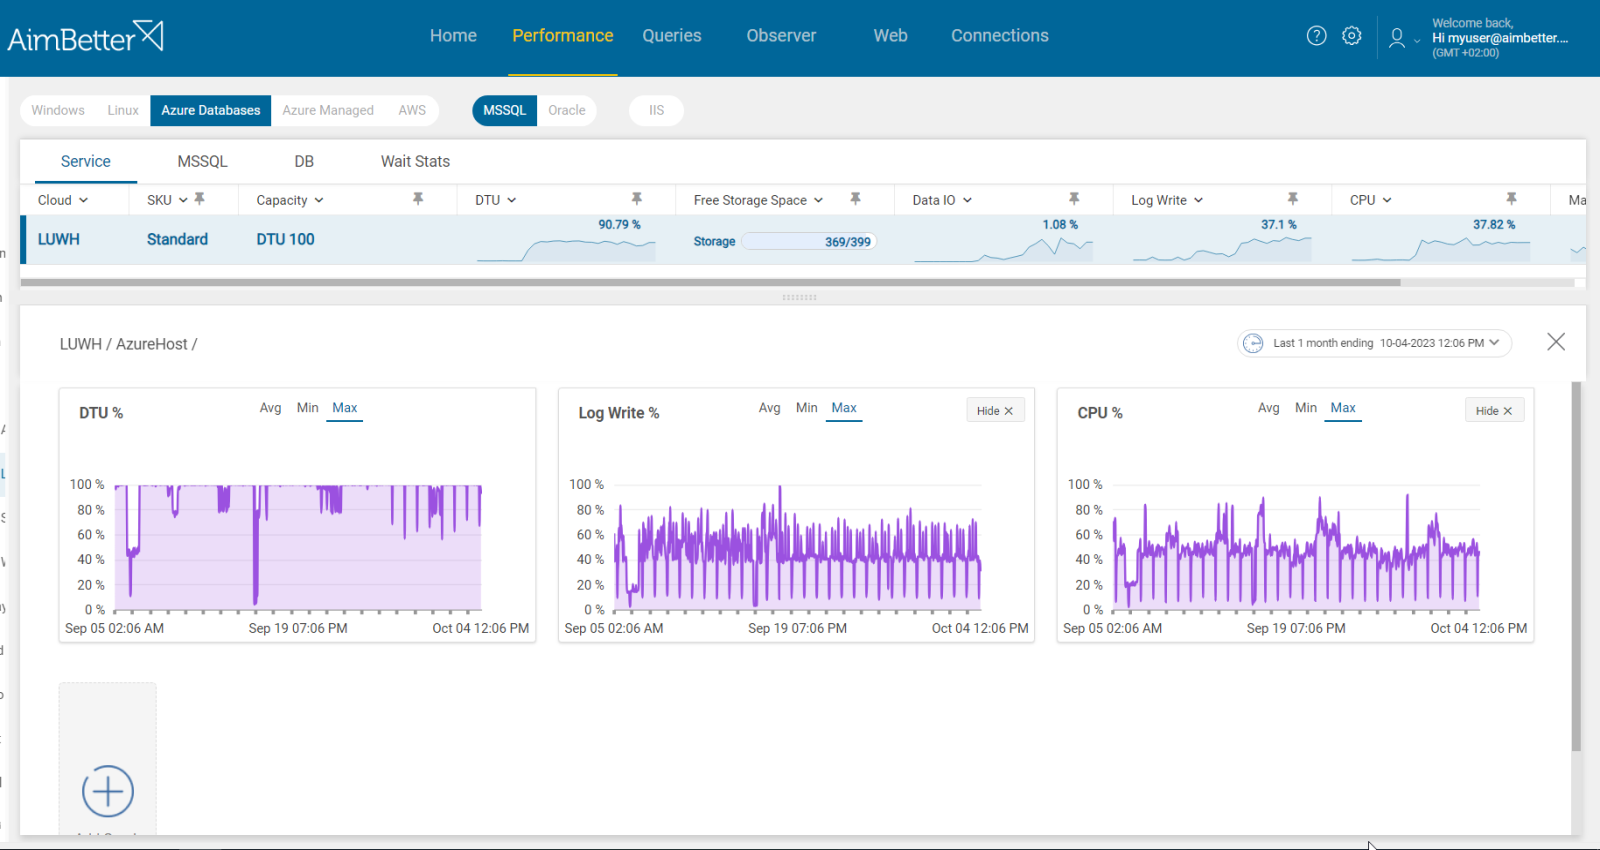
- Use Azure monitoring tools such as Azure Monitor to track resource utilization metrics. Look for periods of high Azure Max Worker usage. You should also look for which resource is specifically highly utilized: CPU, Data I/O, or Log Writes I/O, so you know that the problem is related to Azure Max Worker and what to track when looking for problematic queries.
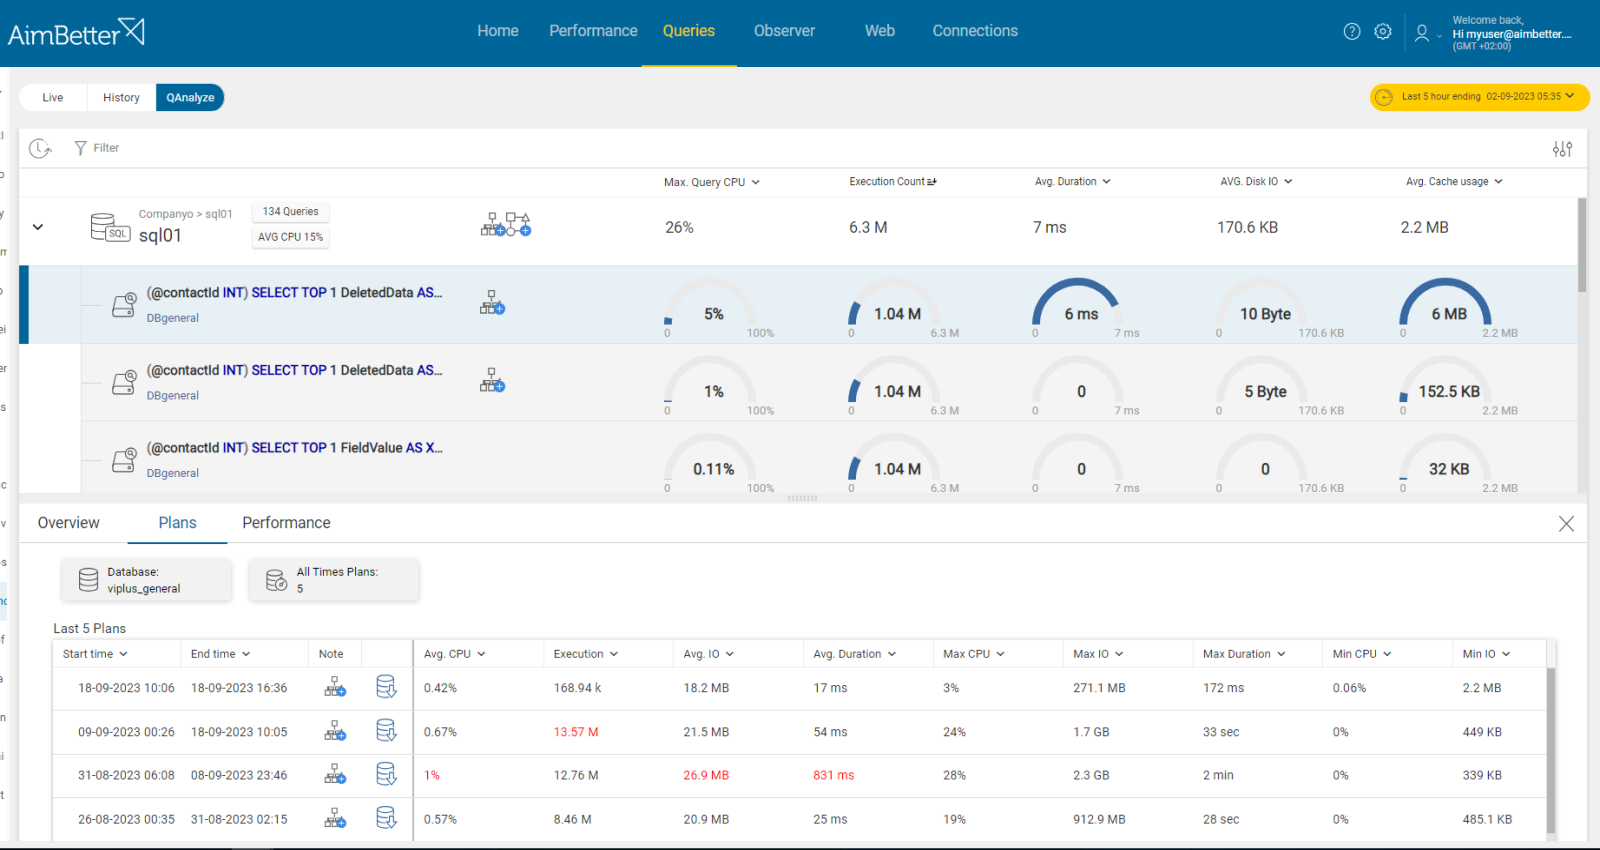
- Use Azure’s Query Performance Insights tool to analyze queries and their performance.
- Another option is using DMVs, which will help hint about queries that utilize resources.
- Out of these queries- you need to identify those that run at the same time as the Azure Max Worker usage gets higher and which queries have complex query code.
- You have to use other programs, such as SSMS, to view and analyze the execution plan. Try investigating it and looking for complex operations.
Recommended action :
Try optimizing queries according to the exact cause of their complexity. Before making these changes, consult a DBA who understands the data model.
-Make sure you are using proper indexes; add or delete indexes if possible and needed.
-Break complex queries into more simple steps.
-Investigate the query’s execution plan and look for heavy tasks and loads of data.
-Review your application code for inefficiencies.
-Make sure to track any changes done by using proper monitoring.
If you have concluded that queries seem simple or that all tasks are highly prioritized, proceed to the third cause. You should decide if upgrading the current package of Azure resources available to your database environment is the only solution.
3- The current package does not fit system demands. Priority: Low
After checking that the cause does not seem to be query complexity or higher activity, if your Azure is experiencing mostly full utilization of Azure Max Worker, you should consider upgrading as the appropriate choice.
Problem identification:
Identify routine performance involved with the utilization of high Azure Worker constantly.
- Monitor the incoming request rates that affect Azure’s workload. Analyze whether the activity seems routine or new.
- Check Azure Log Analytics in order to track unusual database activity which might indicate increased activity.
- Take into account that Azure doesn’t automatically recommend or alert you to upgrade your Azure service tier. However, you might use the Azure Advisor service to get best practice recommendations that can hint you about this issue.
Recommended action :
Regularly monitor your database performance using Azure Monitor.
Before upgrading your Azure Max Worker package, a costly solution, you should carefully consider performance requirements—maybe lowering the work demand or dividing it differently would help.
Else, you can implement Azure Autoscale. It can automatically scale your resources in or out based on defined rules.


