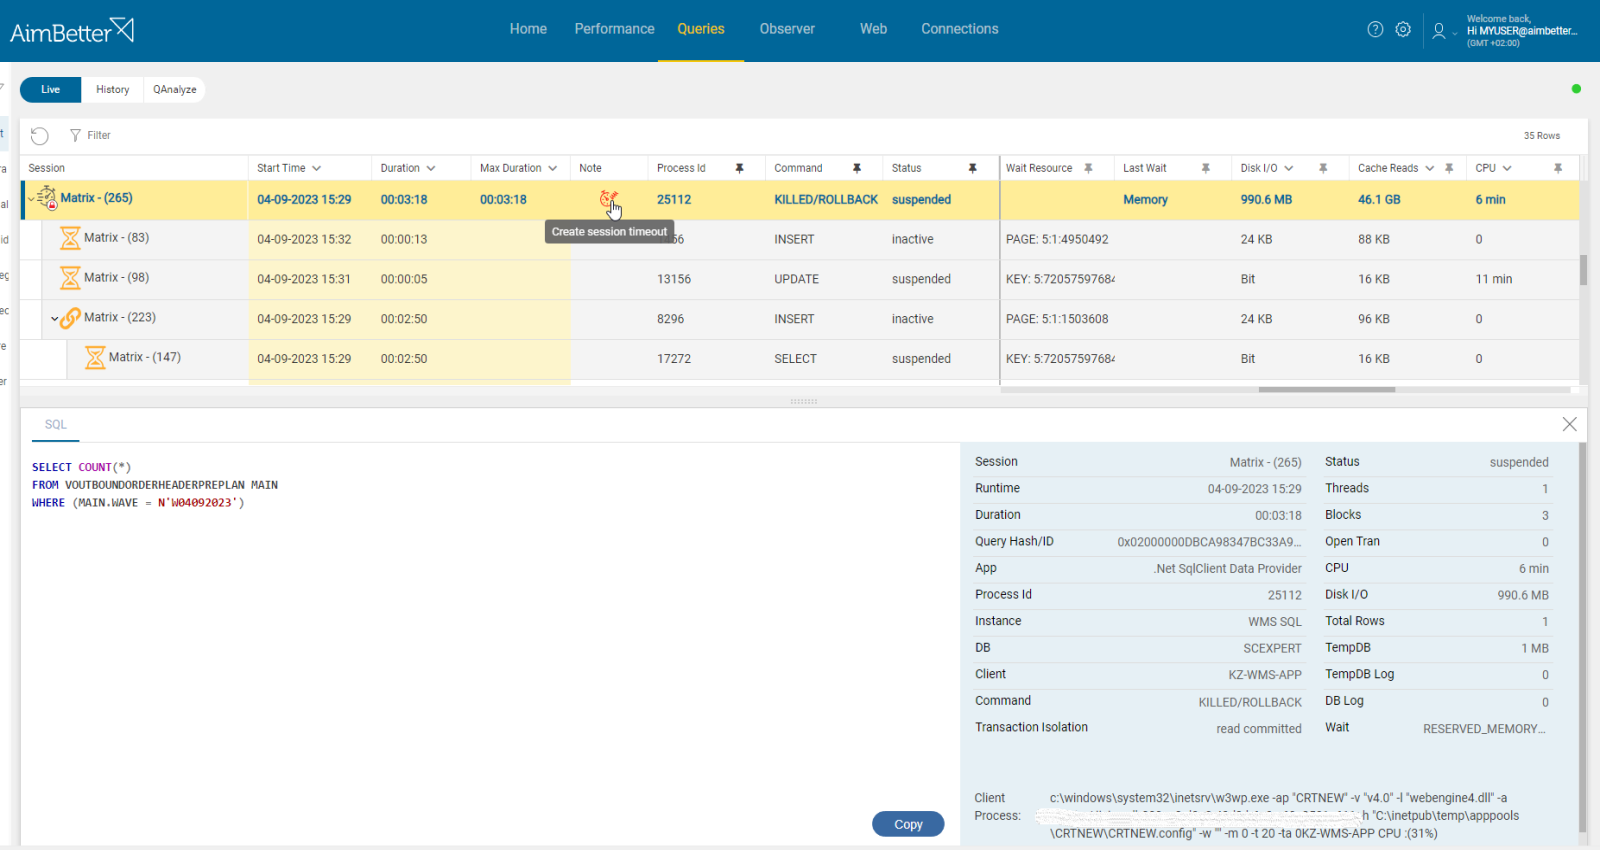
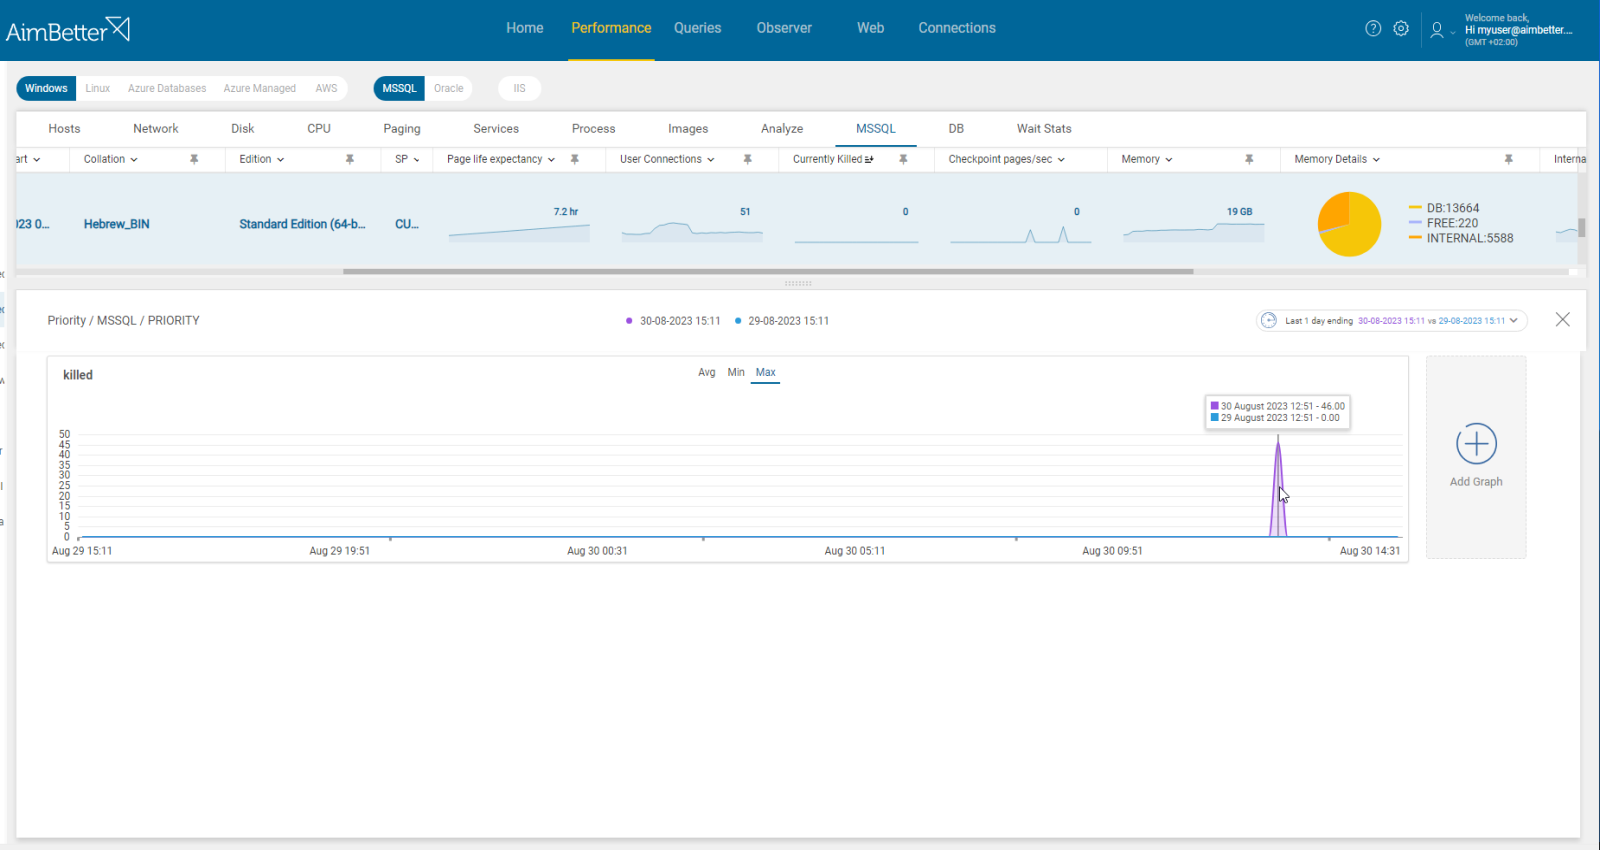
AimBetter tracks the number of queries that have been terminated by a ‘KILL’ command.
The ‘KILL’ command is associated with a specified session ID and is commonly used to end a process that locks other important processes. It can also stop a process that executes a query consuming needed system resources.
The ‘KILL’ may come from an application executing code when an abnormal condition has been found, and the query cannot be completed. If the code is set to handle errors (via the TRY—CATCH—THROW logic), the query can be terminated directly. It may also come via direct action from a user or due to a query timeout.
The ‘KILL’ process normally involves rolling back the transaction so that all data changed by uncompleted transactions is returned to the state it was in before the transaction started. All the uncommitted changes made are going to be undone. In most cases, the rollback process happens very quickly and does not have a major impact. In cases where there are a large number of uncompleted transactions, the rollback process can take some time and have a major impact on the performance of the database during that time.
‘KILL’ also ends a normal connection, which internally stops the transactions that are associated with the specified session ID.
Note that the SQL’ KILL’ command cannot kill System processes or processes running from an extended stored procedure.
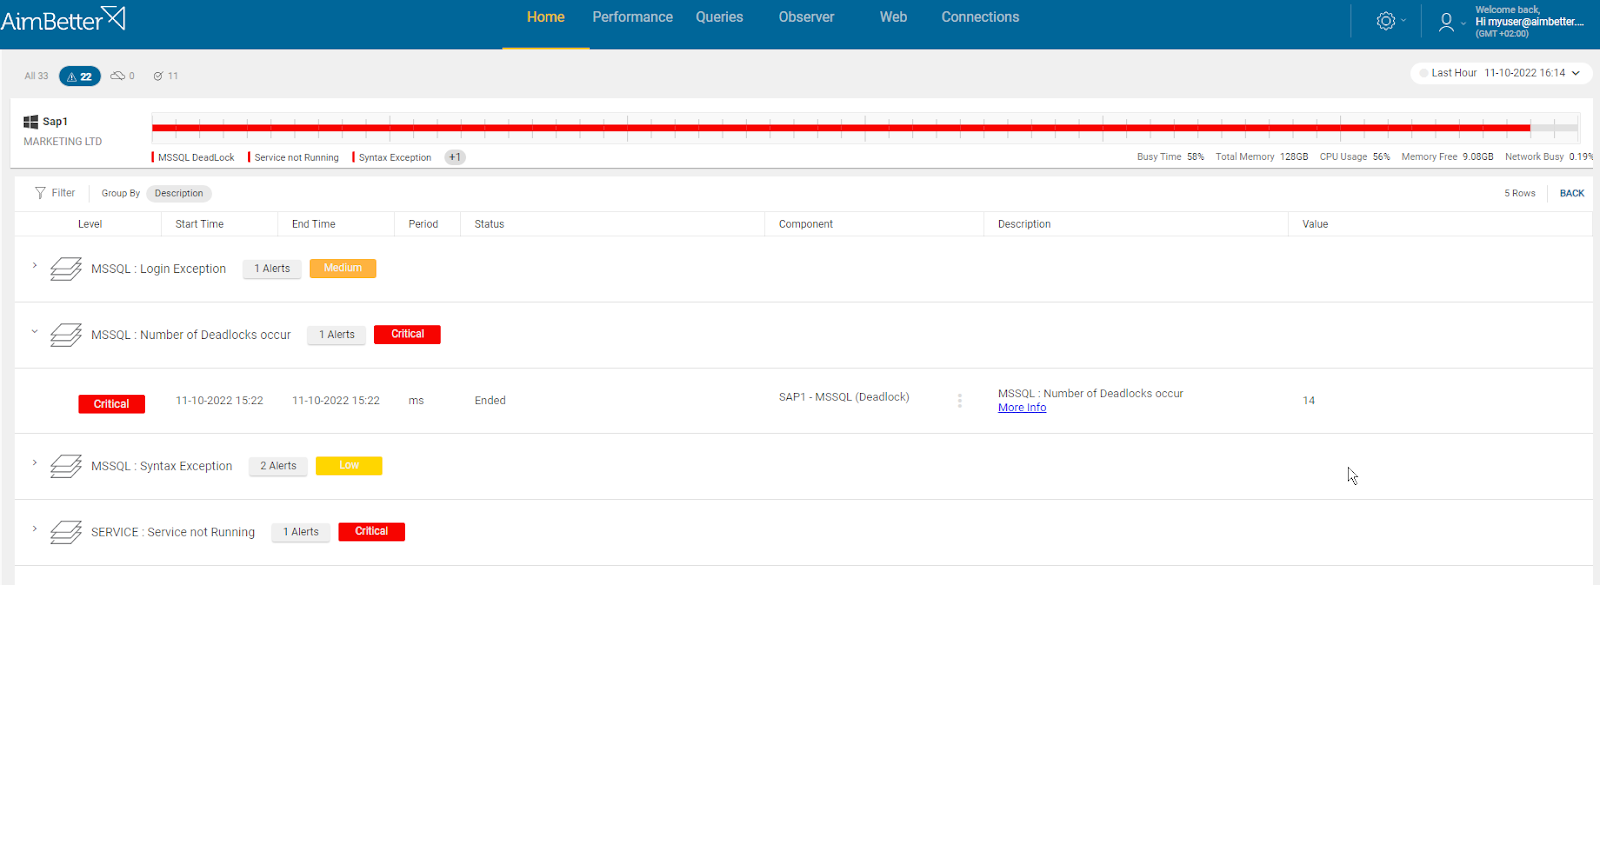
Symptoms
- Users might get error messages about a query timeout or a deadlock.
- Execution of processes is stopped suddenly before completing or providing results in output.
Impact:
Processes won’t provide the required results if they are terminated during execution.
Expected behavior
There is no standard level for kills, but in general, spikes or exceptional numbers may indicate that an investigation is required.
Find out how you can save hours of work when investigating the root cause of this issue.
Possible causes
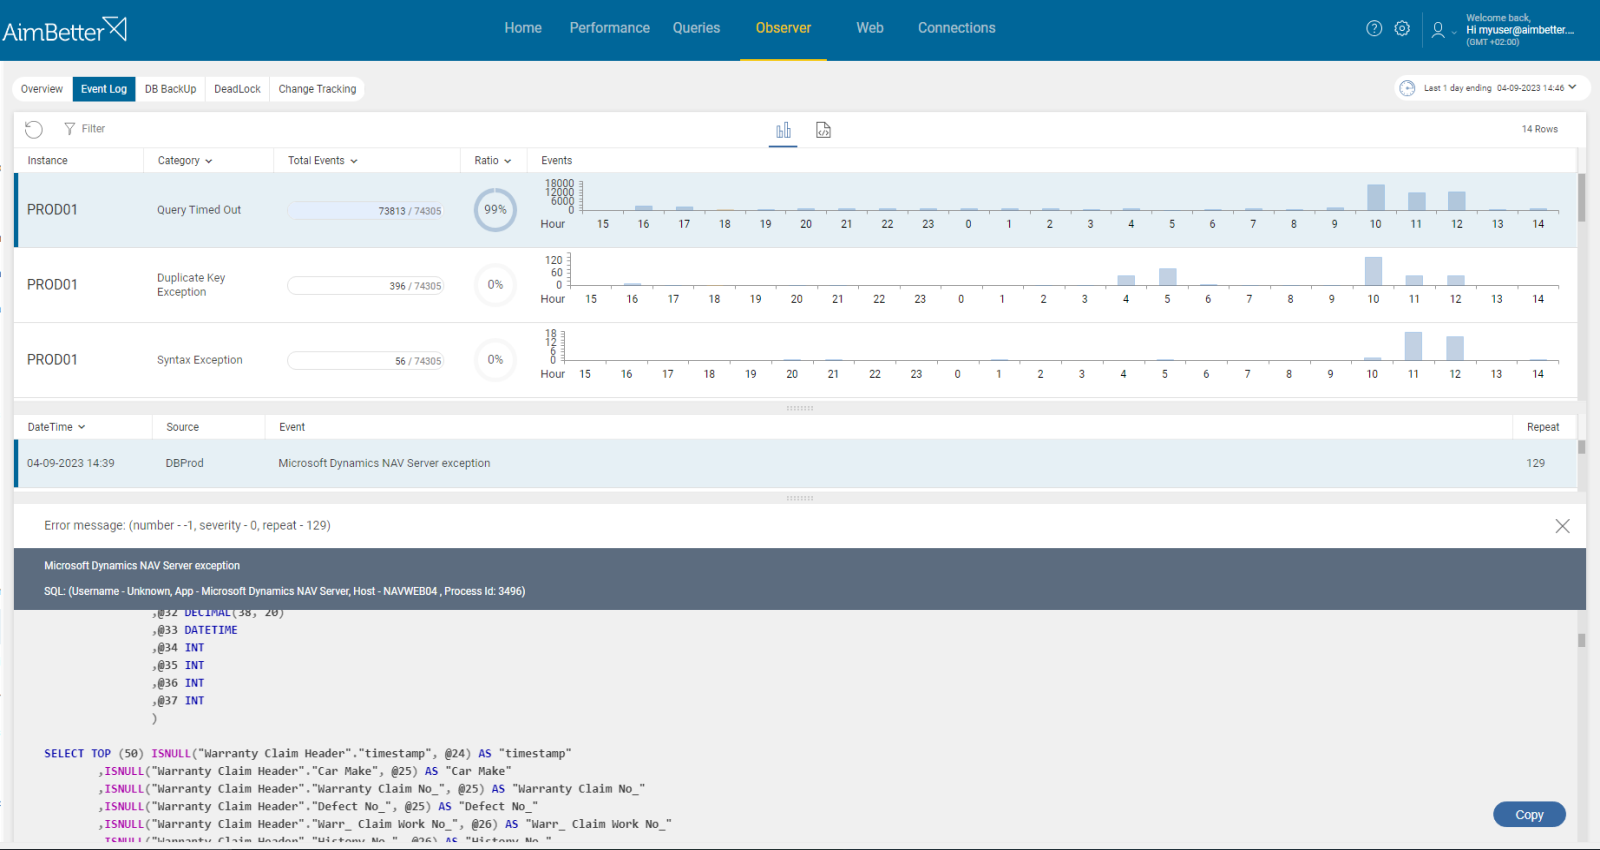
1- A Query timeout. Priority: Medium
A ‘query timeout’ value is set before any query runs. SQL Server estimates how much memory it needs to run this query and tries to allocate this amount of memory based on available system resources. If the allocation is enough, the query is executed immediately, and the timeout value is set. If there is not enough memory readily available from the buffer pool, the query is put into the ‘runnable’ queue, waiting for its turn to execute when resources become available. It is set with a timeout value calculation based on the estimated query cost.
If the waiting time of this query (see more about waits here) exceeds the estimated timeout value, a timeout error is thrown, and the query is removed from the queue and killed.
This “kill” action is done in order to prevent it from consuming excessive resources and affecting overall server performance.
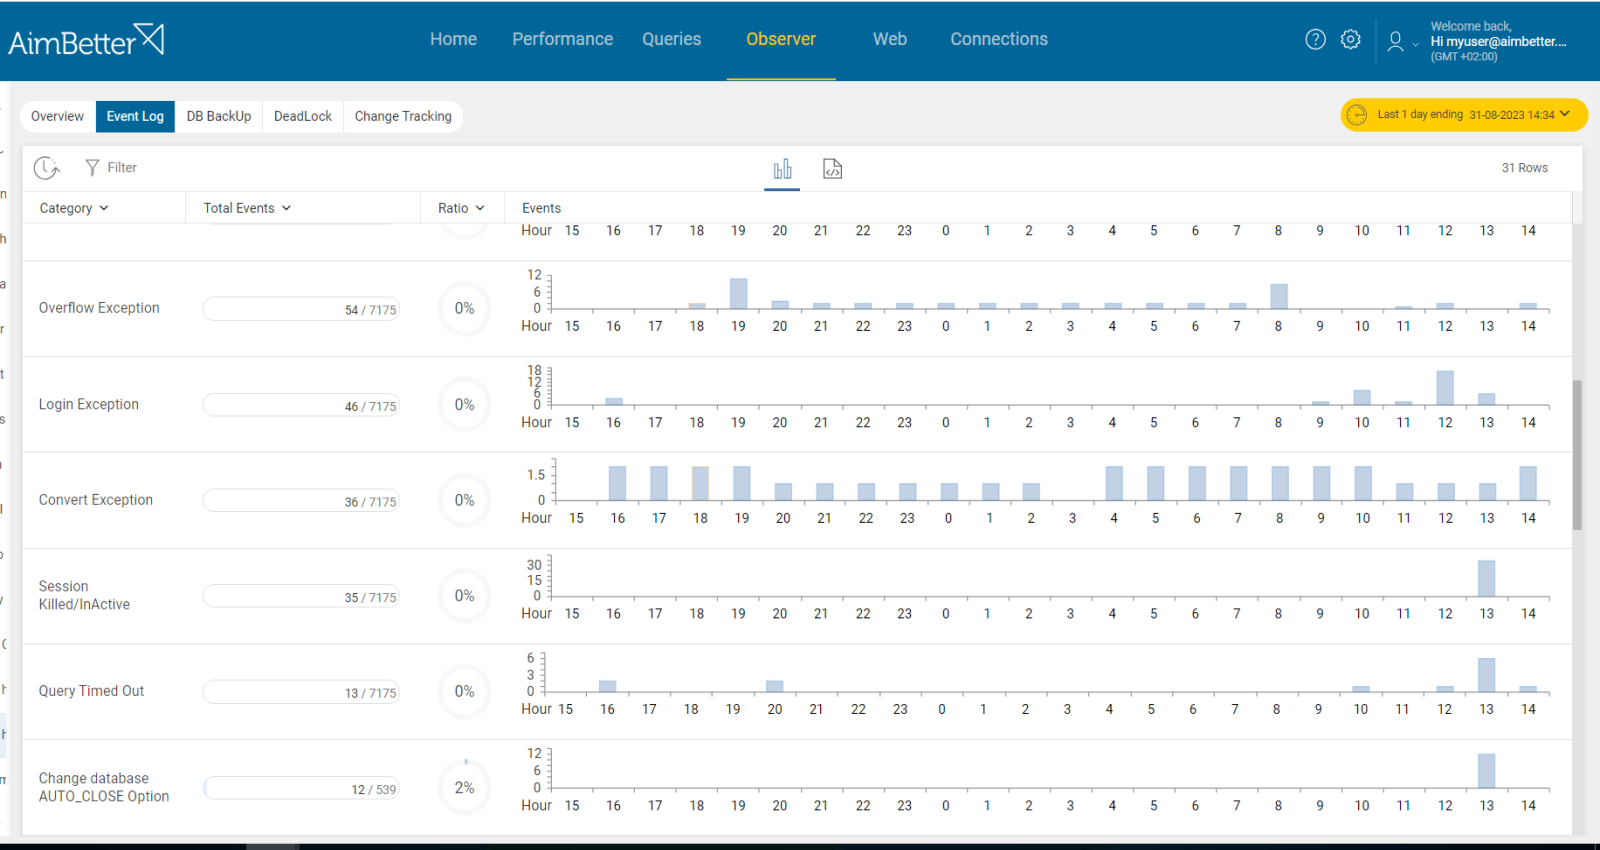
Problem identification:
Once you identify a timeout, try to check if it’s related to a terminated query. Look for long-running queries and overload on performance metrics.
- Use tracking tools to identify long-running queries facing a timeout. You can use SQL Server Profiler for SQL Server. For Azure or AWS, use the Query Performance Insight tool. Take into account that tracking starts only when you activate it, so you don’t have historical events to compare with.
- Other possible options: For SQL Server, you can set extended events to follow over time-out events. Otherwise, you can use DMVs (Dynamic Management Views) to collect more details about queries. For Azure, you can use system views. You can also utilize them to identify which queries were killed.
- Review the database engine logs, if possible, in order to collect more data.
- Analyze the queries and find out how to prevent time out from happening again.
Recommended action :
When a query is killed due to a timeout, it means that it was too long in the queue. This behavior ensures that long-running or problematic queries do not consume excessive resources and impact overall database performance.
However, if the query should be executed then the best solution is to improve its execution plan- based on indexes, code improvement and changing current plan logic.
2- Conflicts between operations: Deadlocks. Priority: High
Deadlock occurs when two or more processes are unable to proceed because each is waiting for the other to release a resource they need.
When conflicting operations impede the progress of a query’s process, it may result in the query being terminated as it becomes the chosen victim of the deadlock.
Problem identification:
Identify deadlock events and track the involved queries.
- Use tracking tools in order to capture deadlocks. For SQL Server, you can use SQL Server Profiler; for Azure, you can use the Azure portal or extended events; for AWS, use the RDS performance insights tool. When doing it, take into account that dealing with a past deadlock isn’t possible – it will either have to be re-created, or you will have to wait for the next occurrence. In addition, SQL Server logs information about deadlocks to the error log, and you should try to check it also.
- Look at SQL Server Error logs, which might contain information about killed queries and their reasons. Otherwise, you can use system views or DMVs (Dynamic Management Views) to collect data about recently executed queries and terminated ones. This task might be tiring and take time.
- Out of the deadlocks’ victims, by investigating the query code, try to see if that’s the query you were trying to track and collect information about.
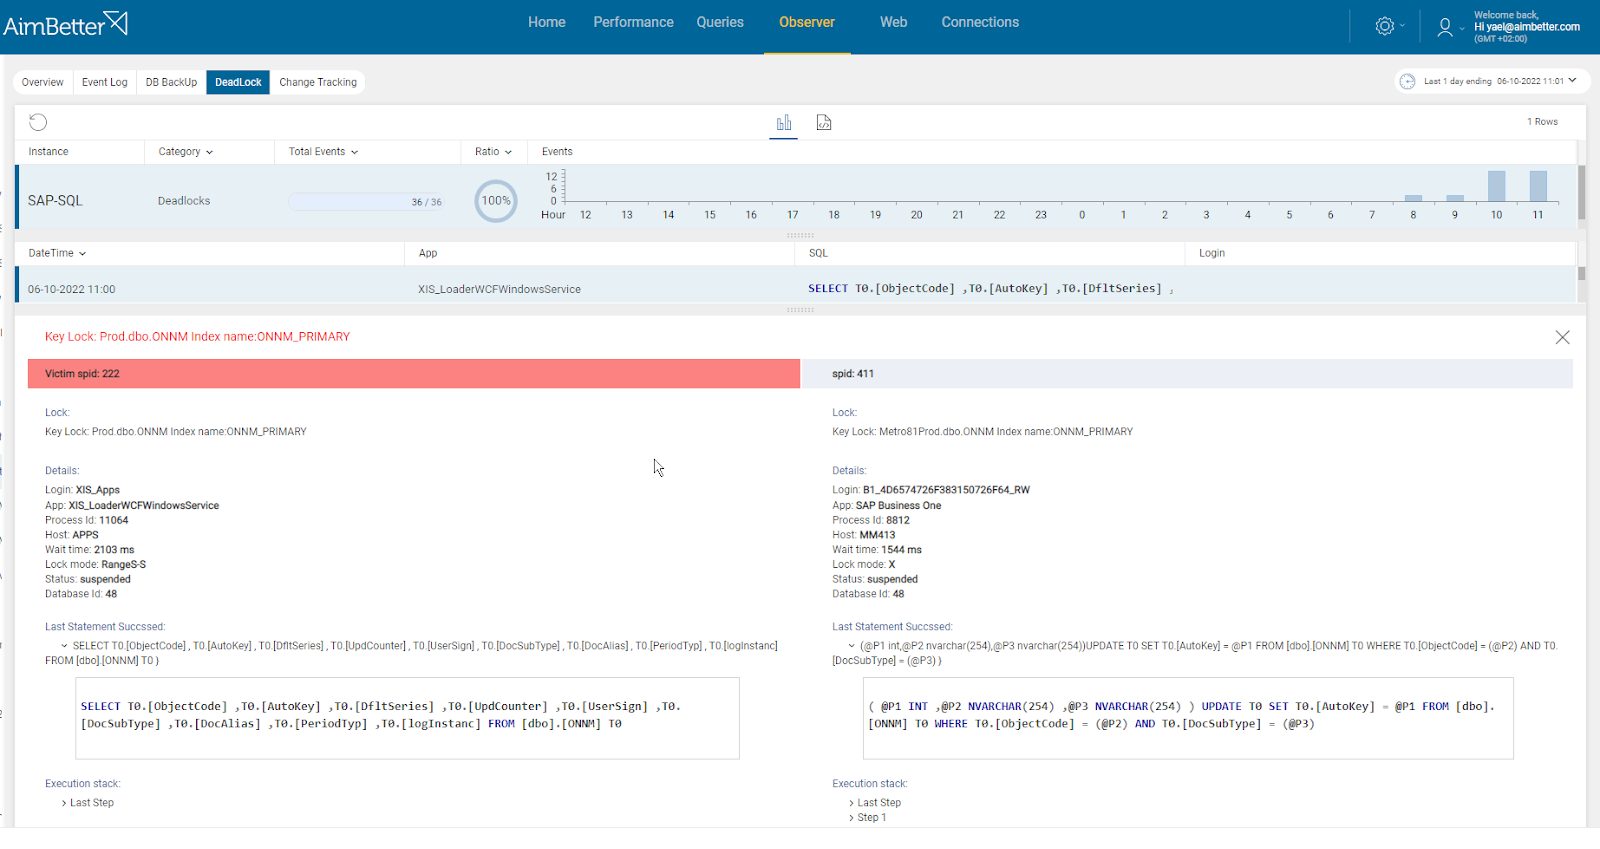
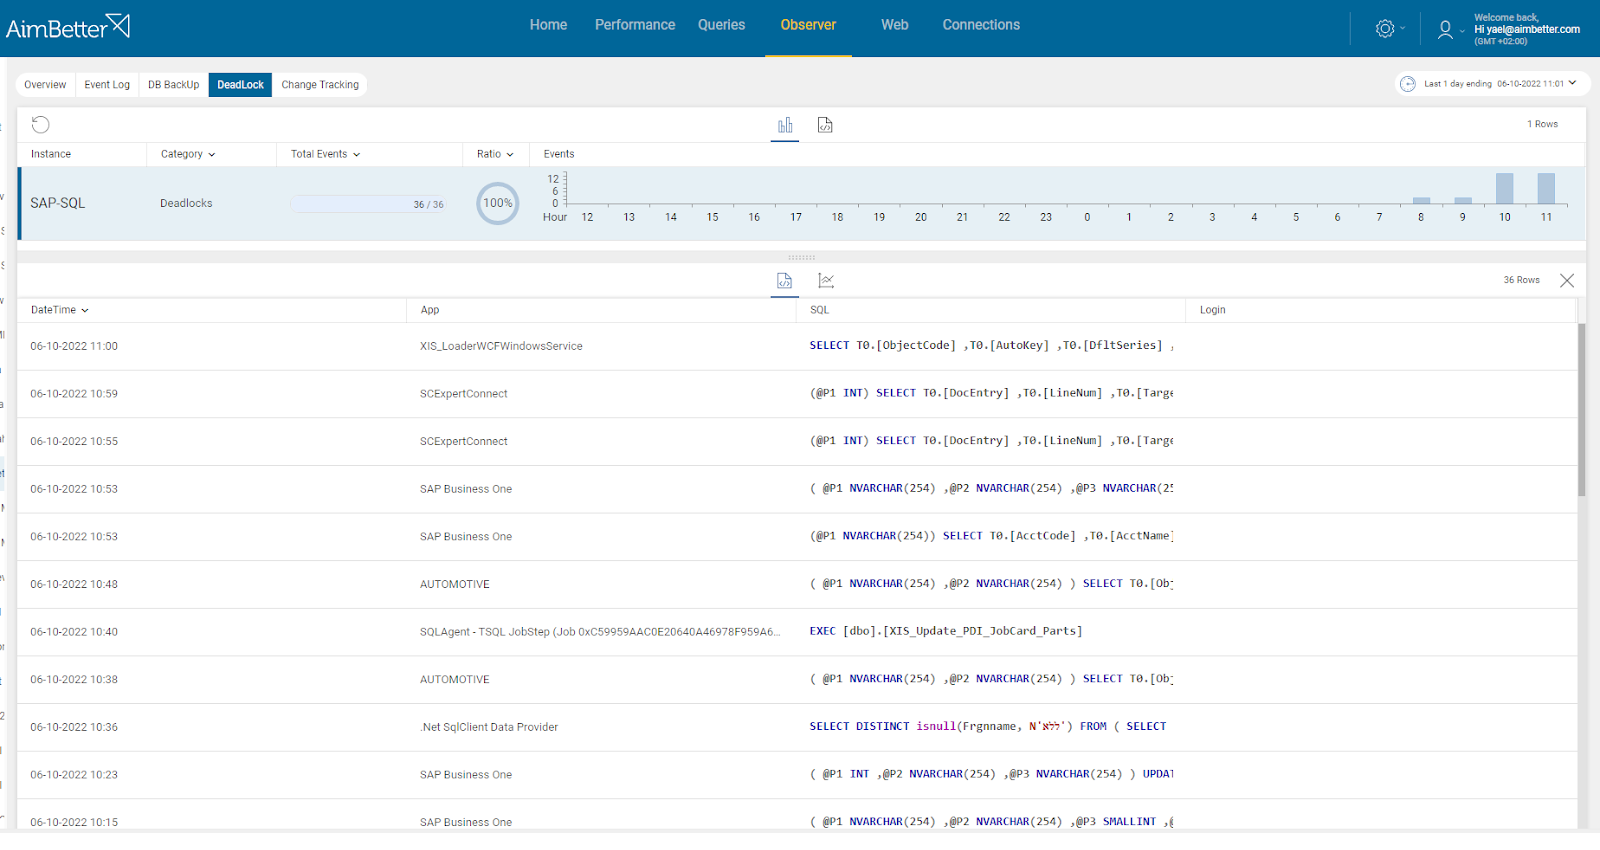
With AimBetter, you can drill down into any transactions involved in a deadlock, the query’s running time, and full details while identifying the killed and the surviving one. You will know which ones were killed because you receive an alert about that.
You can also view deadlocks that have occurred in the recent past without having to reproduce the issue since all deadlocks are logged and stored in the AimBetter cloud for up to 30 days.
Recommended action :
Identify the source of the query and try to achieve faster execution. Track for a possible CPU load before the deadlock occurs or because of it. If the event is recurrent, try to reschedule the lower prioritized query to a time of low user demand.
3-User action. Priority: Medium
Users might manually stop a query’s execution that’s running longer than expected or prevent it from running if there are concerns about its impact on the system.
It can be done to prevent the query from consuming excessive CPU, memory, or disk I/O resources that might harm the overall performance of the server. Another scenario is when there are blocking chains, and the administrator decides to kill part of the blocking queries in order to release the blocked ones.
Problem identification:
When identifying that the query was canceled, look for messages mentioning that it’s a user’s intervention and not something else.
- Look at SQL Server Error logs for information about killed queries and the reason for that. Otherwise, you can use system views or DMVs (Dynamic Management Views) to collect data about recently executed queries and terminated ones. This might be a time-consuming task.
- Start using extended events to capture query cancellation events. Else, you can create a trace by using SQL Server Profiler, for SQL Server. For Azure, you can use the Azure Portal or Extended Events; for AWS, use the RDS performance insights tool. Take into account that this won’t provide information about the case you are investigating currently, but only future ones.
- Some application logs might restore data related to user actions, including queries that were killed.
- Check audit logs to track user activity records of interactions related to the query’s termination.

Recommended action :
Confirm the need for the intervention by the user who stopped the query and consider further actions accordingly.


