Each query runs in a thread. A thread that is actively working runs until it needs to wait for a resource (or has consumed the allowed quantum of CPU time). It then is moved to a list of suspended threads. If the resource that a suspended thread was waiting for becomes available (or a CPU quantum becomes available), it becomes runnable and is put on the bottom of the runnable queue. The runnable thread at the top of the queue resumes running whenever a running thread is suspended.
For many reasons, query execution threads may have to wait. In normal operations, waits are quite routine and do not indicate any problem. Attention is needed if there is a substantial increase in average wait times suddenly.
Waits always occur in the way the scheduling system works to optimize execution. SQL Server keeps track of the time that elapses between leaving and resuming a running state. This is called the wait time. The time spent on the runnable queue is called the signal wait time and is a measure of how long the thread needed to wait for the CPU after the required resource became available. The resource wait time – called the suspended wait time – is calculated by subtracting the signal wait time from the overall wait time. The values of these metrics are important gauges of performance.
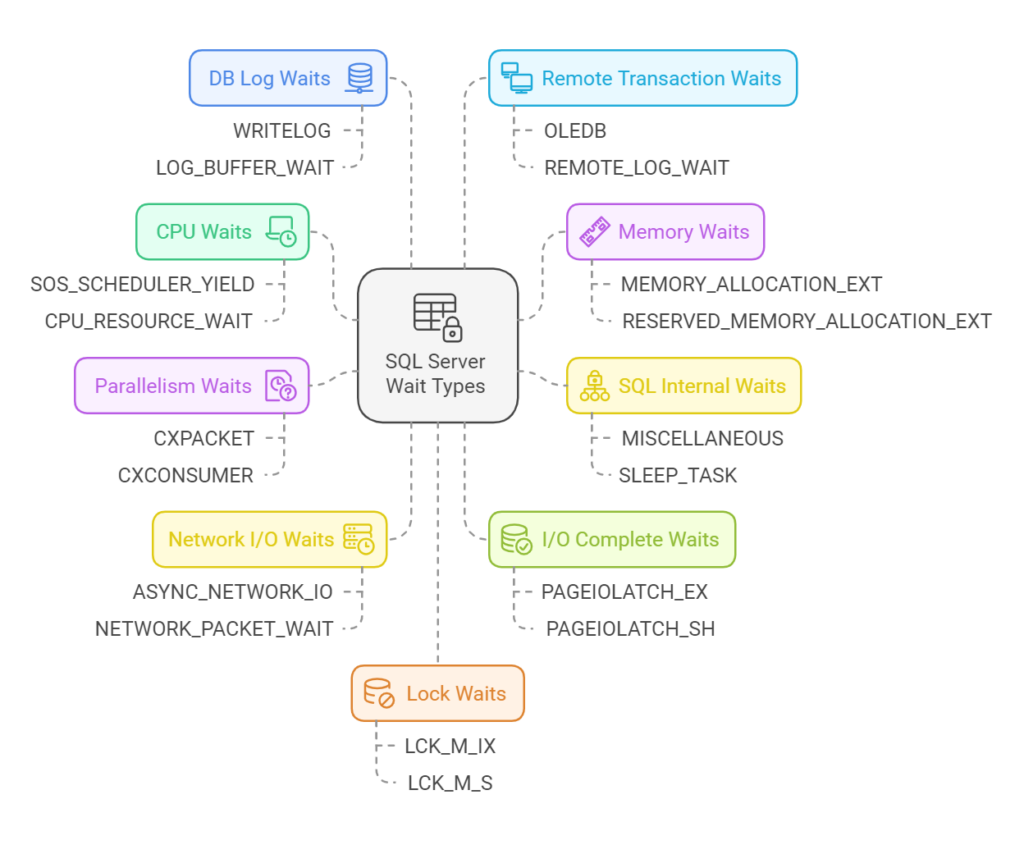
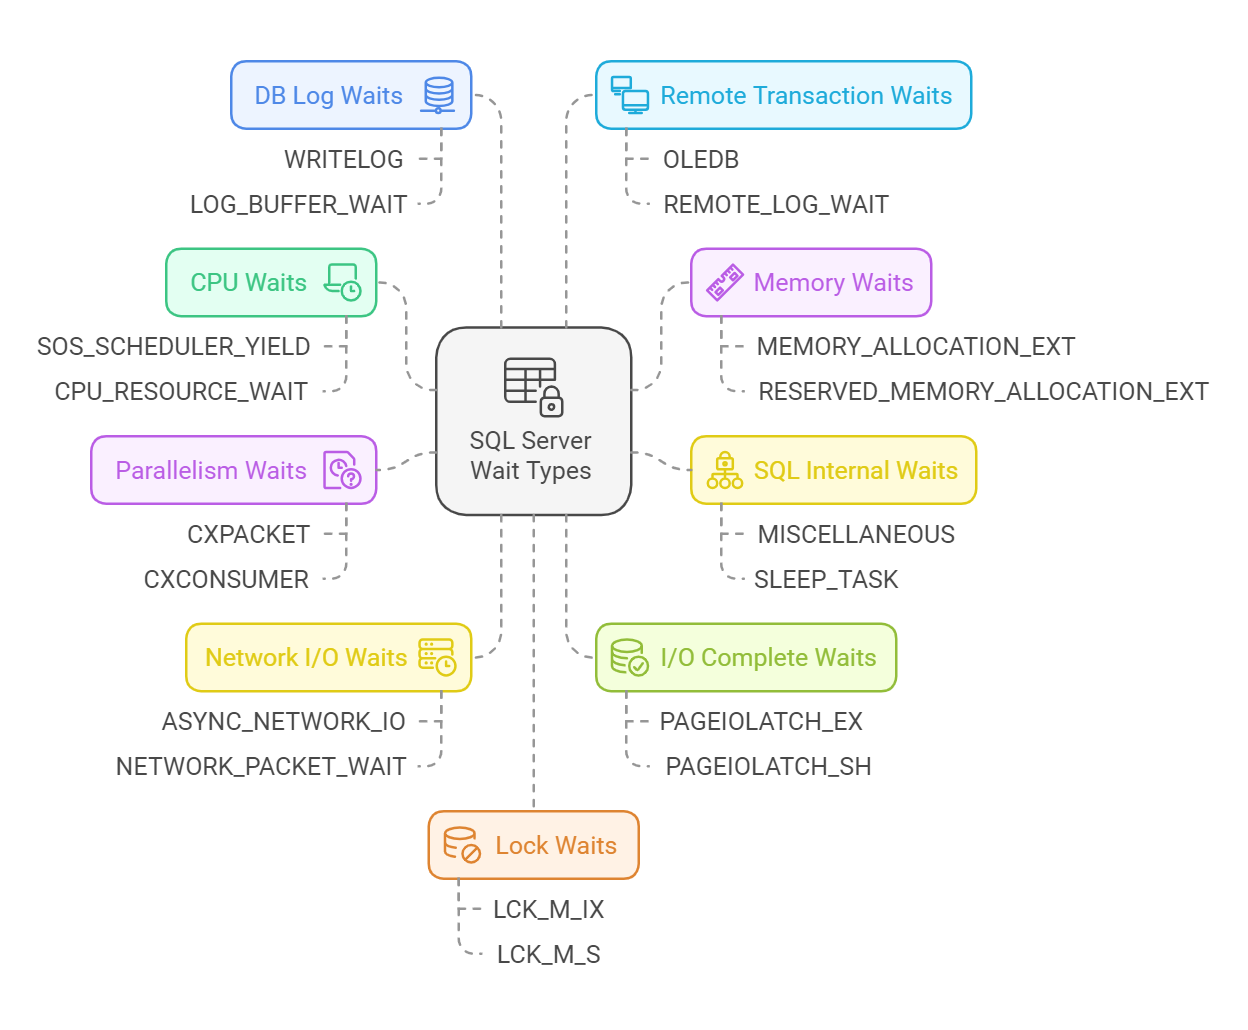
Following are Wait Stats categories ordered by their average frequency.
CPU – Waits related to a situation where a query or process waits for CPU resources to become available. It is our customers’ most frequent wait type – around 34% of cases.
Common CPU-related wait types in SQL Server include:
- SOS_SCHEDULER_YIELD: It happens when a task voluntarily gives up the CPU because it has completed its time slice and is waiting for its next opportunity to execute.
Memory – Waits involving memory allocation or resource semaphore management. It is our customers’ second most frequent wait source – around 22% of cases.
Common Memory-related wait types in SQL Server include:
- MEMORY_ALLOCATION_EXT: This happens when the SQL Server waits for a free memory page to be allocated. This can be indicative of memory pressure or fragmentation.
- RESERVED_MEMORY_ALLOCATION_EXT: This wait occurs when the server is waiting to allocate memory from the extended memory pool, often due to memory pressure or insufficient memory resources available for query execution.
- RESOURCE_SEMAPHORE: This wait type appears when SQL Server waits for a query to get resources to execute.
SQL Internal – Internal system waits used by SQL Server for background or maintenance tasks. It is our customers’ third most frequent wait source – around 13% of cases.
Common SQL Internal wait types include:
- MISCELLANEOUS: a catch-all category for various internal waits that don’t fall into specific wait types, often related to operations like background tasks or maintenance activities.
- SLEEP_TASK: Occurs when a task is waiting for a scheduled operation or a delayed task to complete, typically due to internal operations like resource contention, background maintenance tasks, or the need for a thread to pause before continuing execution.
Parallelism – Waits caused by query parallelism, where multiple threads synchronize tasks. It happens in around 10% of cases among our customers, being the third most frequent wait source.
Common Parallelism wait types include:
- CXPACKET: Occurs when parallel query execution is used, and the query waits for other parallel threads to finish processing.
- CXCONSUMER: Occurs when a session waits for a parallel query execution consumer thread to complete. It is often seen in systems with high parallelism or complex queries.
Network I/O – Waits involving network communication for sending/receiving data. It is our customers’ fourth most frequent wait source – around 8% of cases.
Common Network I/O wait types include:
- ASYNC_NETWORK_IO: Occurs when a query waits for data to be asynchronously transferred between the SQL Server and the client application, typically due to slow client processing or network-related delays.
I/O Complete – Waits related to disk I/O operations caused by disk bottlenecks or slow storage subsystems. It happens in around 4% of cases among our customers.
Common I/O Complete wait types include:
- PAGEIOLATCH_EX: This happens when a query or process waits for a page to be read into memory from disk. Specifically, the EX part refers to an exclusive latch, meaning it waits for a single thread to complete the I/O operation (such as reading data from disk to memory). This wait type is often seen during heavy disk I/O operations and can indicate performance bottlenecks if it occurs frequently, suggesting that the system may be waiting for data pages to be loaded from disk, often due to inefficient query patterns or slow storage subsystems. Among our customers, it occurs in around 3% of cases.
- PAGEIOLATCH_SH: Occurs when a thread waits for a data page to be read into memory (buffer pool) in shared mode. This wait type is typically associated with operations where SQL Server needs to read data from disk to satisfy a query or perform maintenance tasks such as index rebuilding or scans, and the data page is not currently in memory.
- PAGELATCH_EX: Stands for Page Latch Exclusive, which means SQL Server is waiting to acquire an exclusive latch on a data page in order to perform a modification (e.g., an update, insert, or delete) on that page.
DB Log – Waits related to the logging operations that SQL Server performs to ensure transaction durability (ACID compliance). Among our customers, it occurs in around 2.5% of cases.
Common DB Log wait types include:
- WRITELOG: Occurs when SQL Server is waiting to write the transaction log to disk. This can happen when there is a backlog in log writes, often due to slow disk performance or high transaction volume.
Remote Transaction – Waits involving distributed transactions across servers or slow network communication. Among our customers, it occurs in around 2% of cases.
- OLEDB: This wait type can happen when querying or accessing data from non-SQL Server sources, such as Oracle or other databases, or even when working with linked servers that use OLE DB connections.
Lock – Waits caused by contention over database objects such as high transaction concurrency or blocking. Among our customers, it occurs in around 1% of cases.
- LCK_M_IX: Occurs when a session is waiting to acquire an Intent Exclusive (IX) lock on a resource, typically in the context of modifying data in a table or index, to signal that a more restrictive lock is needed for a subsequent operation.
- LCK_M_S: This wait type occurs when a session waits to acquire a Shared (S) lock on a resource. A shared lock allows the session to read a resource but prevents other sessions from modifying it while it is being read.
- LCK_M_IS: This wait type occurs when a session waits to acquire an Intent Shared (IS) lock on a resource. An intent shared lock indicates that the session intends to acquire shared locks on specific rows or pages within a table but does not yet hold those locks, allowing other sessions to acquire shared locks on the resource.
Latch – Lightweight synchronization waits for in-memory data structures caused by buffer pool contention or heavy I/O operations. Among our customers, it occurs in less than 1% of cases.
SQL Trace – Waits related to SQL Server tracing mechanisms, such as Extended Events or SQL Profiler. Among our customers, it occurs in less than 1% of cases.
SQL CLR/Extended SP – Waits related to the SQL CLR (Common Language Runtime) or extended stored procedures. Among our customers, it occurs in less than 1% of cases.
Thread Pool – Occurs when SQL Server cannot allocate worker threads to execute queries due to thread pool exhaustion. Among our customers, it occurs in less than 1% of cases.
Transaction – Waits associated with transaction management, such as locks, log writing, or dependency resolution. Among our customers, it occurs in less than 1% of cases.
XTP In-Memory – These waits occur during operations involving memory-optimized tables and natively compiled stored procedures. Among our customers, it occurs in less than 1% of cases.
 Symptoms:
High average wait stats – more than 100ms during 15 consecutive minutes – can indicate poor performance of the DB system. If the observed wait stats frequency differs considerably from the average presented above, this can be another indication of some performance issues.
Impact: Medium
AimBetter categorizes the wait types and reports the average length of each category over any selected period. According to the resources involved in the most frequent wait causes, analytics are available about the top-consuming queries, top-accessed files, and picks in resource consumption to shed light on the root cause of the performance issues.
Possible causes
1- Queries are waiting for data that depends on locked resources. Priority: High
Another transaction has locked and prevented this transaction from being committed
Recommended action :
Where possible, use “WITH (NOLOCK)” when reading transactions. Re-prioritize processes according to needs.
2- All network bandwidth is consumed. Priority: High
Recommended action :
Check what traffic occupies the bandwidth the most. Reschedule non-essential activity (e.g., virus scans, backup, etc.) to hours of lowest SQL demand where possible.
3- Storage space is not available. Priority: High
Recommended action :
Check available space – for more information, see our post about host disk space here.
4- Insufficient free memory Priority: High
Insufficient RAM can force excessive page file swapping, which reduces overall speed to disk-access times and increases wait times dramatically.
Recommended action :
Using AimBetter Observer, identify the processes that are occupying most RAM. If possible, achieve the optimal balance between OS RAM and page file allocation. If there is no other possibility, add RAM.
5- Insufficient CPU resources. Priority: High
For more information, see our post on CPU utilization here.
6- Incorrect buffer pool allocation. Priority: Medium
As free memory is consumed, pages residing in the memory are swapped out to disk to be replaced by needed data. Wait times will increase substantially.
Recommended action :
Correct the buffer pool allocation or add memory. See our explanation of page life expectancy here and buffer cache hit ratio here.
7- Locks or blocks due to incorrect code. Priority: Medium
Queries that run with a large number of iterations or are susceptible to blocks and deadlocks will hold onto memory and force page swapping. See our explanation of coding problems causing deadlocks here.
Recommended action :
Optimize code. Possible actions :
- Redesign program to maximize the use of indexed data.
- Redesign table structures to match the requirements of the programs by building indexes.
- Make use of temporary tables.
8- SQL not releasing memory to the operating system Priority: Medium
The SQL Server is set to the wrong maximum level.
Recommended action :
Optimize memory allocation.
9- Missing or corrupt indexes Priority: Medium
Missing indexes will cause extensive data searching from disk, resulting in page swapping.
Recommended action :
See our explanation for missing/corrupt indexes here.


