A connection is a new session established with the SQL Server Database Engine. It might be a connection from any client or application that can interact with the database and run queries.
It’s important to differentiate between a login and a connection since one login can create several connections with the SQL Server from the same login, and what matters is the number of current connections, which can be defined as the number of sessions (SPIDs). Too many open connections can lead to resource overloads and a slowdown in performance.
When a query is executed, the SQL Server engine processes the request and returns the results to the client application, and then the user connection might be closed. If a connection is retained for an unjustified length, this may indicate some coding problem with one or more poorly written applications maintaining an open connection.
Find out how you can save hours of work when investigating the root cause of this issue.
Symptoms
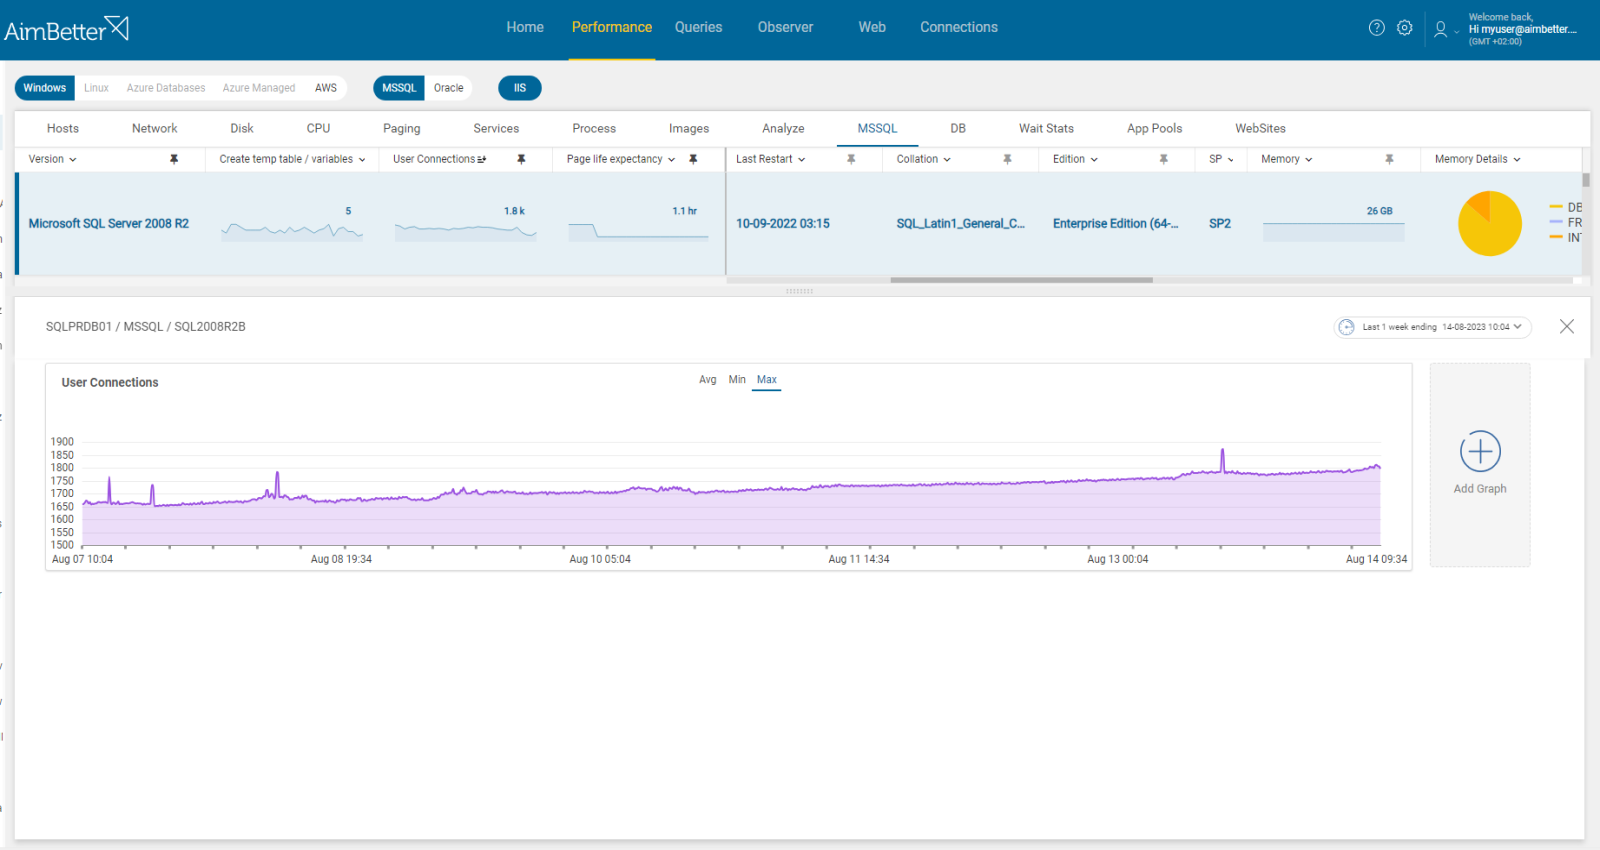
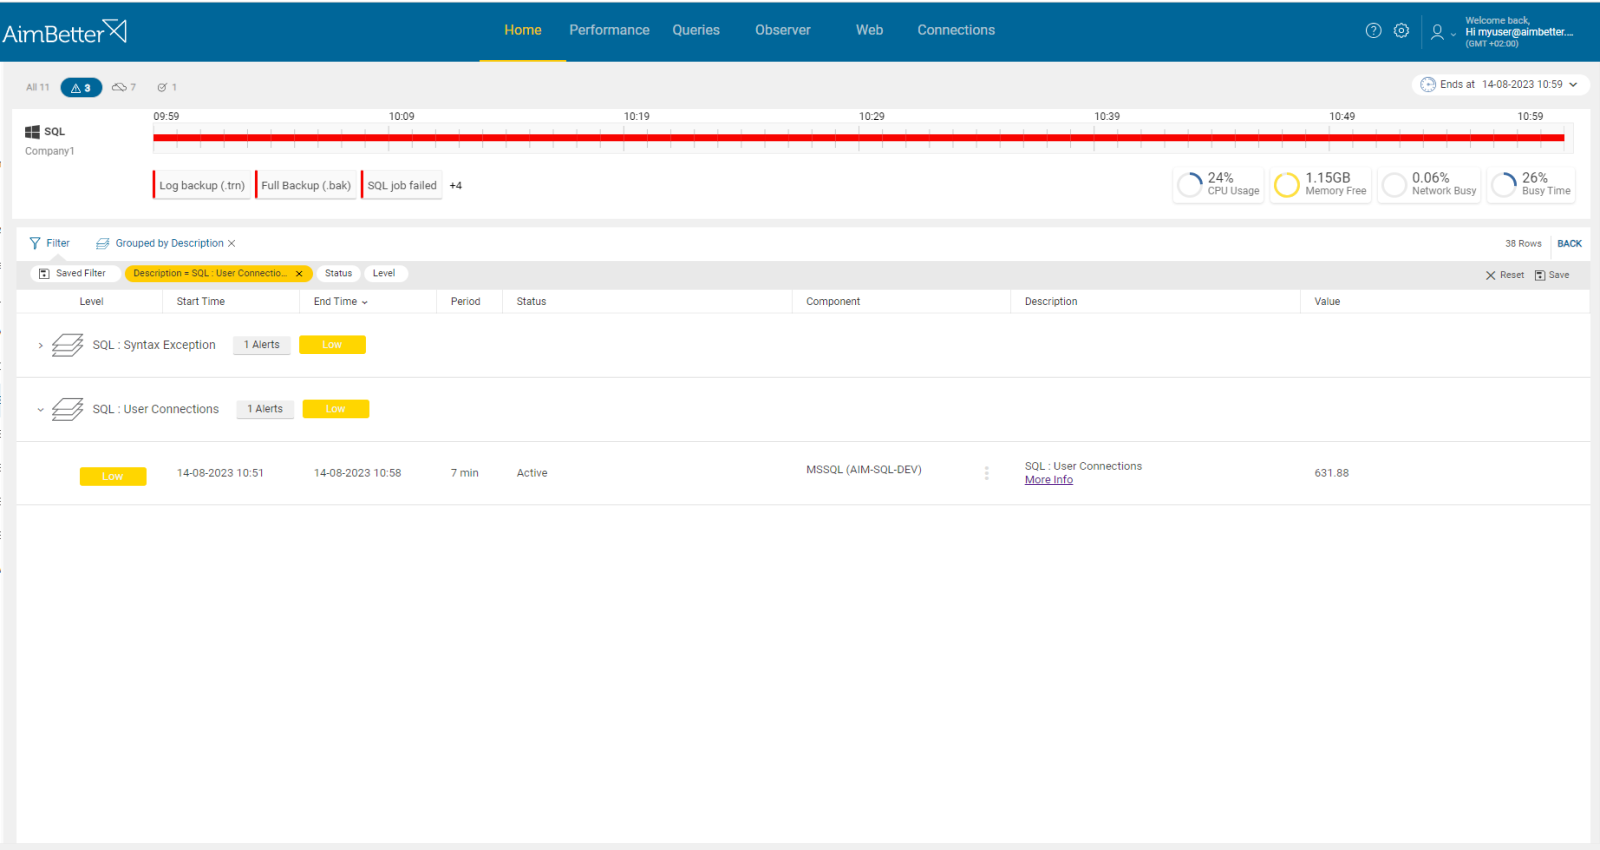
The number of concurrent user connections has risen above the threshold level. This causes a slowdown in the system performance, and delays might occur when there are too many user connections.
Impact: Medium
Too many user connections allied to high resource consumption increases the probability of blocking and memory pressures. The slowdown in performance will also affect the user’s experience in your applications even more.
Expected behavior
The number of user connections should vary around an average – a significant increase might imply a problem. There is no standard metric for the number of connections – it depends on the business flow needs, application limits, clients, and resources available. Reviewing past behavior may provide insight.
Possible causes
1- Increased usage – User creates multiple connections or application’s usage. Priority: High
When queries are running too slow, a user can try doing the same process multiple times and create too many connections at once. In addition, a sudden surge in application usage might cause an increase in user connections since more users are accessing the SQL Server. Furthermore, applications tend to create duplicate connections for the same process.
Problem identification:
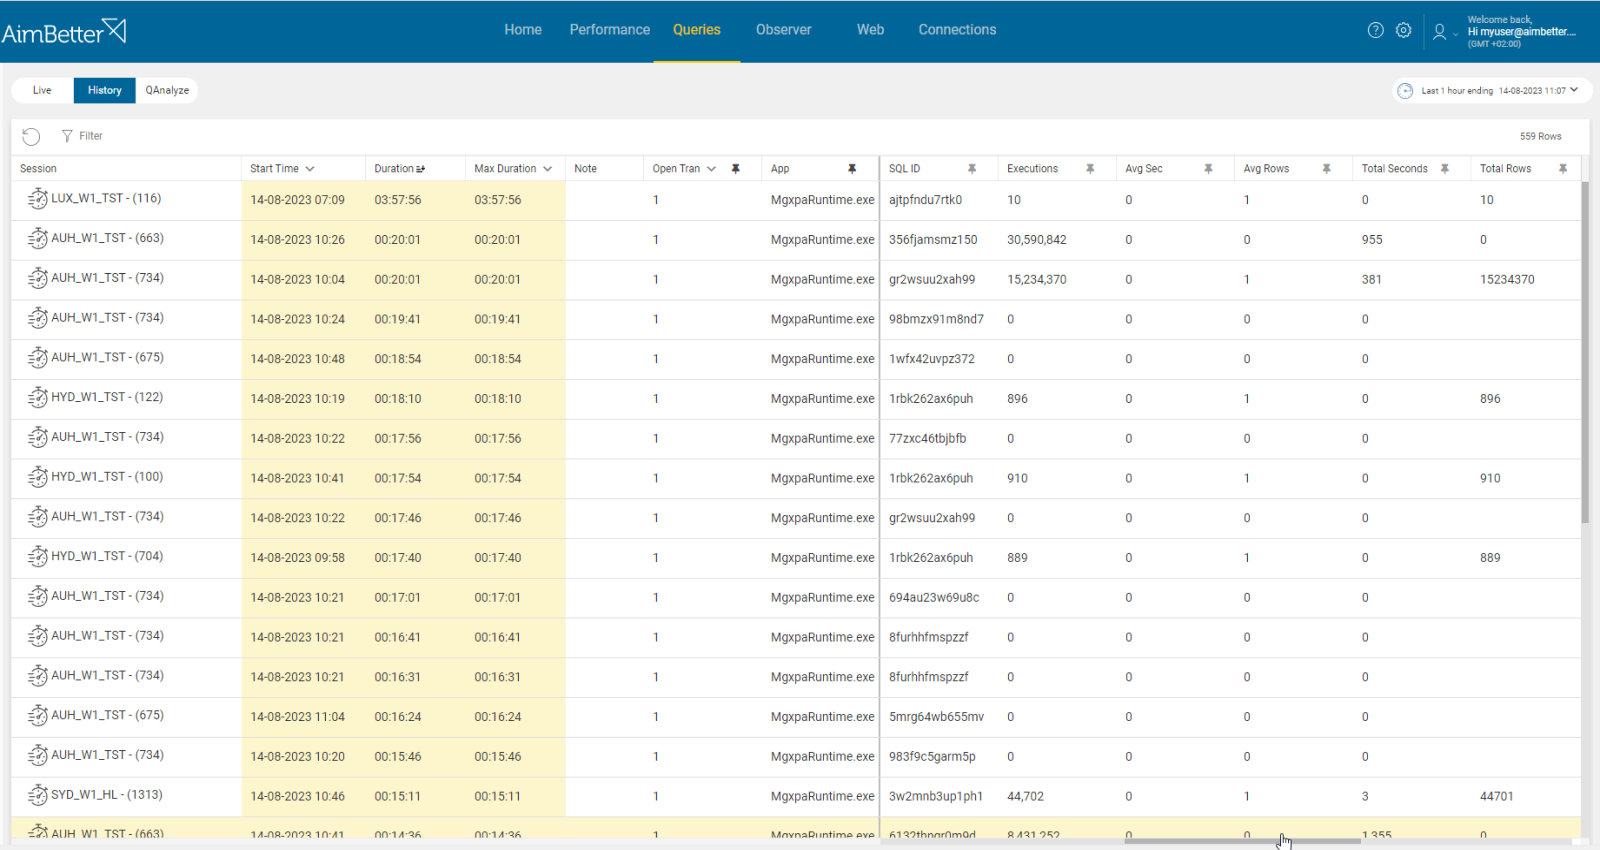
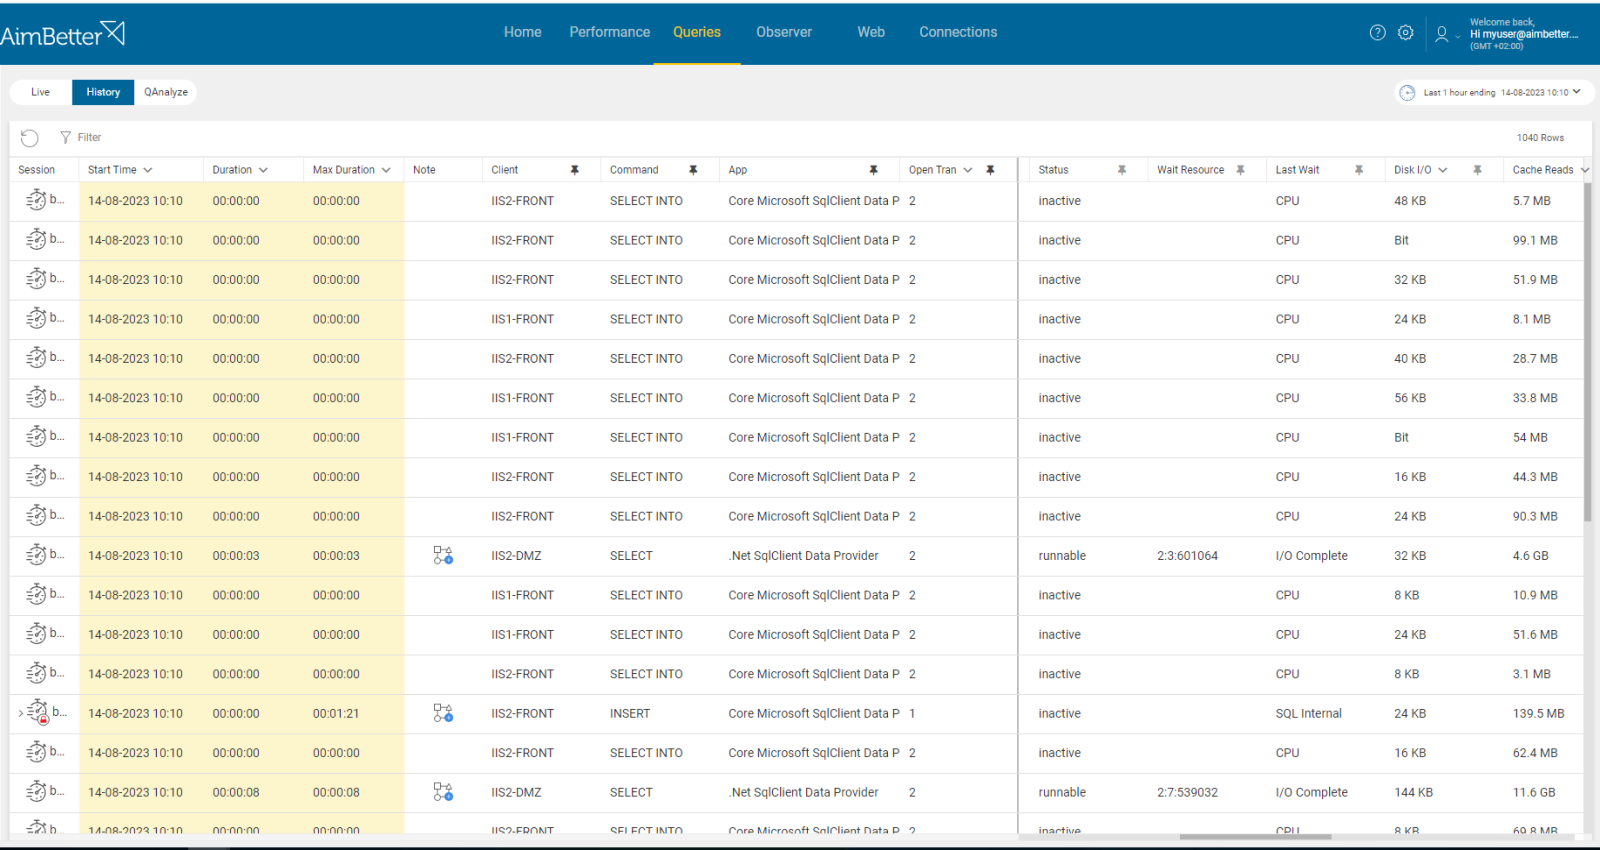
Check for increased user connections number and check both the application and the login name identified in the sessions.
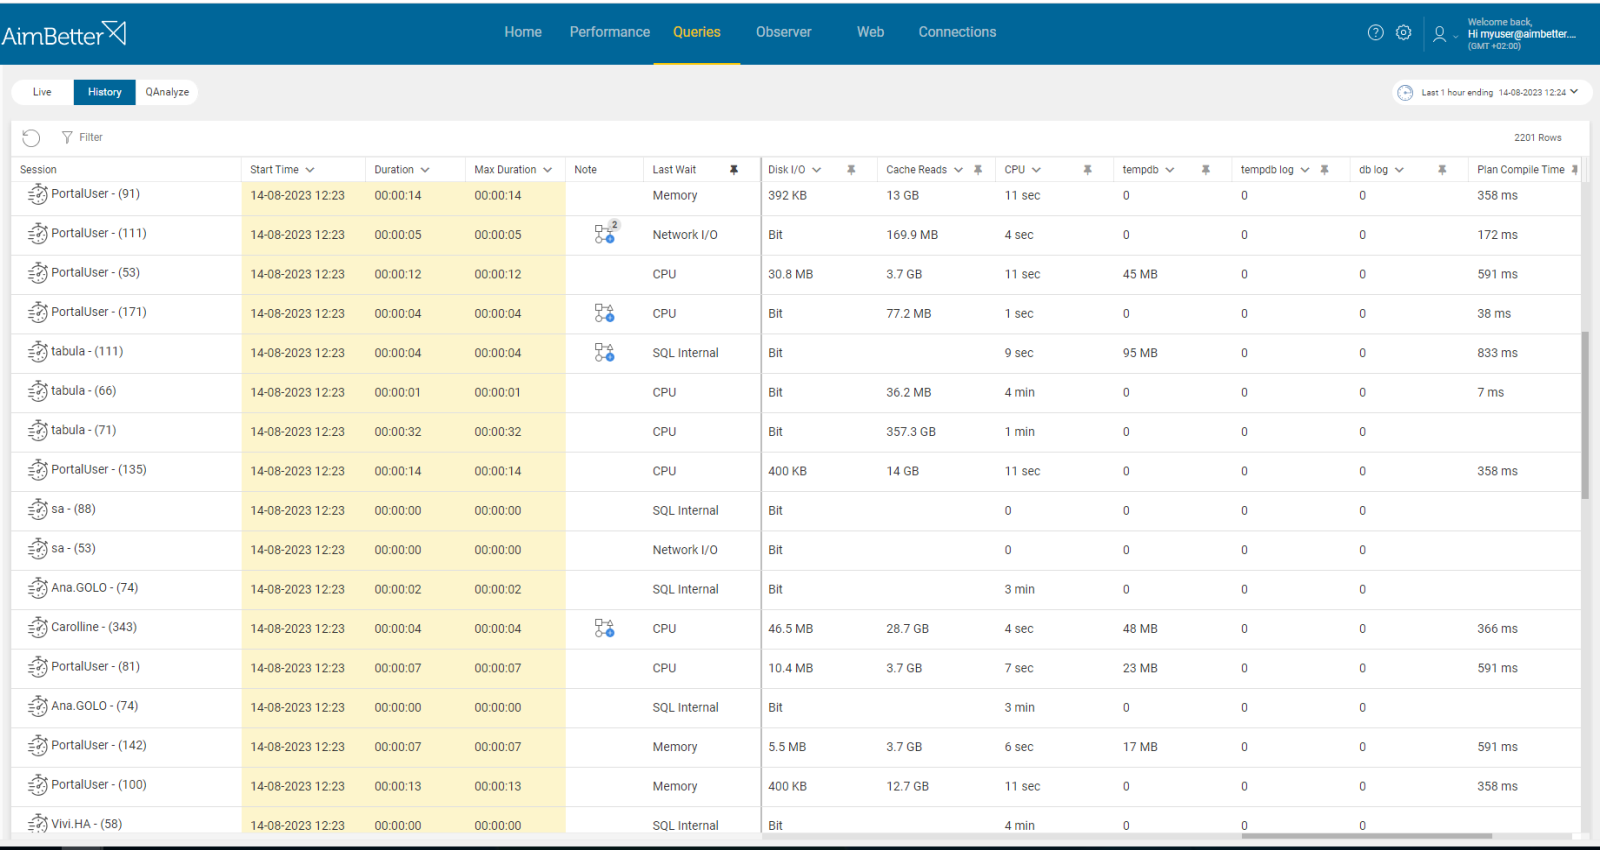
- Connect to the SQL Server Management Studio (SSMS) and navigate to the Activity Monitor. This provides online information about user connections, yet you don’t have history data to compare with in order to decide what is the source of the increased activity.
- Query SQL Engine system views to identify repeated patterns of many connections originating from the same user or application. However, also here, you don’t have history data, and you should monitor this issue manually.
- Check the application’s logs for any unusual activity or errors related to connections. For that, you have to know where it’s located and how to search for it in the logs.
- Check if some queries are the same process running in several different connections.
- You should track this issue in order to characterize the routine behavior of connections in your environment.
Recommended action :
The root cause should be diagnosed accurately in order to solve this issue correctly.
You can follow the next steps:
- Ensure that the application’s connections are being properly managed and closed
- Set appropriate timeouts for idle connections
- consult with the application team on whether to limit the number of connections established by a single user.
You should monitor this issue in order to track it.
2- Queries are running long or long transactions. Priority: Medium
If transactions are held open for extended periods of time or queries are running too long, it might cause a major increase in users’ connection. When queries are running for too long, it might be because of several reasons: poor coding, missing indexes, blockings, or maintenance tasks.
Problem identification:
Identify queries that are running long or with open transactions and check if, in parallel, there is an increase in user connections.
- Use tracking tools (such as SQL Server Profiler) in order to identify query transaction isolation levels or long-running queries without open transactions. It might be complicated since you have to prioritize these events (by duration or resources) and make sure you have all details needed.
- Check if the transactions are blocking or blocked queries by using different DMVs (Dynamic Management Views). You can analyze the queries, locks, and resource usage to determine the cause of the blocking. Take into account that you don’t have historical data to compare with.
- Investigate the query code and execution plan, trying to look for missing indexes or excessing subqueries. In order to get this data, you have to run the query live again from the management studio, which might cause an overload and extend the investigation time of this issue. You should know how to use a query execution plan and find problems in it in order to utilize it wisely for performance improvement.
- Access the job activity monitor in SQL Server Agent in order to check which jobs are running currently. There might be a chance when the job is doing operations with several databases at once, and that can increase user connections. Otherwise, it might just have a long execution time since it’s a heavy operation.
- Depending on the situation, you might need to optimize the queries.
Recommended action :
Analyze and optimize frequently executed queries to reduce their execution time and resource consumption and create new indexes if they are missing.
Break complex queries into more simple steps in order to reduce their execution time and the likelihood of keeping transactions open for extended periods.
Avoid running maintenance tasks or jobs at main working hours if they can be postponed to other time periods.
3- Inadequate hardware infrastructure. Priority: Medium
If hardware resources are not enough to deal with the increasing workload, it might lead to slow executions and an increase in users’ connections. It would be expected that queries will remain open, waiting for resources, with high resource consumption.
Problem identification:
- .Check the Task Manager in order to identify a possible overload of hardware resources. For Linux, you can use the ‘htop’ command.
- Use OS tracking tools such as Performance Monitor (for Windows OS ),or Performance Co-Pilot(For Linux), in order to identify which processes use hardware resources. For network activity, use a network monitoring tool, and check how much traffic flows through your network and which applications or devices use the most bandwidth. Take into account that most tools help pinpoint when a problem starts, with which you can’t compare to old time frames.
- Check whether the long-running queries wait time is for a specific hardware resource and which hardware resource is more utilized than others while the query is running. For that, you should be using tracing tools such as SQL Server profiler. This step might take time, and the result probably won’t be precise while checking only online statuses.
- Check if there is an increase in users’ connections as well, using DMVs or the Activity Monitor.
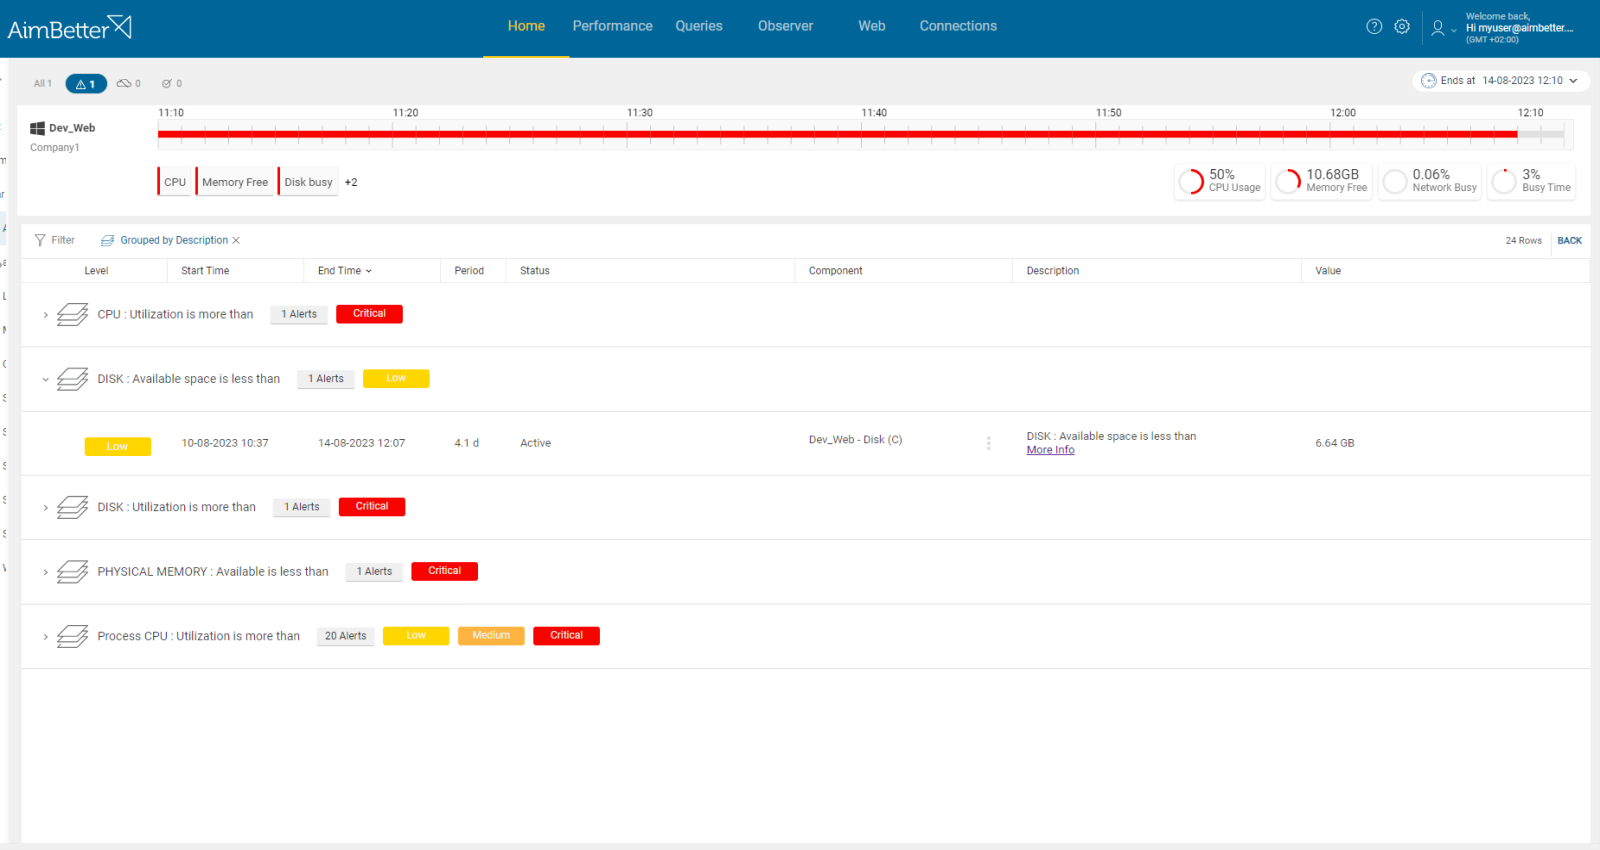
If there is an issue with any hardware resource, you will be immediately alerted about that.
You will also be alerted about too many user connections.
Comparing time frames is easy when working with a single panel which allows you to view several metrics at once, checking query details and utilization of resources.
Recommended action :
Infrastructure should be upgraded if possible, adding more CPU Cores, RAM Memory (that needs later to be allocated to the SQL Engine), bandwidth, or disks. In some cases, you should consider moving the SQL instance over to a newer machine.


