This metric provides the number of queries SQL Server reports waiting for CPU availability.
There may be conditions in which SQL is showing very high levels of wait times for CPU while CPU activity has not risen significantly or at all. There are three different kinds of CPU wait to be accounted for: SOS_SCHEDULER_YIELD, CPU (Signal Wait), and CPU (Consumed).
SOS_SCHEDULER_YIELD and CPU (Signal Wait) measure when a session is ready and should be running according to the scheduler but waiting for the CPU. CPU (Consumed) reports the actual time spent on CPU running instructions.
SQL Server’s thread schedulers allocate a uniform timeslice of 4 milliseconds (referred to as a quantum). Threads requiring less than a quantum will relinquish the CPU and, if the system is not busy, will almost immediately reacquire it. Therefore, a thread yielding and another task assigned to a thread is a common occurrence, and a large number of SOS_SCHEDULER_YIELD waits is not significant in itself.
Since long-running queries will hit the 4-millisecond thread execution limit often, they contribute significantly to the occurrence of high SOS_SCHEDULER_YIELD wait counts.
However, when this wait type comes along with waiting for resources like blocking query or deadlock, I/O operations, or allocated memory, this metric should raise concern, meaning that queries are not performed well and take too much time to complete.
Considering SOS_SCHEDULER_YIELD waits alone illustrates how many performance conditions cannot be diagnosed based on single measurements from individual tools but together with other issues.
A THREADPOOL wait should rarely be seen on a healthy system. A THREADPOOL wait occurs when there are no threads in the thread pool for assignment to a runnable task. This may happen if the configured maximum number of worker threads is too small for the workload. Applications’ queries may be using too many threads or tasks running for too long via the SQL Server, resulting in insufficient available threads for other queries to utilize.
CXPACKET waits can occur when SQL Server tries to synchronize multiple threads for a query with a parallel execution plan. The response to CXPACKET remains dependent on the query itself. This wait type occurs when parallel threads within a query wait for other parallel threads to complete their work before proceeding.
To summarize, wait stats relating to CPU usage rarely directly indicate a single problem. At best, CPU wait stats can call attention to possible causes. Still, only further investigation of the queries involved and the server workload can determine whether problems exist and, if so, what action should be taken.
Symptoms
Queries are taking longer to finish execution, or queries that should be scheduled to run at the same time are not running or running in delays. Users are reporting errors related to deadlocks or other SQL exceptions.
Find out how you can save hours of work when investigating the root cause of this issue.
Impact: Medium
Degrading general server’s performance and user’s experience using the business’s application related to SQL Server.
Expected behavior
It depends on the business’s flow. Each of these wait types mentioned above is not a real problem by itself. They indicate a problem when there are querying or performance issues leading to degradation in performance. If the workflow seems to split unevenly, there may be a problem.
Possible causes
1- Query issues- high volume, long-running, blocking queries, or deadlocks. Priority: High
When there are more than several active queries in need of CPU resources, they might experience wait times. On the other hand, long-running queries due to poor execution plans might consume extended CPU resources and cause other queries’ sessions to wait.
Sessions involved with blocking queries or deadlock events might consume CPU since they check for lock status and handle synchronization issues.
Problem identification:
Identify irregular query performance, which is one of the issues mentioned above, and check if there are more sessions than usual, waiting for the CPU to be available.
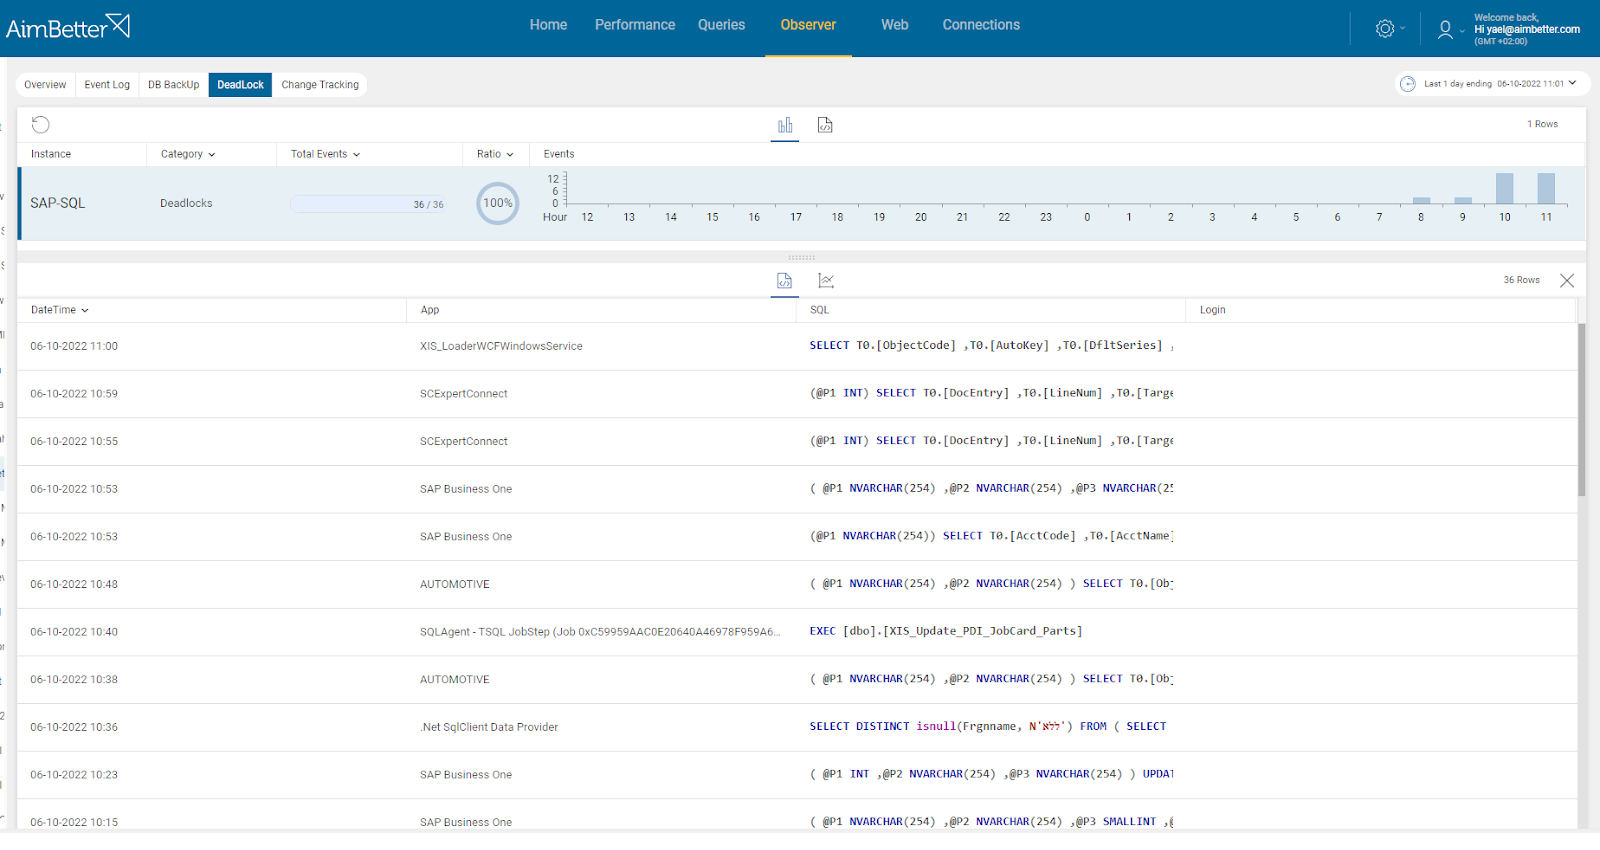
- Use tracking tools, such as SQL Server Profiler, in order to identify running queries currently. Activate a trace and analyze the outcomes – whether there are blocking queries, deadlocks, or queries with long execution time, or if the count of them seems to be too much.
- This task should be done by a DBA in order to select current filters to the trace and to analyze the outcomes. Take into account that you have only current performance and can’t compare to historical performance unless you put more traces, which requires you to wait more time.
- You can also use system views in order to collect data about the performance of current queries. Use Dynamic Management Views (DMVs) in order to identify which queries are waiting for CPU currently and if they are related to the problematic queries. You should filter for correct wait types as well. It might be hard to track.
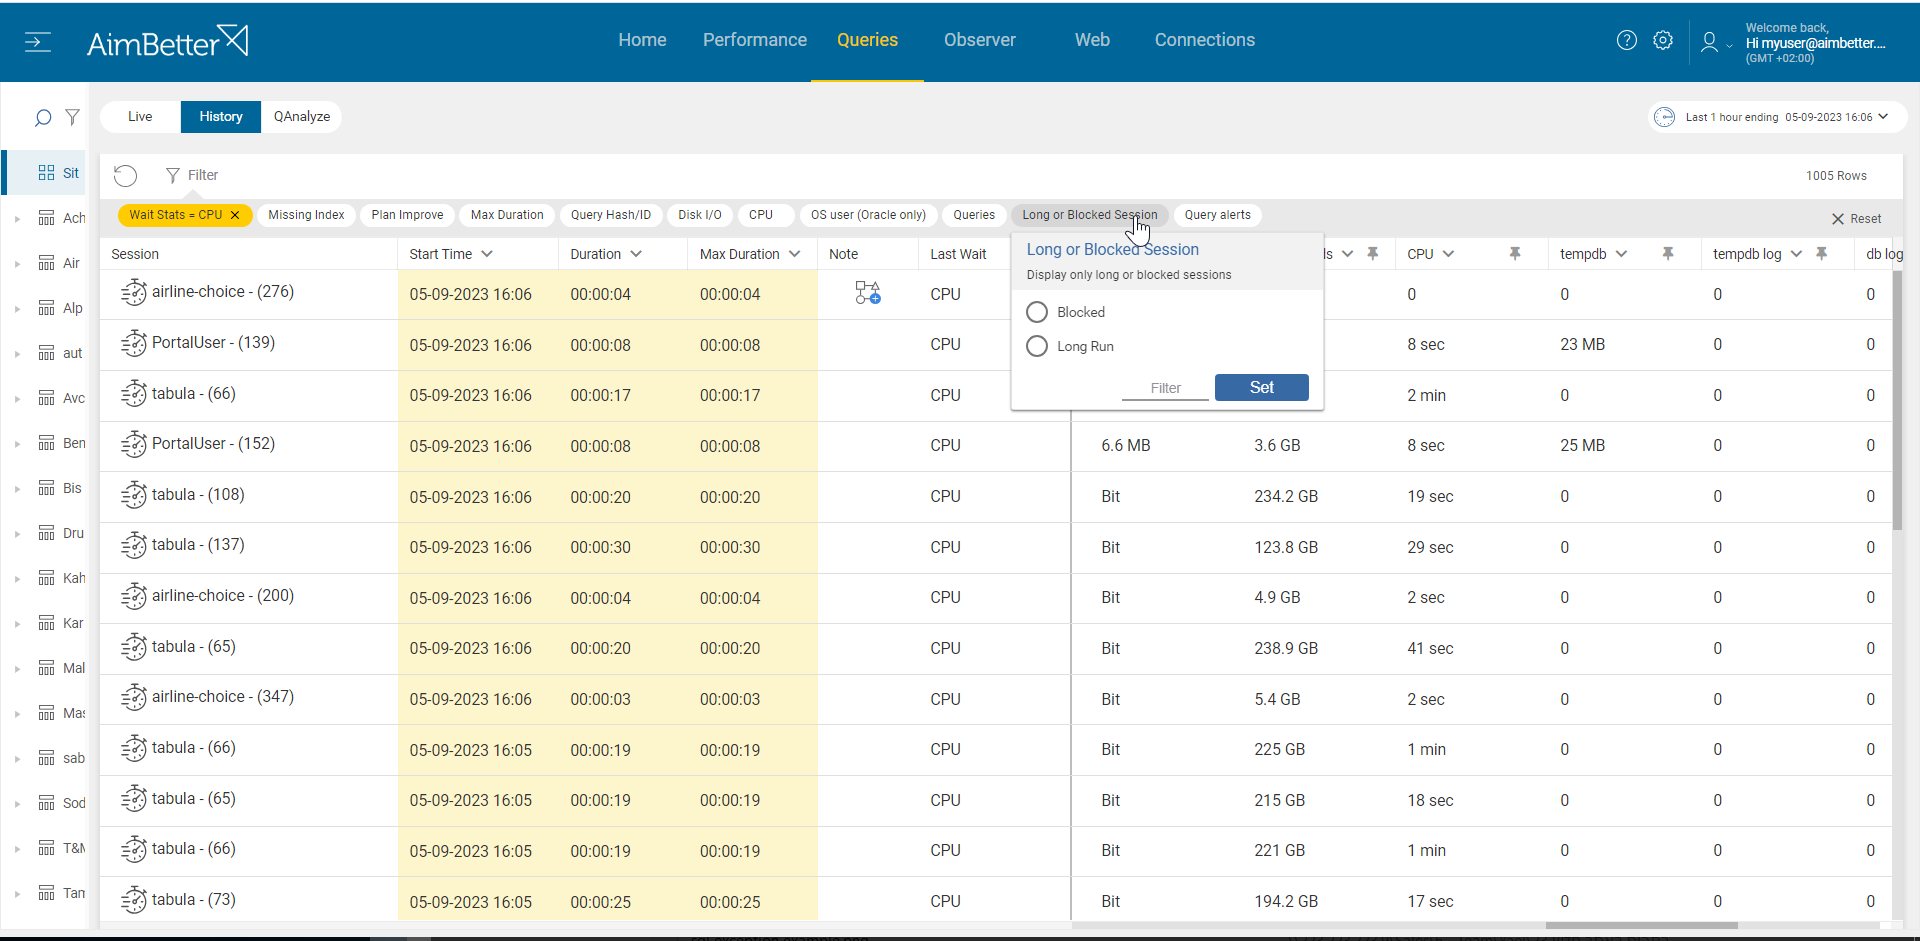
With AimBetter, there is no need to work hard and navigate between several views once you are provided with all the data you need.
If the sessions waiting for CPU has increased, you will receive an alert about it. If there are blocking/long-running queries or deadlocks, you will receive an alert about that as well.
Recommended action :
Optimize the query code: you may need to adjust the query design and execution plan – look for heavy tasks and loads of data, optimize indexing, implement correct isolation levels, tune queries, and change settings if required.
With AimBetter, this process is easier since there is an automatic algorithm that analyses each query plan if it should be optimized.
Break complex queries into more simple steps, and make sure to use proper filtering, WHERE clauses, and JOIN operations. Reprioritize processes according to needs. Consult with a DBA who understands the data model before making these changes.
2- Resource Issues- Split between CPU Cores, Parallelism settings, or external dependencies. Priority: Medium
If queries tend to use the same CPU core, this can result in higher CPU time. As for Parallelism, queries that use multiple threads can increase CPU resource consumption. In both cases, if the system can’t stand this demand, it probably will lead to higher CPU wait time, thus leading to a higher count of sessions waiting for it.
In addition, if external resources or services (e.g., web services or linked servers) are delayed in response to queries waiting for them, it can result in CPU wait times.
Problem identification:
Identify one of the issues mentioned above simultaneously to a high count of sessions waiting for CPU.
- Track the database server activity: identify which SQL statements have high execution time and consume mostly the CPU. You can use the built-in activity monitors or SQL Profiler for SQL Server. This mission might be complicated and take hours or days of work, requiring a highly skilled DBA.
- When analyzing the trace results, focus on external resource monitoring or thread count used in queries. In addition, use query execution plans to identify parallelism issues- for some of the queries, you will have to rerun to get the execution plan of each query; it might take time.
- DMVs of SQL Server can also help to collect data about queries with high CPU wait time.
- Make sure to monitor CPU Usage continuously with Performance Monitor or Task Manager, take in account this is a manual and live test only, not provided with historical data.
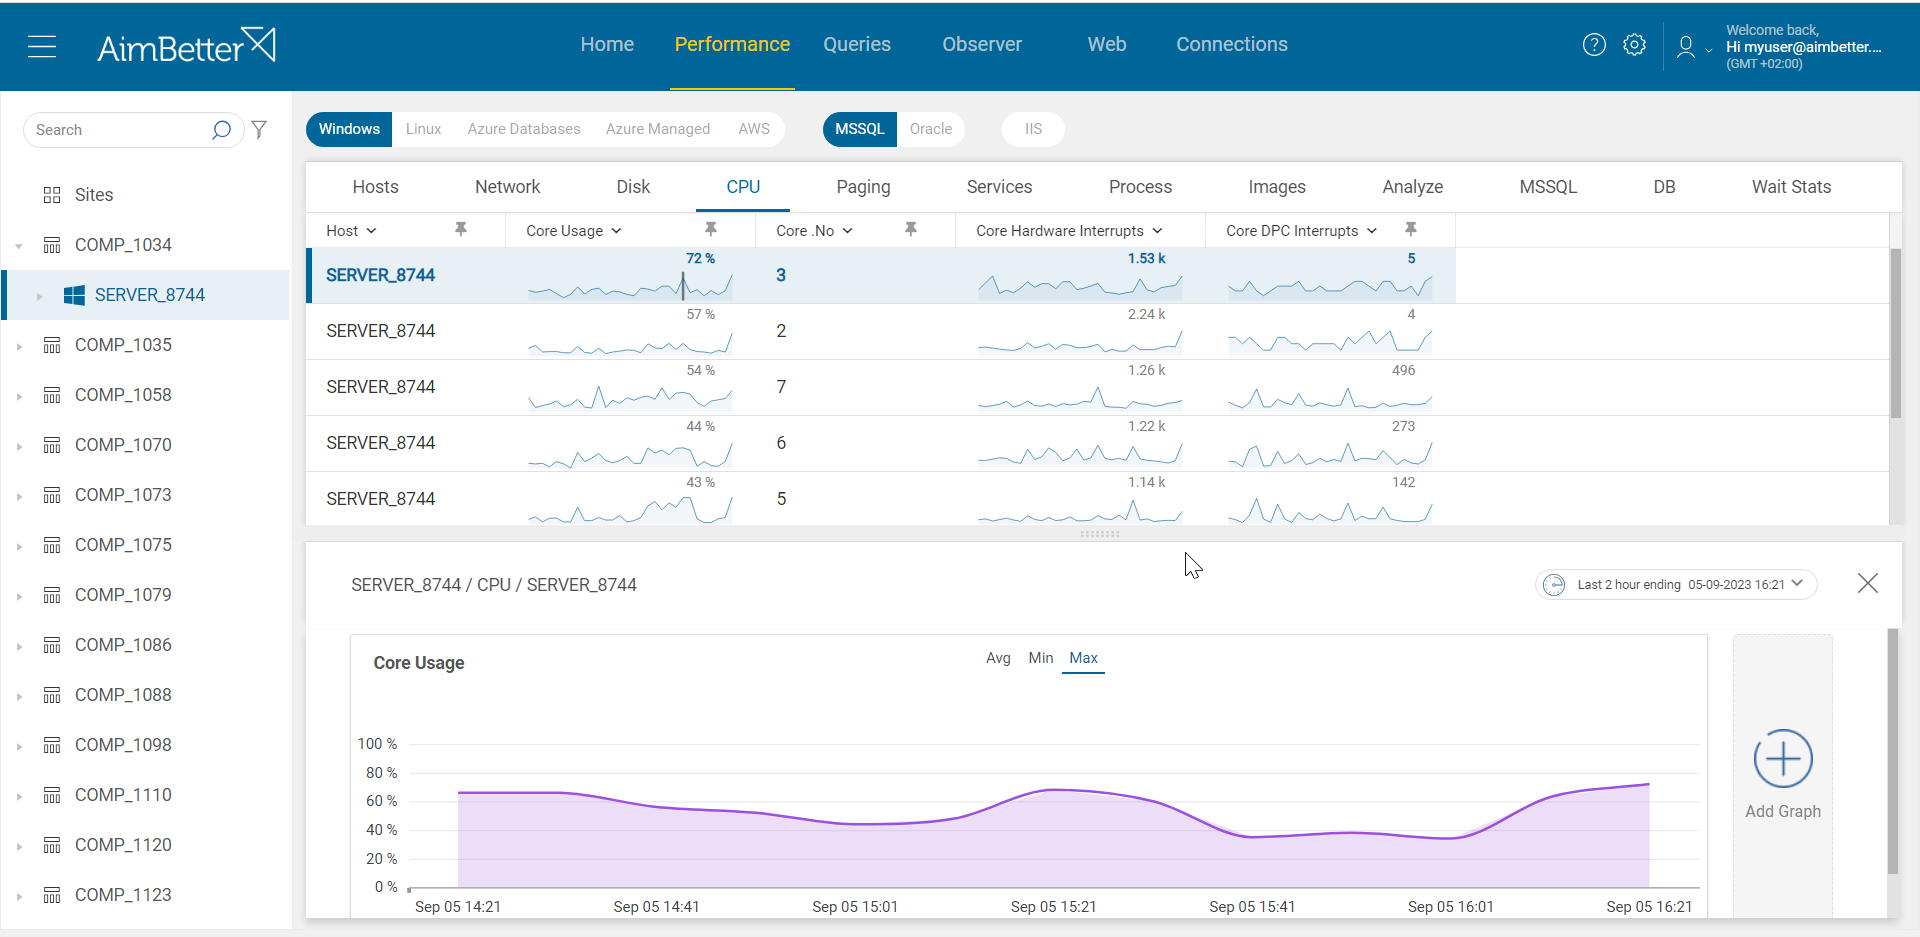
- Check the SQL Server Error log to see if queries are assigned to the same scheduler; consider that you will be provided only with historical context and not live issues. You can use DMVs for a similar check. If you notice queries with the same scheduler_id, it might indicate that they are competing for the same CPU core.
- If you identify delays sourced from external resources, you should also check these. You have to connect these and do separate checks of overall performance status.
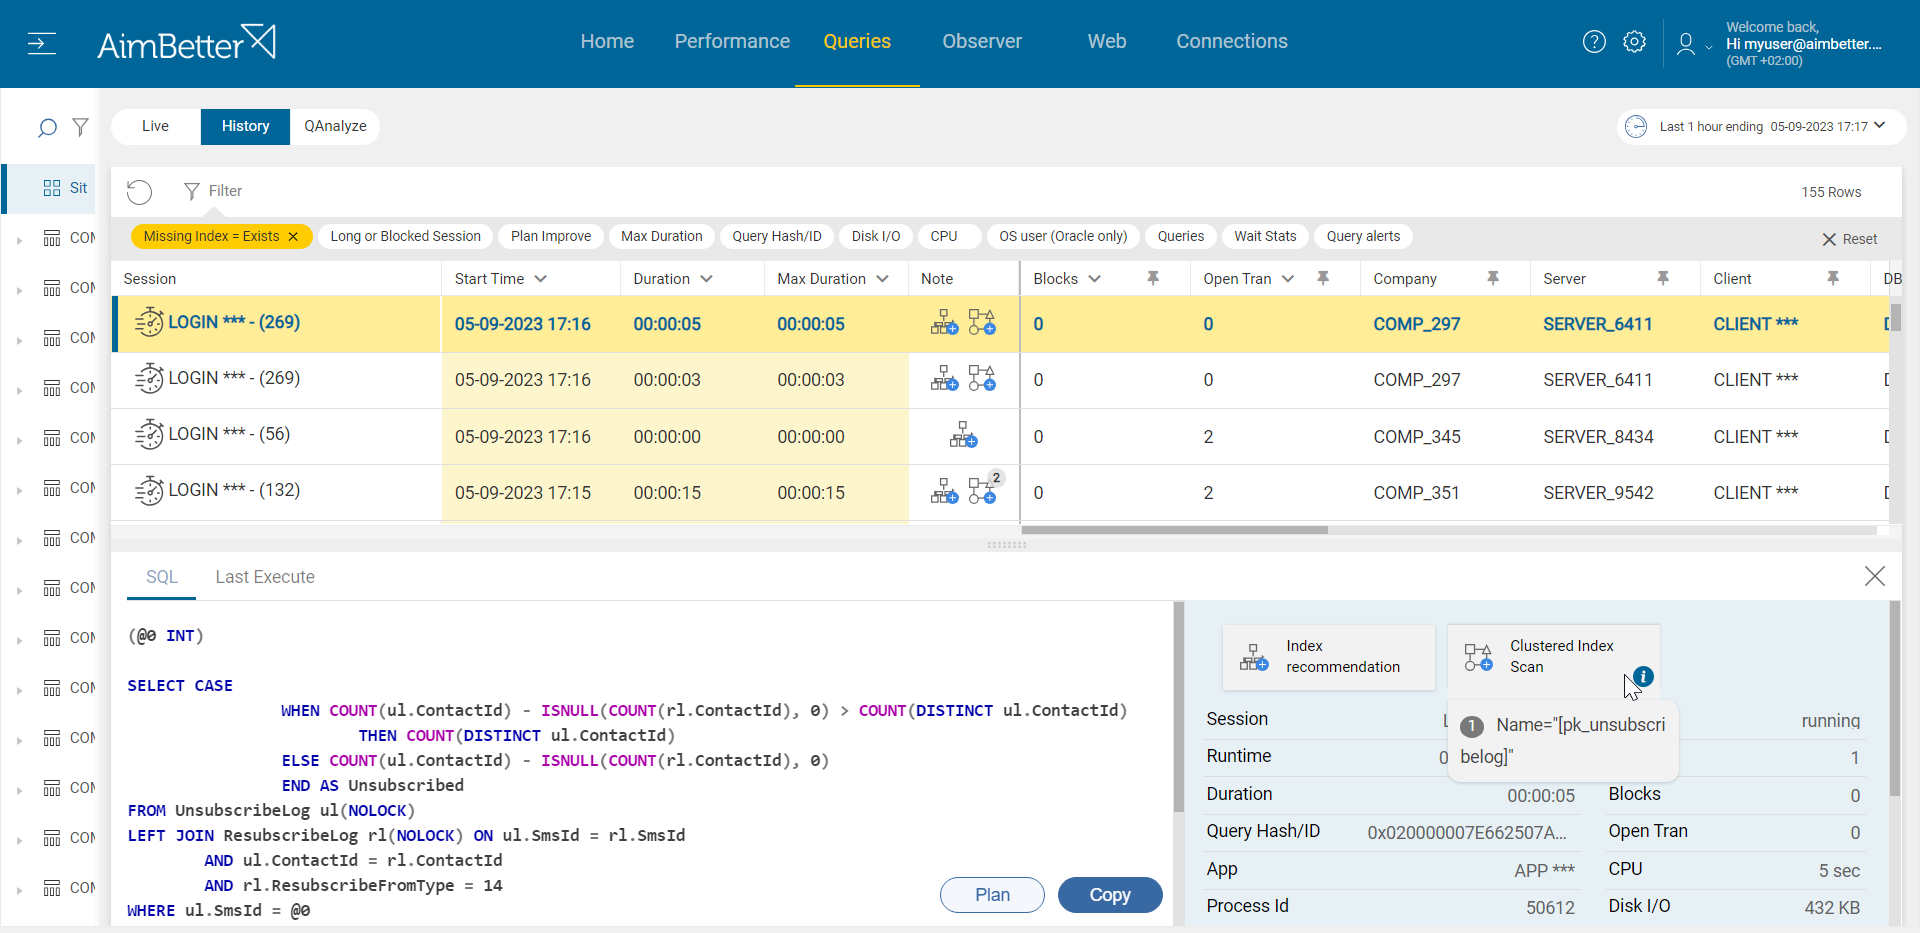
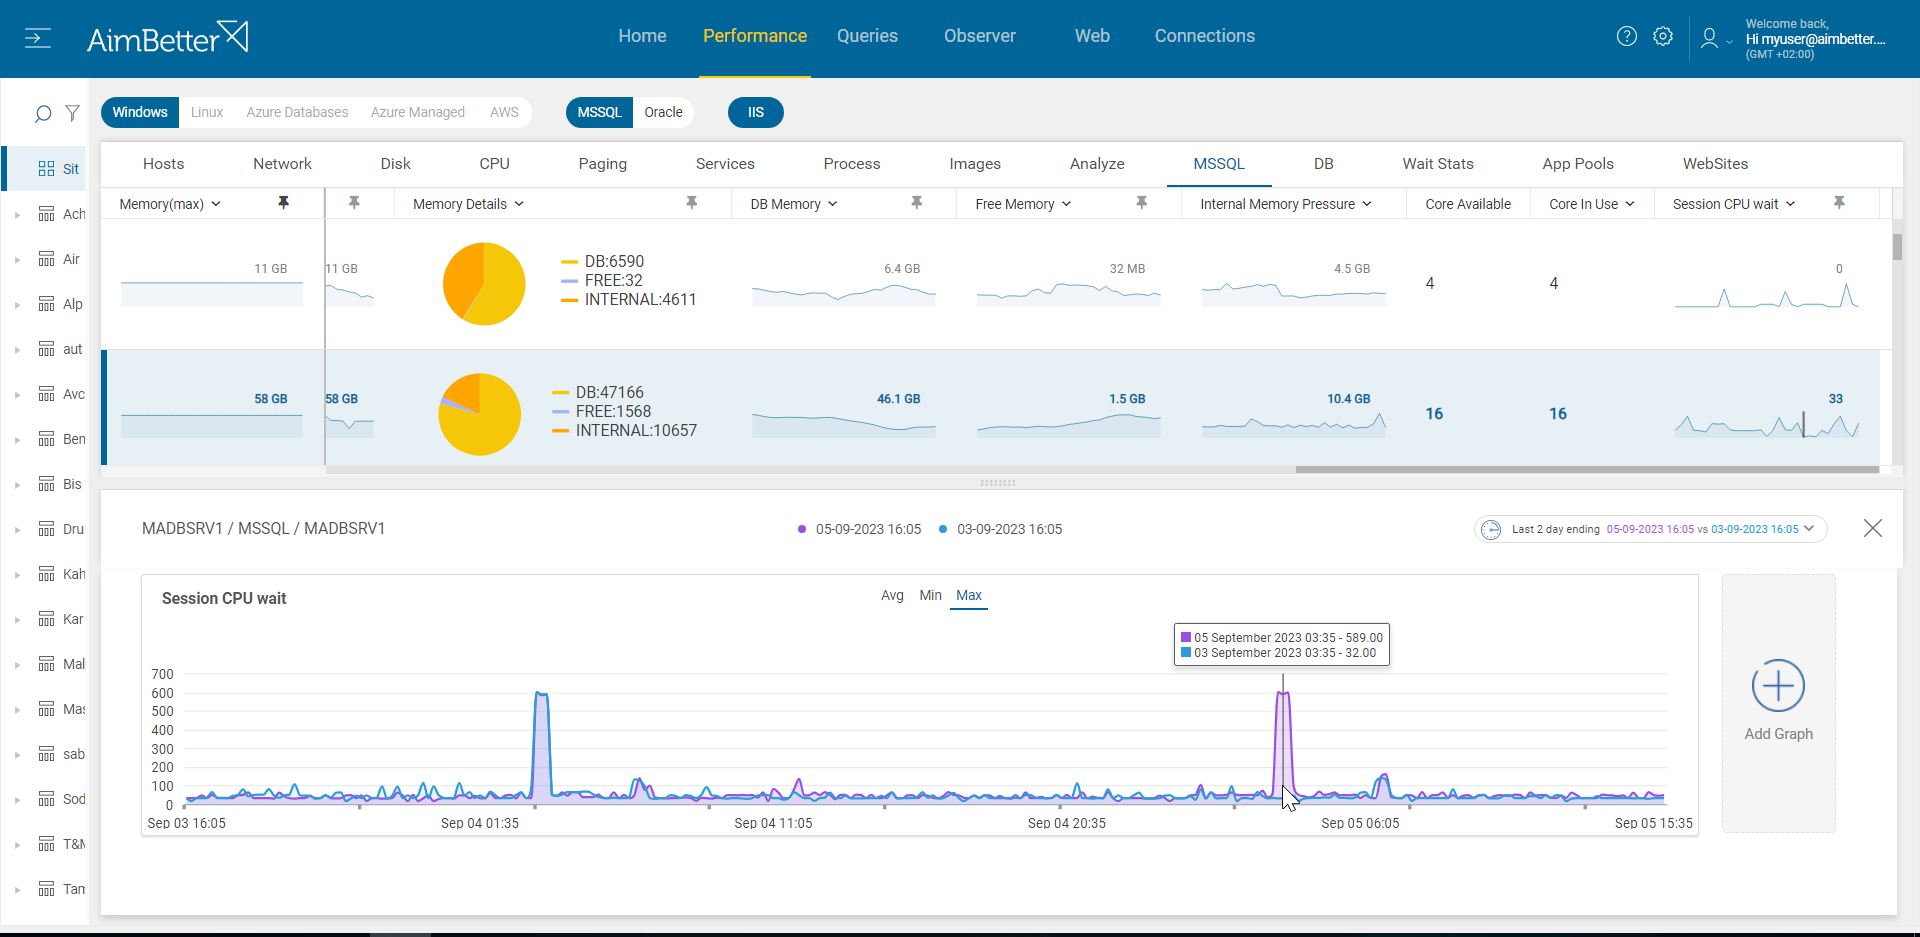
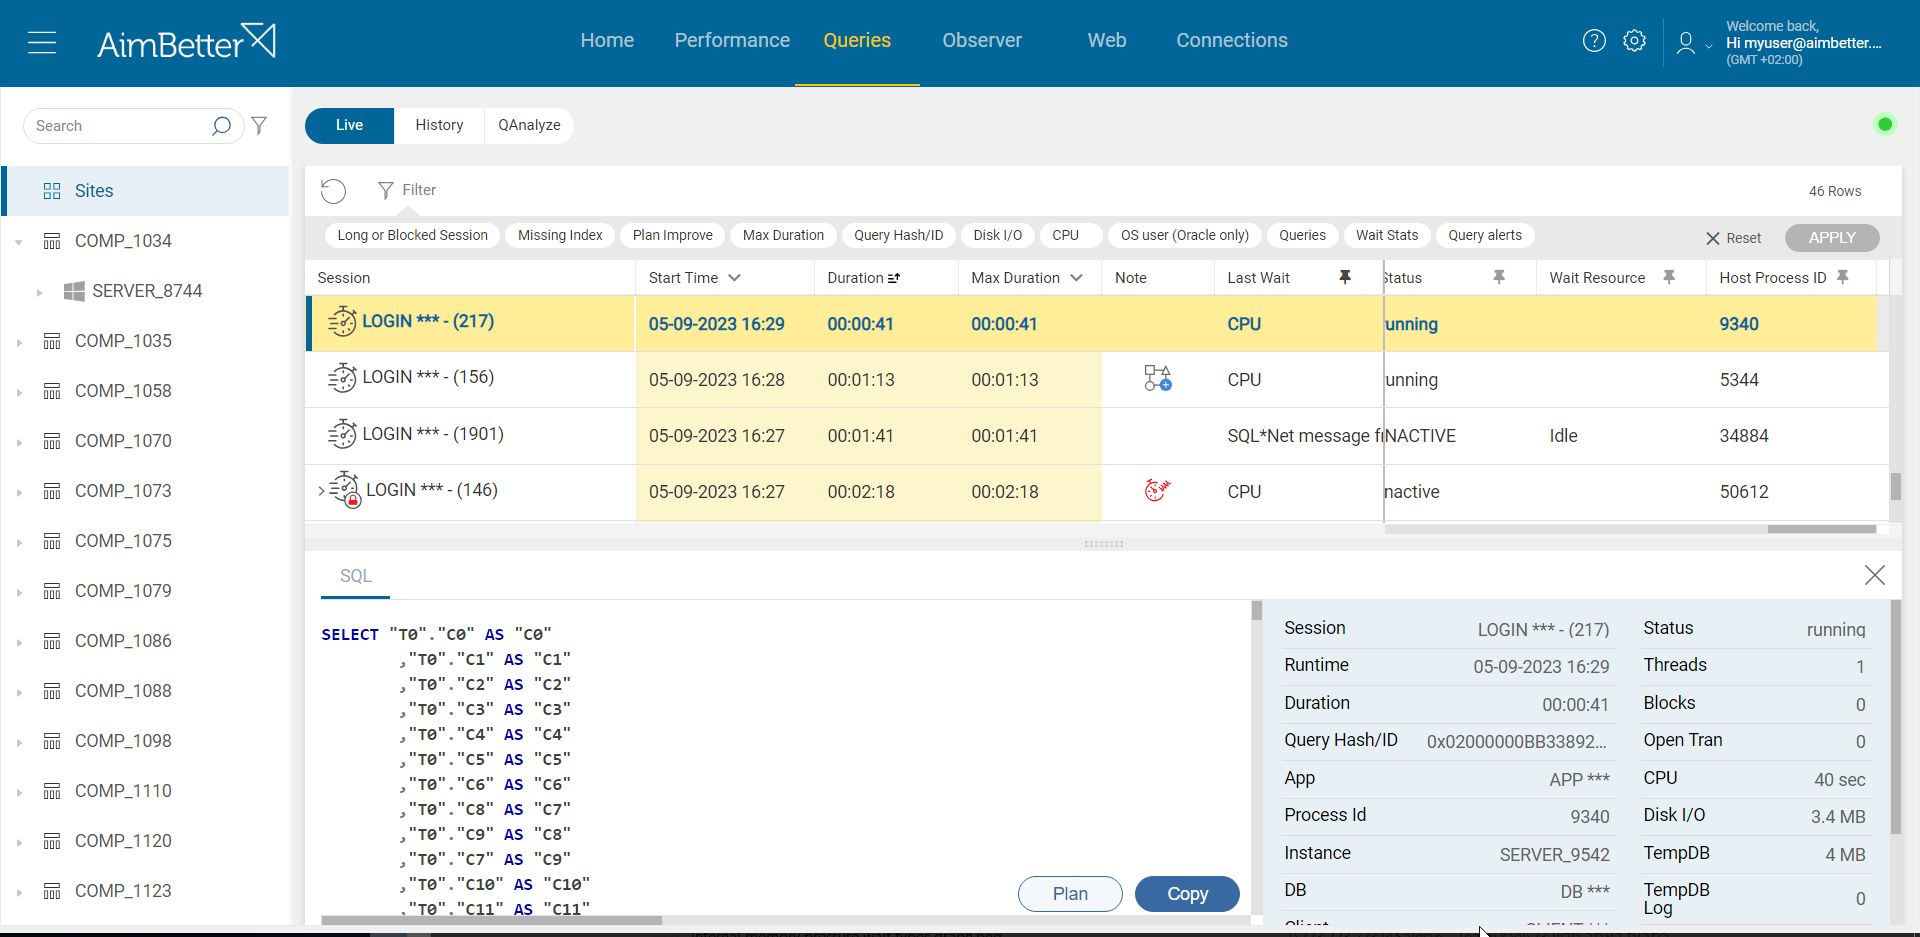
All the details you need are provided in AimBetter’s Queries panel: count of threads for each query, CPU time, which resources are used by the queries, and more! The session count is easy, and seeing how many of them are waiting for the CPU is easy as well.
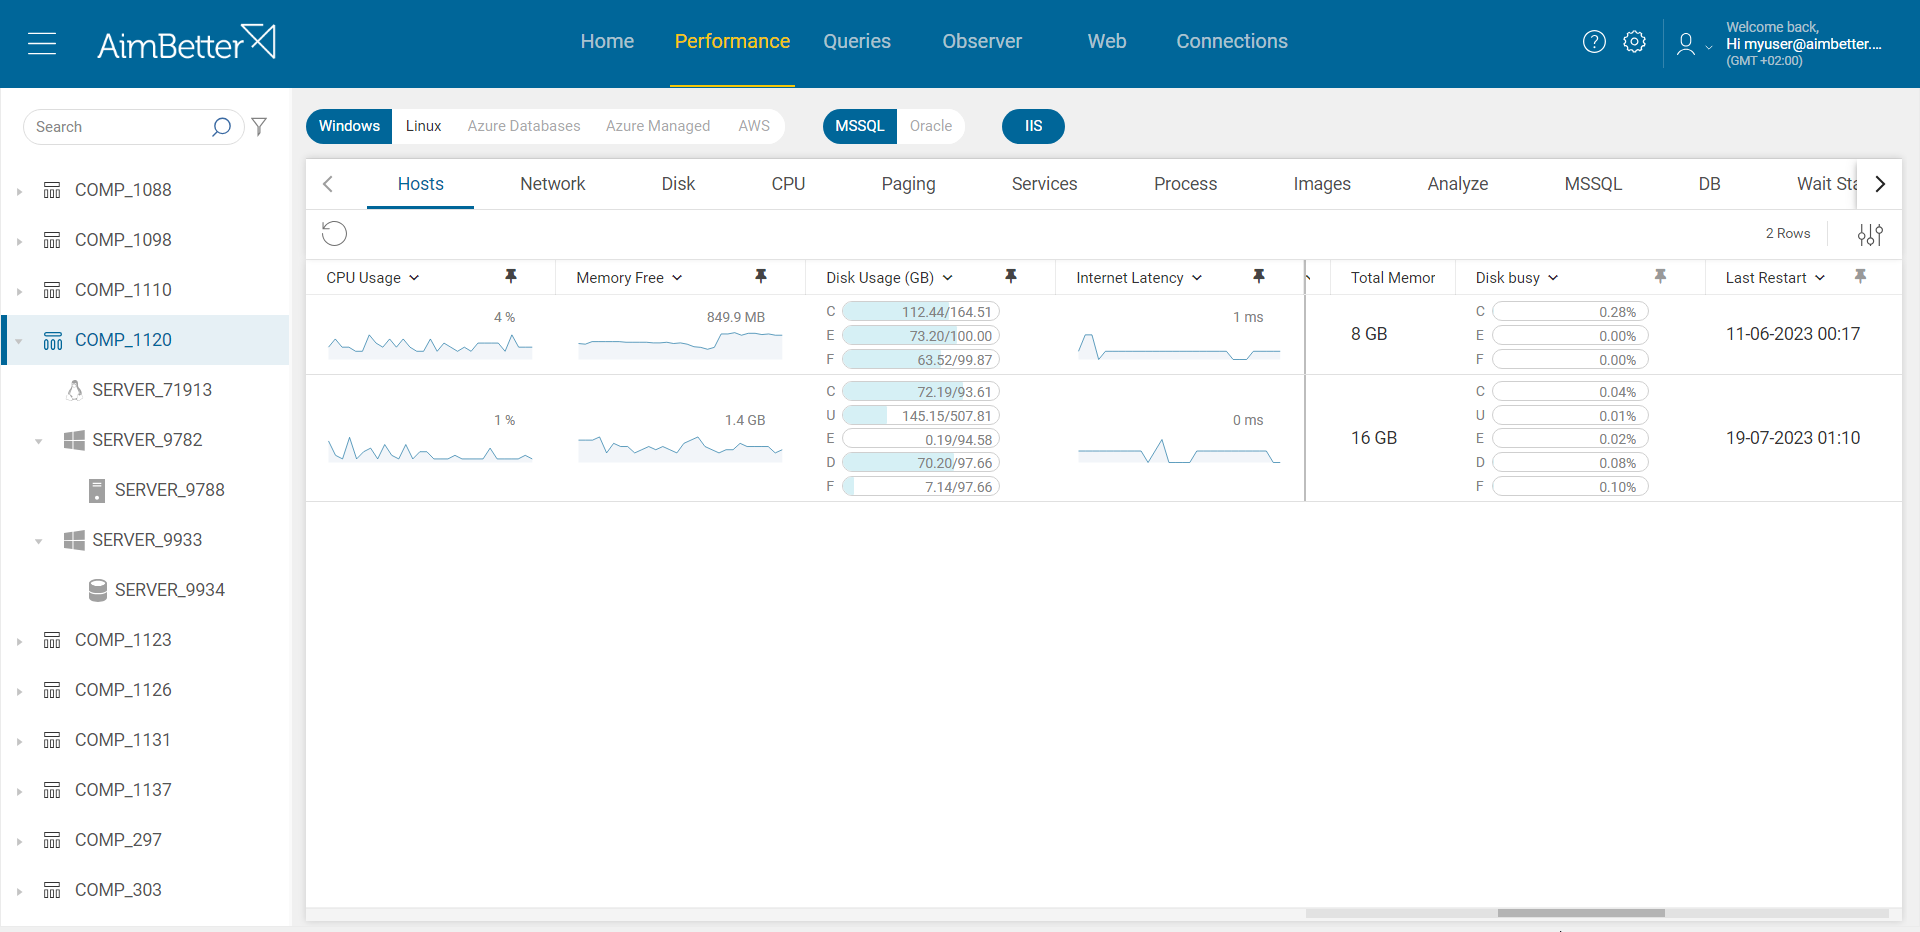
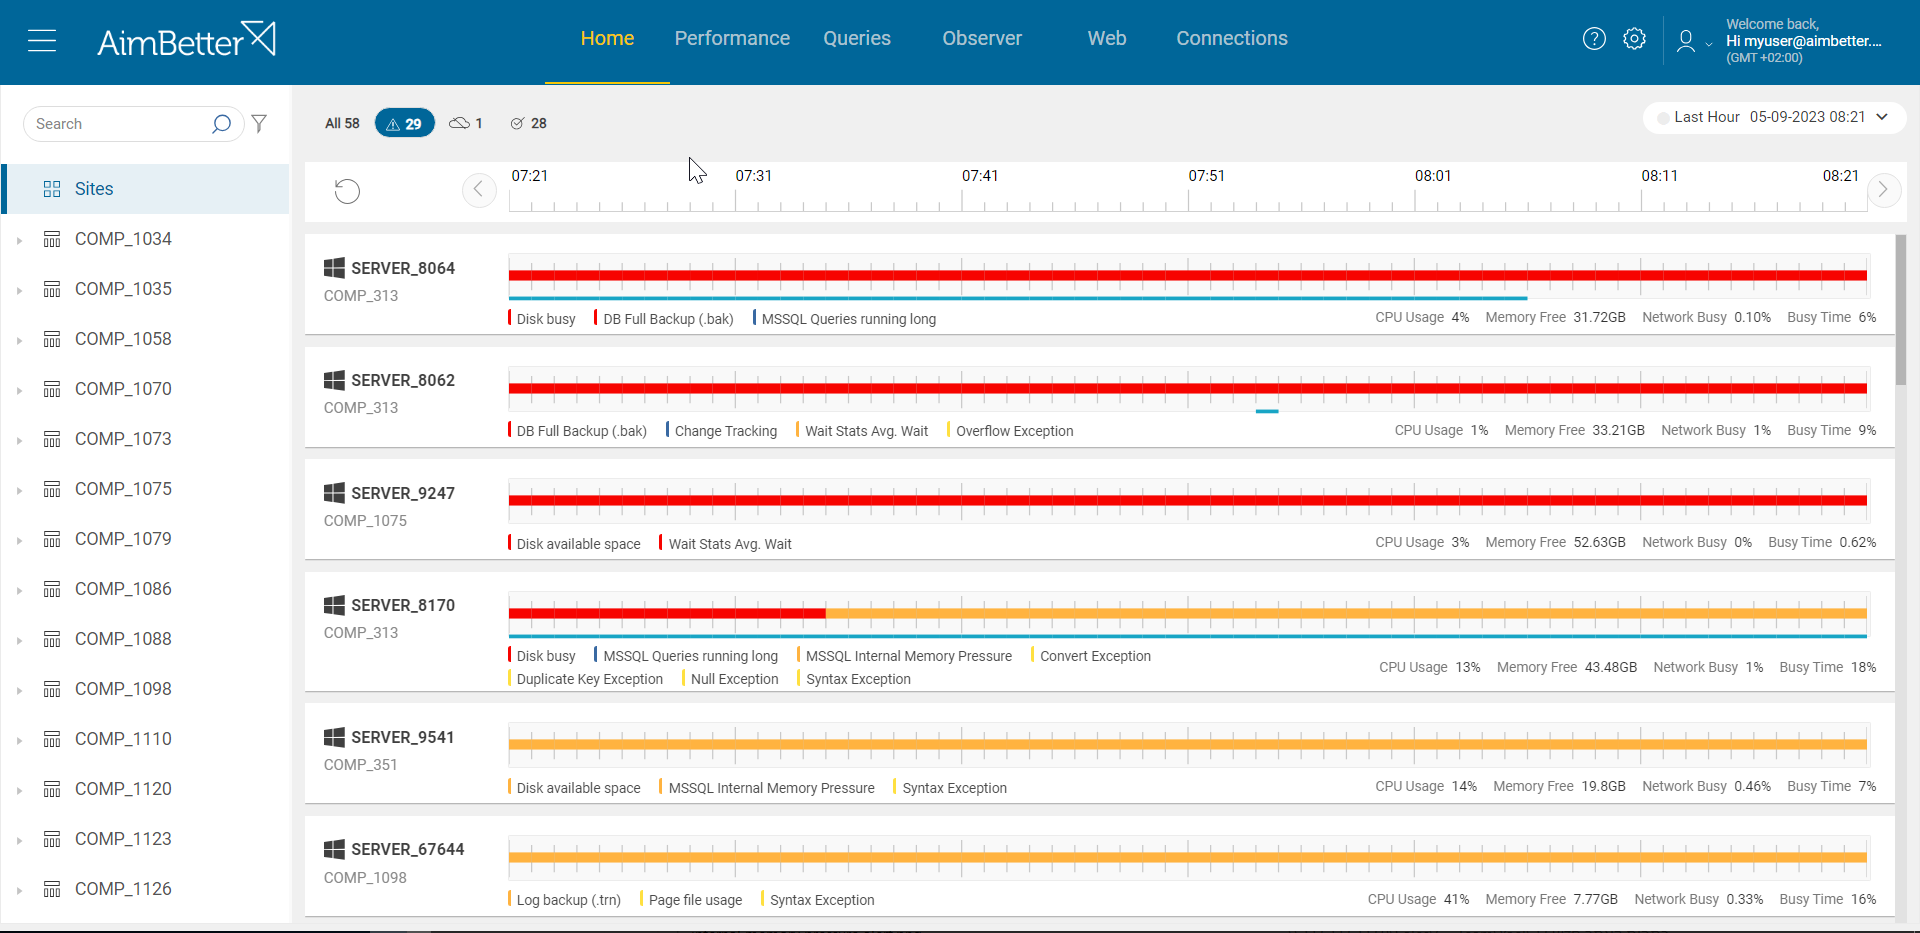
If you monitor servers that their operations are linked, you can view them all from one screen in order to notice abnormalities and degradation in performance.
AimBetter saves you a lot of time tracking these issues on your own and with more data than you would collect by yourself.
Recommended action :
Ensure correct threads(“max worker threads”) and parallelism settings for queries based on your business workload and current resources available.
Review the setting for “Max degree of parallelism” (MAXDOP) and “Cost degree of parallelism” and check if they are set as per best practice recommendations. Before doing that, look for AimBetter alerts relating to SQL Exceptions, especially about any flaws in the query that might cause problems, such as inappropriate data types. Make sure the query seems OK, and the indexes seem suitable.
Next, adjust the settings of cores used and add cores if possible and needed. You should consult with a DBA before implementing changes.
In addition, Analyze the external resources linked to your database server performance with a professional.
3-Maintenance tasks. Priority: Low
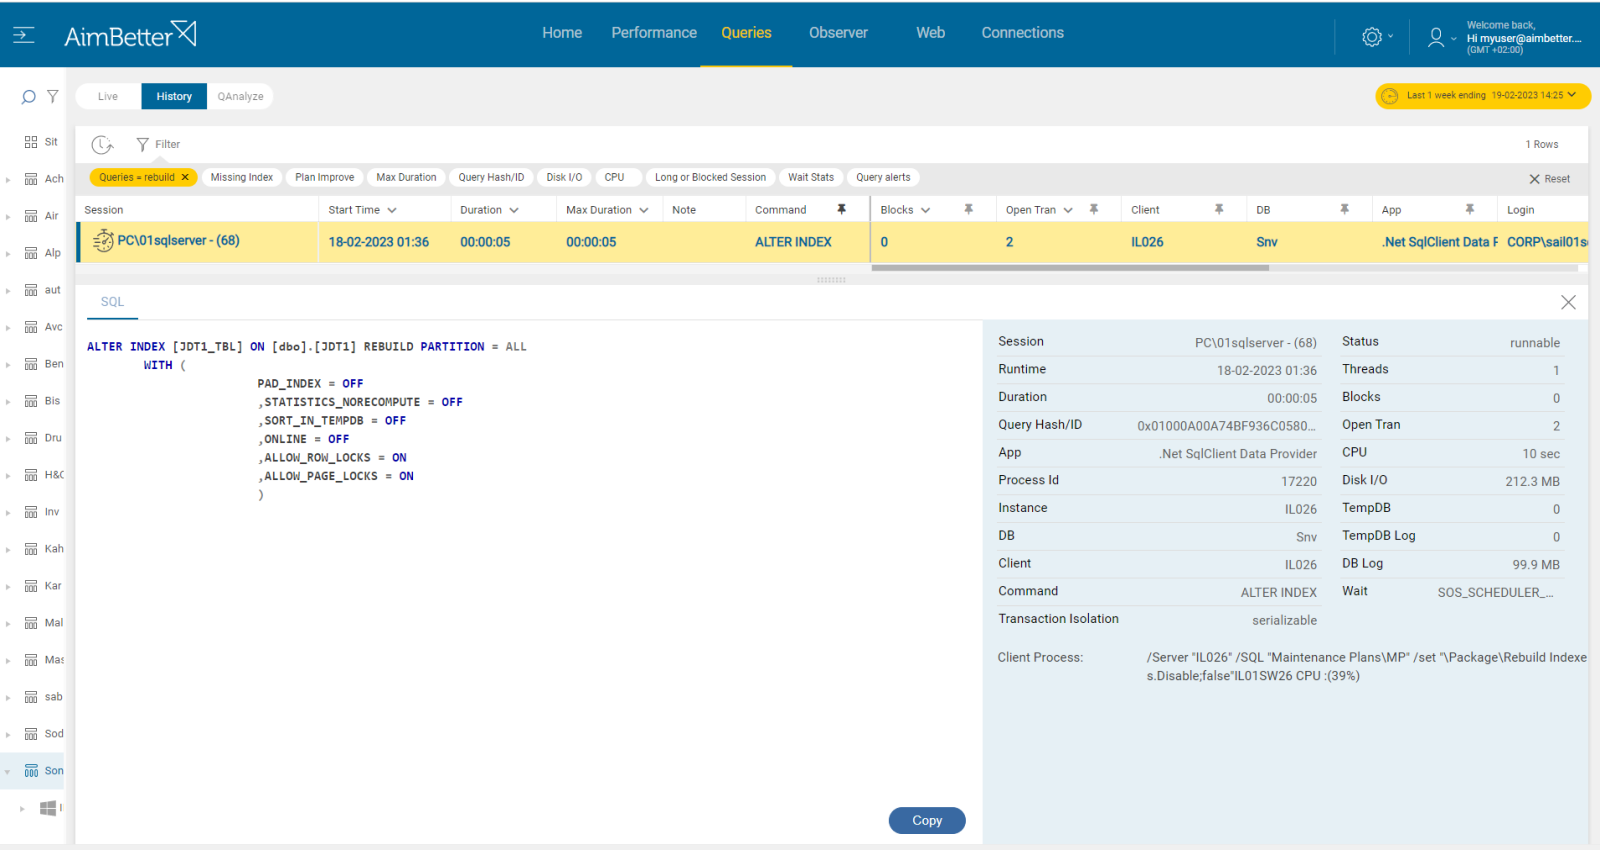
Running maintenance tasks during periods of higher user demand might cause the number of sessions waiting for CPU availability to be higher. Maintenance tasks such as index rebuilds or database backups can cause sessions to wait for CPU resources during these tasks.
Problem identification:
Check the tasks running on a daily schedule and if they consume CPU time on high demand periods.
- Enter the SQL Server Management Studio, go to the maintenance plan, and check for the tasks included. Look for backup tasks, rebuild index tasks, dbcc command tasks, and more.
- Check the routine of the tasks, and check on overload on CPU resources while tasks are running. For this, you may need special scripts and Profiler-like tools which may take long hours.
Recommended action :
We would recommend postponing maintenance tasks to night times or to lower user demand periods.
If needed, implement changes in the procedures, for example, by switching to a strategy in which index fragmentation is analyzed every night and only the fragmented indexes are processed.


