Page Life Expectancy metric measures the average time in seconds that pages stay in the buffer pool. It is closely related to page file usage – see here.
For optimal performance, data should be read from memory rather than disk, which is much slower. SQL achieves this by utilizing memory pages that store the most recently accessed data.
A reserved area of memory (the buffer pool) is available for storing these pages. When the buffer pool is full, and SQL requires new space, the server swaps the oldest page out to the page file on disk and reads in the new data. Increases in the number of swaps between memory and disk directly affect performance.
Sustained low levels of PLE are a strong indicator of SQL Server memory pressure. This pressure may result from high demand or inefficient data organization, both physical and logical.
Find out how you can save hours of work when investigating the root cause of this issue.
Symptoms:
SQL has detected a fall in page life expectancy, producing slower responses.
Impact: Medium
Slow SQL responses will degrade the user experience, resulting in poor efficiency of your organization’s operations.
Expected behavior :
The longer a page can stay in the buffer pool and be read from memory, the better the system performance.
We recommend setting the threshold value at 300 seconds for every 4 GB of Buffer Pool (BP) memory on your server. This means the server should retain any given page in memory (after a process references it) in the buffer pool for a minimum of 5 minutes before it is flushed to disk. If the buffer pool flushes pages in less than 300 seconds, there probably is a problem.
Possible causes:
1- Low CPU capacity Priority: Medium
A continually high usage rate may indicate the need for a CPU upgrade or the addition of multiple processors.
Alternatively, high CPU usage may indicate a poorly tuned application or SQL code. For most servers, CPU Usage of up to 70% is considered acceptable.
Optimizing the application can lower CPU utilization.
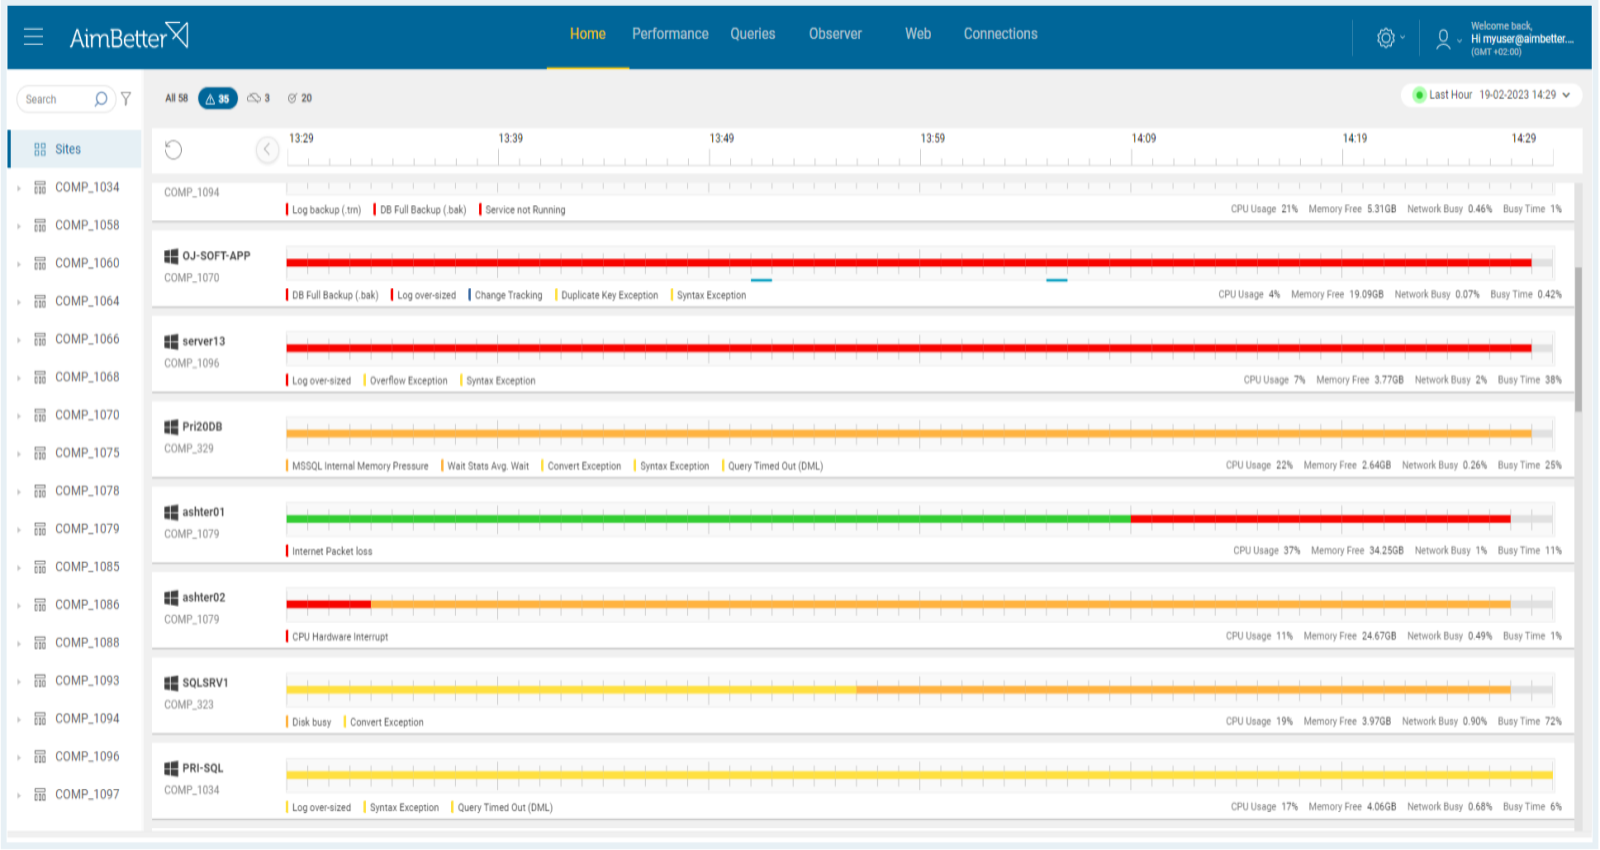
Problem identification:
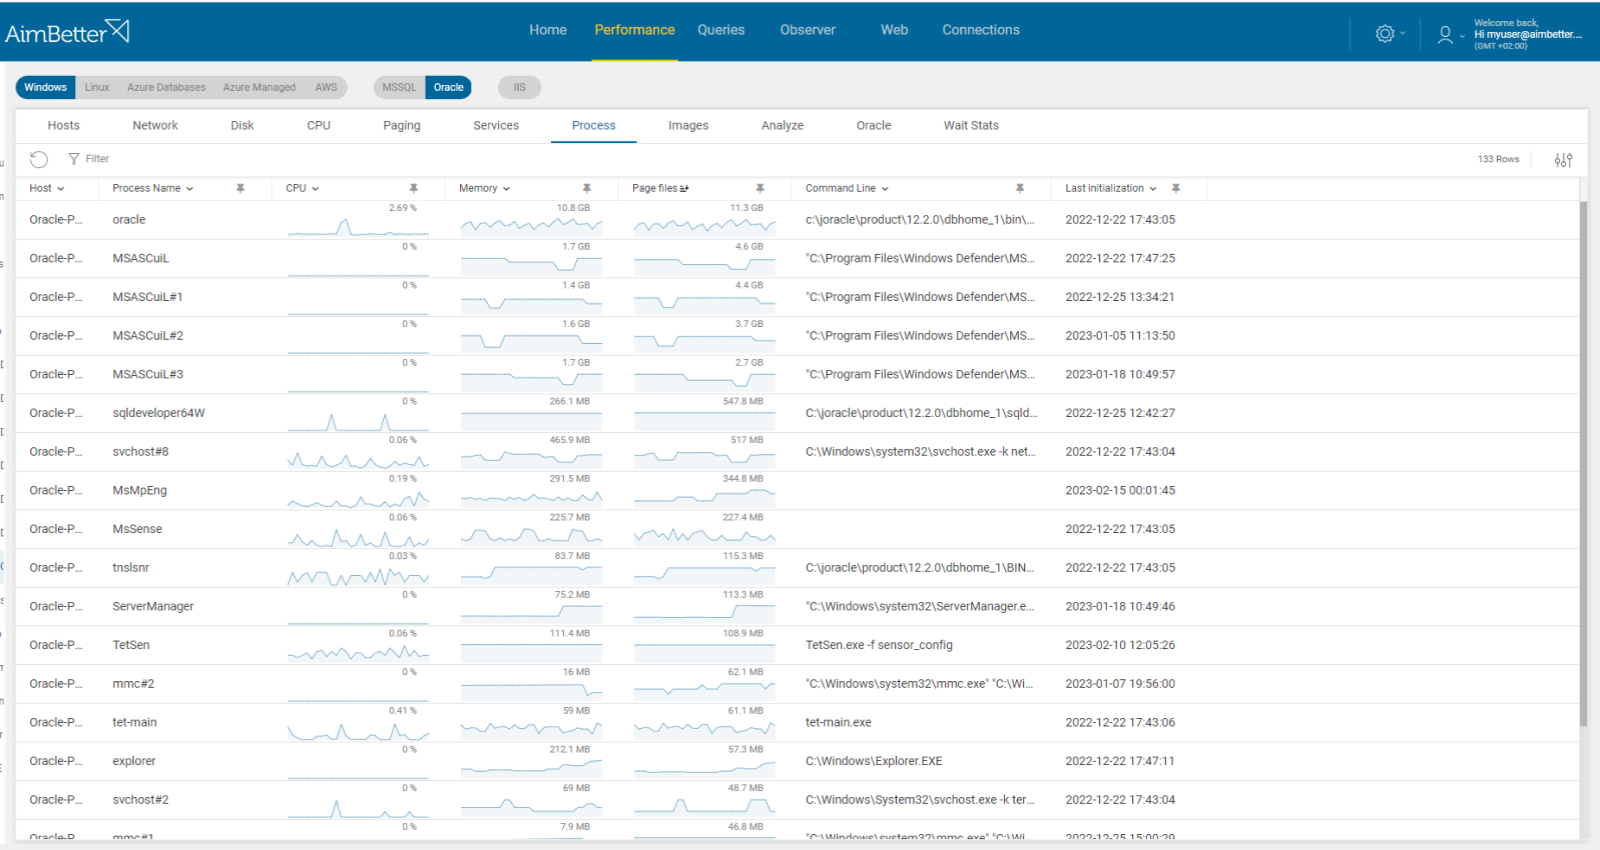
Investigate the CPU usage over time and analyze if there are non-optimal queries that could consume less CPU through plan improvements or indexing.
- Use the profiler or another similar tool to analyze if there is a high CPU usage issue. Beware that this method may heavily load the CPU, and you can’t keep it running for too long because it would cause even more slowness, and the file would consume much disk space.
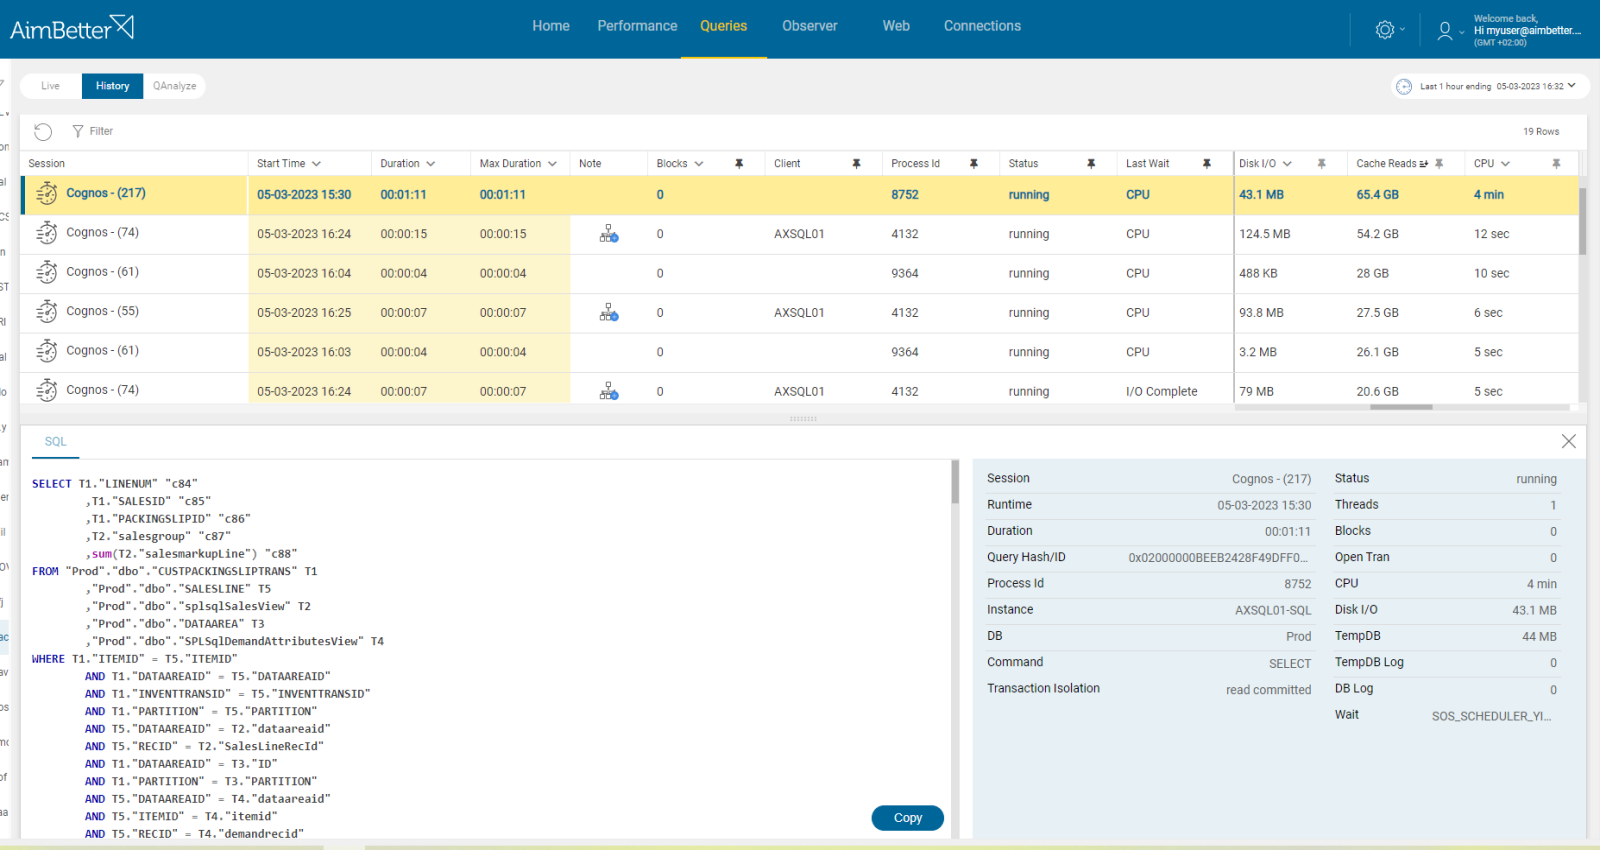
- Identify the queries that are causing the high CPU usage. Use SQL Server Profiler or other performance analysis tools to identify the most CPU-consuming queries.
- Look for a way to optimize the queries by creating appropriate indexes, modifying the query plan, or rewriting the queries. Without any tool that indicates where to focus in order to improve query performance, this task might take hours or days of work.
- Monitor the CPU usage and page life expectancy over time to ensure that the changes made have improved the performance. Probably you would be able only to view the current status with no way of comparing.
Recommended action:
Continually high usage associated with low PLE may indicate the need for a CPU upgrade or additional processors, which might be a costly solution. See our explanation of CPU usage here.
Alternatively, high CPU usage may indicate a poorly tuned application or SQL code. Optimizing the application can lower CPU utilization.
2- Insufficient RAM Priority: Medium
The more memory your server has, the more cached disk reads and writes it can perform. A lack of system memory can cause high non-cached disk reads and writes.
Sustained low levels of Page life expectancy are a strong indicator of SQL Server memory pressure.
Problem identification:
Check the maximum server memory setting in SQL Server, comparing it with the existing total RAM memory.
Compare the ratio of physical RAM to database size – aim for RAM to be equal to or more than 20% of the largest database.
- To compare the maximum server memory setting in SQL Server with the existing total RAM memory, you need to enter the SQL Server Management Studio, log in, and look at the instance properties. Parallelly, enter the task manager and view the current performance, which changes every moment. Here, you don’t have historical data on it.
- Check through an SQL script for the biggest data files.
- Compare the performance of queries using high cache by running a performance analysis. You can use SQL Server Profiler or another similar tool. This action might take at least a few hours, overload your server, and is valid only to the current time; you can’t know what happened days or weeks before.
Recommended action:
If possible, allocate more memory to SQL. Set a value in the ‘maximum server memory’ option of the ‘server memory options’ page that leaves enough memory for the OS.
If RAM is less than 20% of the largest database, configure the SQL Server max memory to utilize all the possible memory without impacting other OS processes.
Alternately, physical RAM can be added to the server, and SQL memory allocation can be increased.
3- Page file busy/slow Priority: Low
The buffer pool swaps pages out to disk when memory space is needed. This process depends highly on the efficiency of data read/write actions to the hard drive and the demand level.
Problem identification:
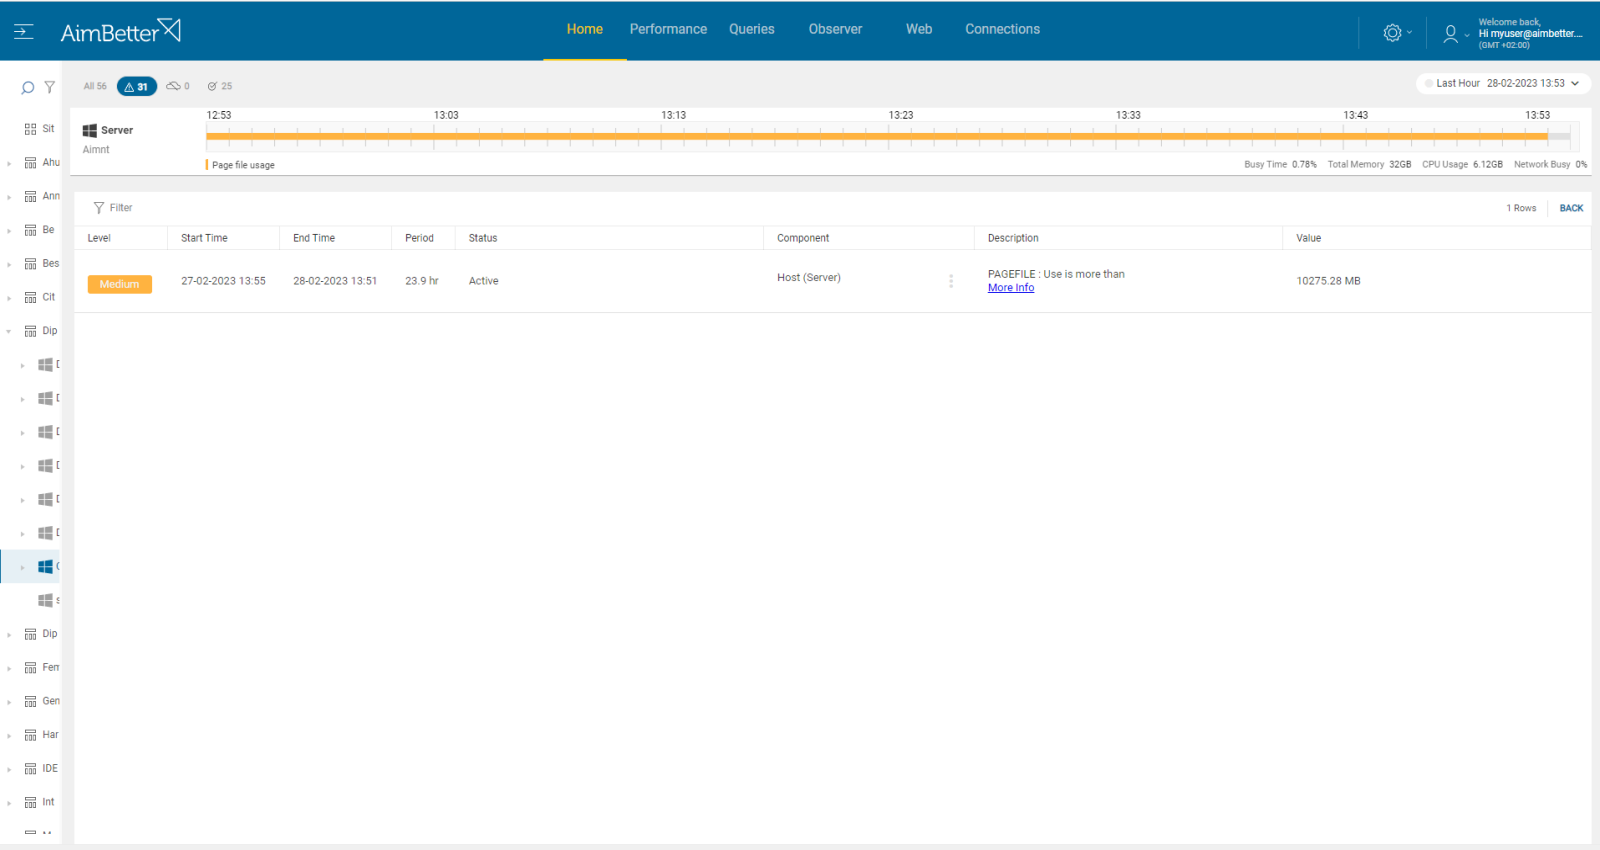
Check if the page file usage consumption is higher than usual.
Check what else is running that might be slowing disk access speed.
- You can use the task manager and resource monitor to check which applications use more memory and more page files. It might be hard to track, and there is a chance that the result won’t be precise since this issue is checked online without a history of events.
- Look for high disk utilization or/and low disk available space. Use task manager or other system tools, and look for programs consuming high disk I/O. Look for slow write/read speeds by running disk benchmarks or monitoring disk activity. However, these checks are not accurate since they relate to the current moment with no history.
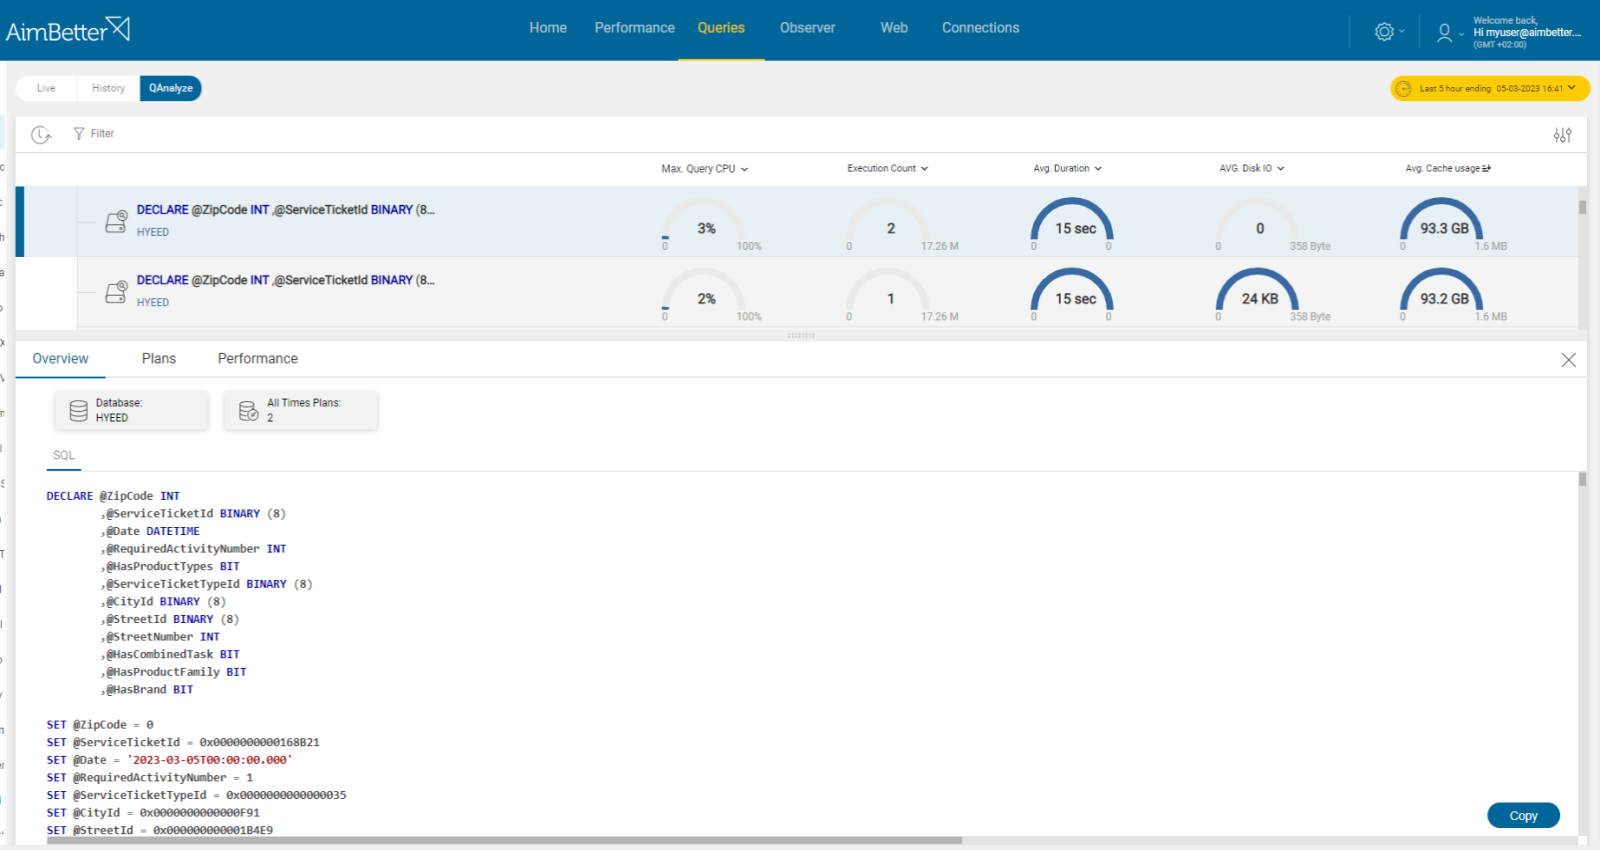
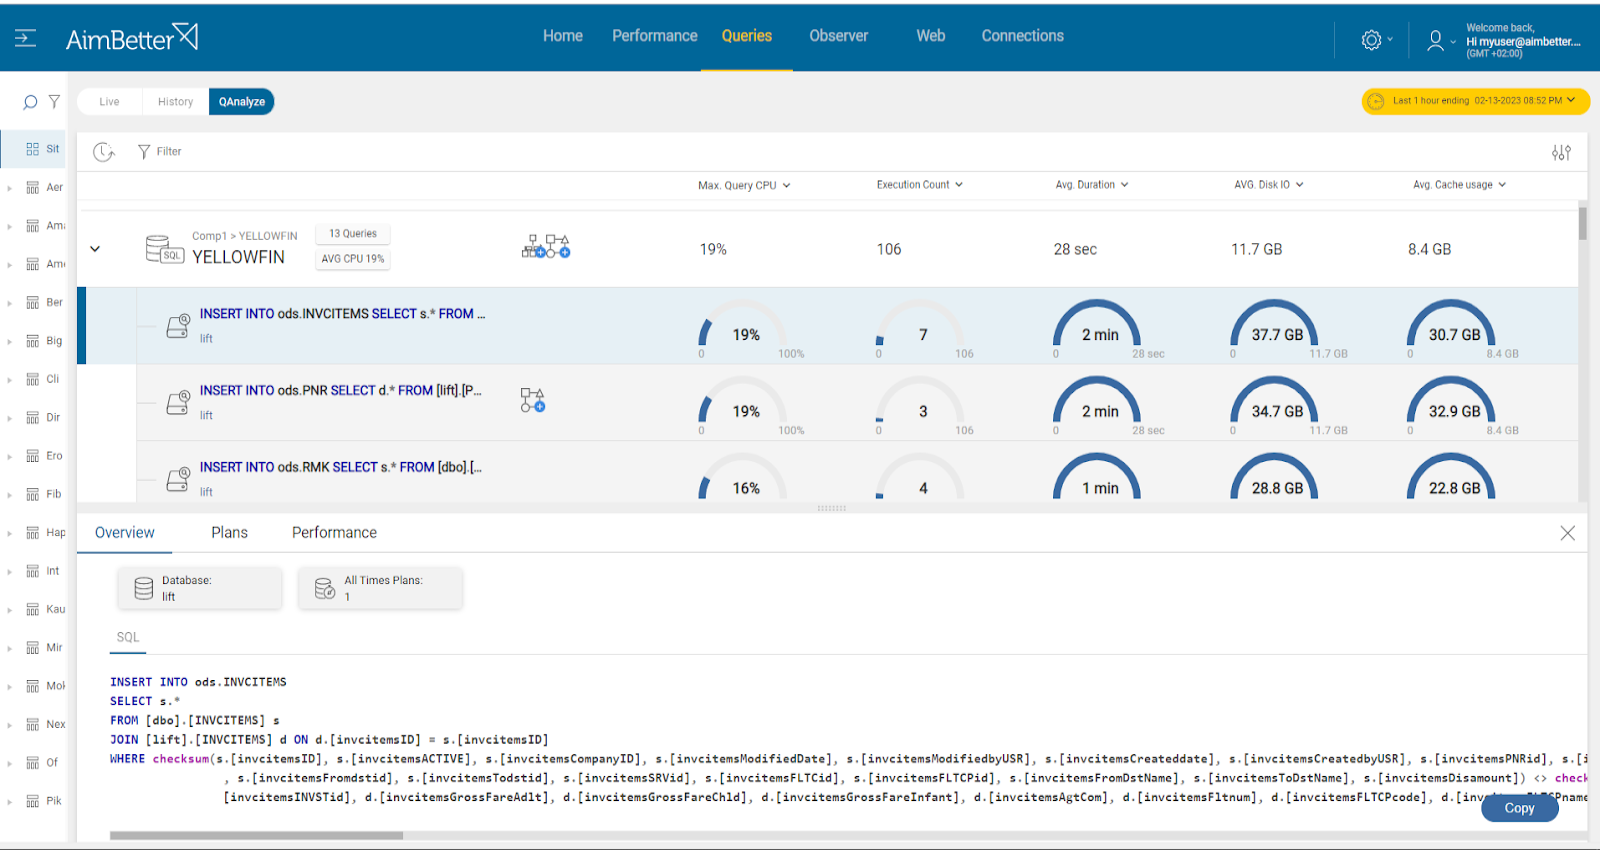
- Identify the queries that are highly consuming disk I/O or Cache memory by running a performance analysis. You should use SQL Server Profiler or any other tracing tools, assisted by the help of a professional DBA.
Recommended action:
You can read more about pagefile use.
To speed up disk I/O and lower latency, locate the page file on the fastest available drive (or upgrade to more efficient hardware).
In addition, try to reduce competition for this resource from other operations.
Consider upgrading hardware if needed.
4- Index missing or corrupt Priority: High
Missing indexes means SQL Server suggests your query could run faster with an index. Corruption is 99% of the time related to disk or disk driver/firmware.
Problem identification:
Investigate missing or corrupt index issues that could improve the buffer cache hit ratio in SQL Server following these steps:
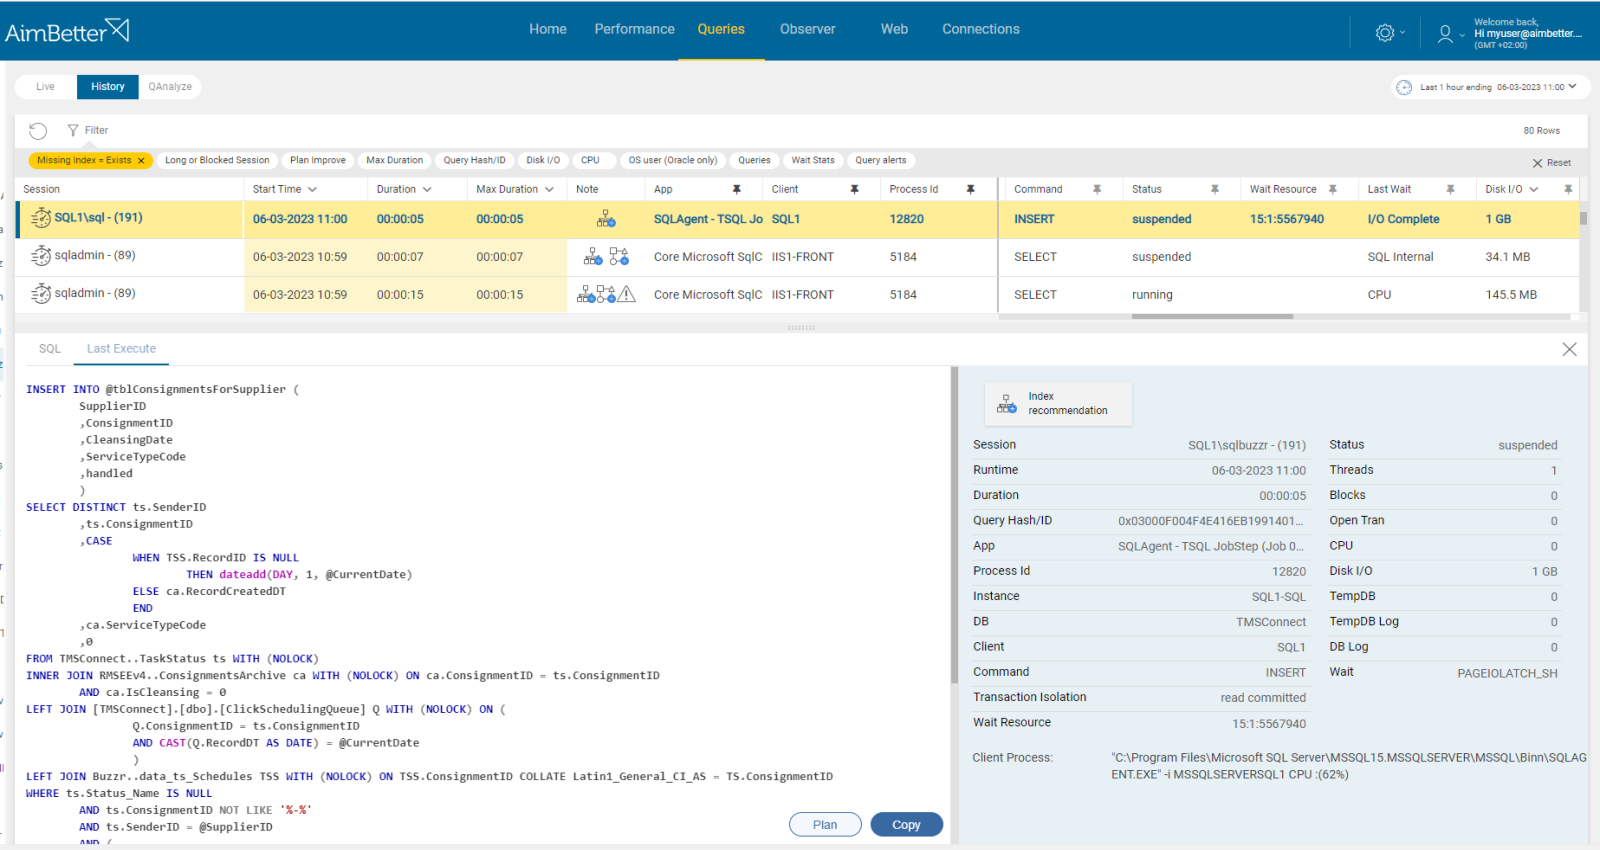
- Identify the missing or corrupt indexes by running a performance analysis. You can use SQL Server Profiler or other performance analysis tools. This step should be done by a DBA, might take hours of work, and you can’t guarantee precise results when checking the online status with no historical events. Read more in this article.
- Think about which appropriate indexes would optimize the queries. You can use the Database Engine Tuning Advisor or other tools to help identify the missing indexes. This mission might be complicated, requiring a highly skilled DBA that can view a complete SQL query plan that might be long and complicated.
- Check the existing indexes for corruption. If any index corruption is detected, rebuild or repair the indexes.
- Monitor the page life expectancy using SQL Server performance counters.
Recommended action:
Using our “missing index” and “plan improvement” recommendations, refer back to your system design team or DBA experts. If you need highly skilled professional DBA services, please contact us.
If your indexes are corrupted, contact your storage management team or our support experts for help. One possible remedy in cases where the corruption is repeating is to clone the database onto a new hardware configuration.
5- Queries saturating the Buffer Pool Priority: Low
We recommend reading more in the next article about Cache hit ratio.
6- DBCC CHECKDB running Priority: Low
CHECKDB is very resource intensive – probably one of the most resource-intensive things SQL Server performs. Introducing this process as an additional IO load on top of the normal SQL Server load means that disk heads will be moving constantly.
Problem identification:
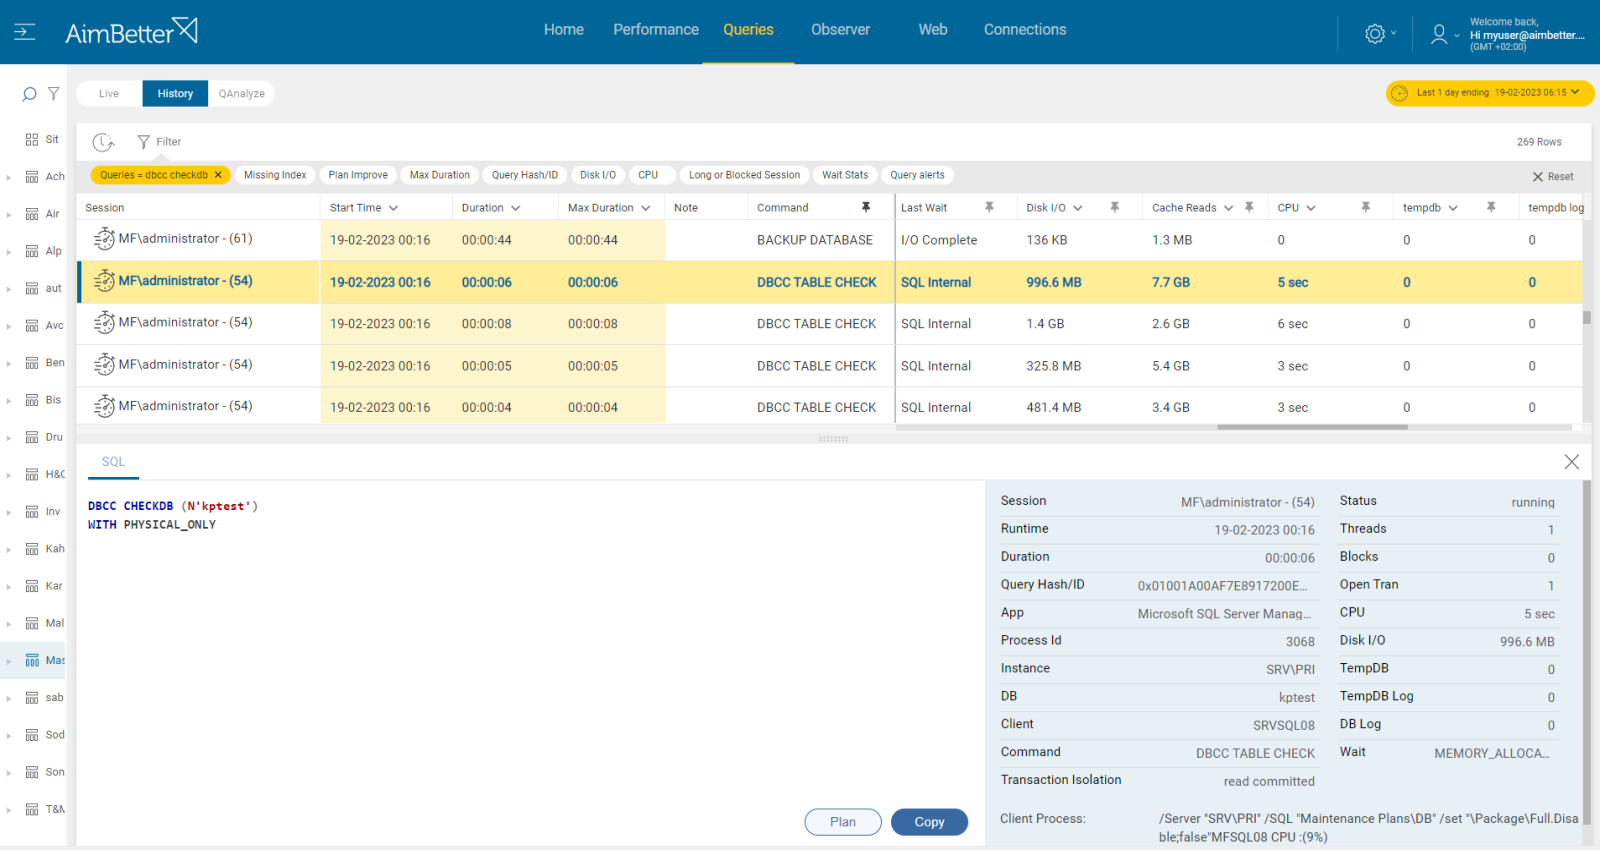
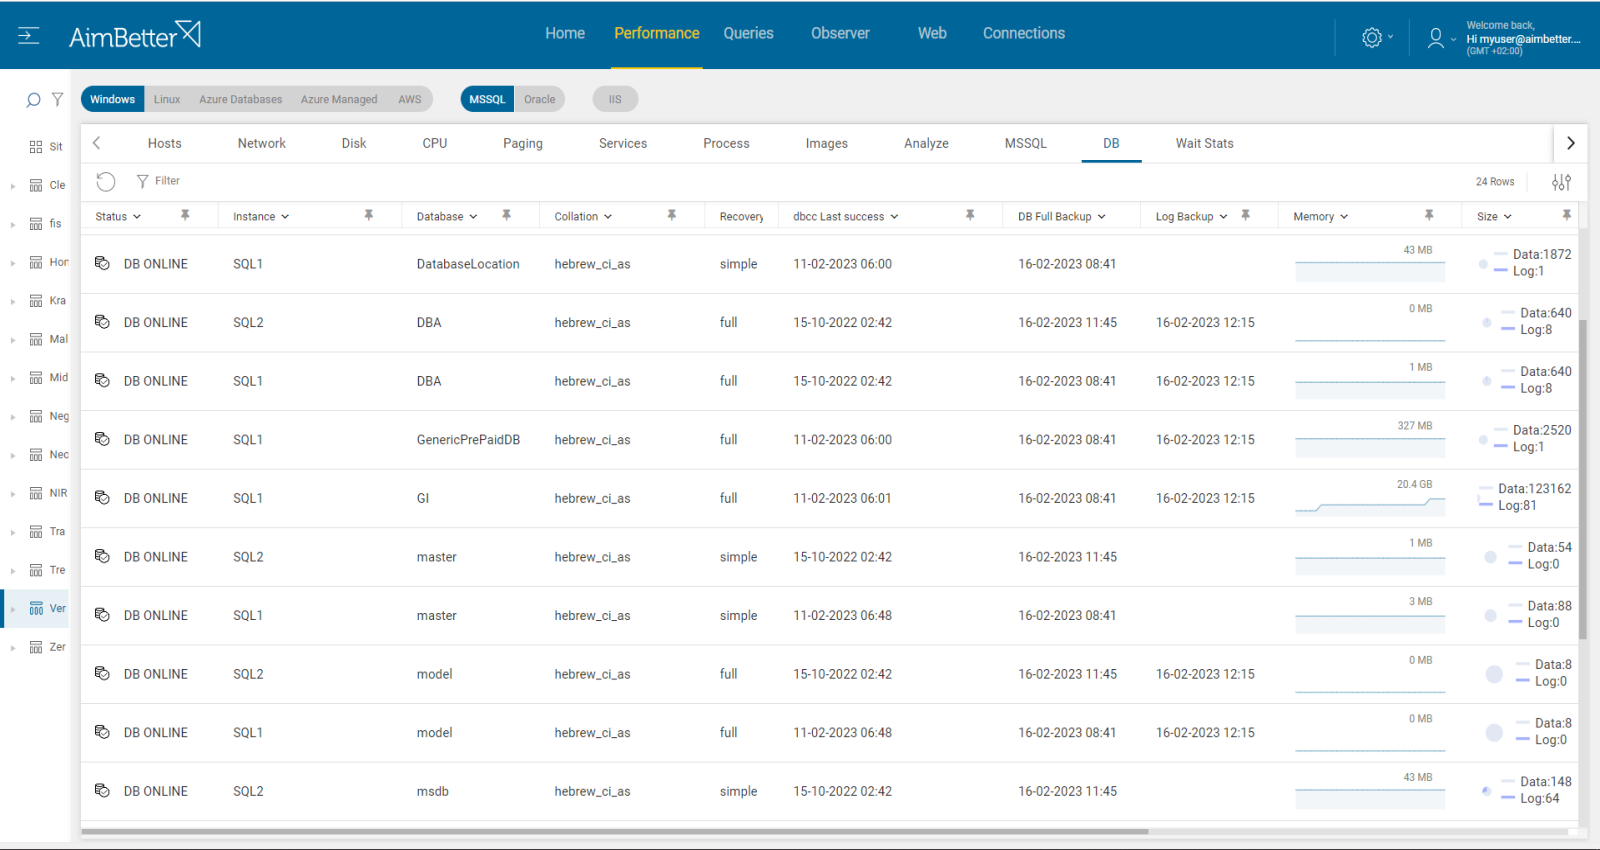
Check if there is a daily schedule running DBCC CHECKDB commands for each Database.
Enter the SQL Server Management Studio, write a script, or check each DataBase manually whether there’s a daily DBCC CHECKDB schedule.
Else, look for a maintenance plan or a job involving DBCC CHECKDB commands.
If there is a daily schedule running DBCC CHECKDB commands, check whether these queries cause a low page life expectancy while this task is running. This might be hard to track.
Recommended action:
We suggest running any essential CHECKDB processes at a time of minimal SQL Server load, or alternatively on backup copies of the databases offline.
7- Index Rebuilds running Priority: Low
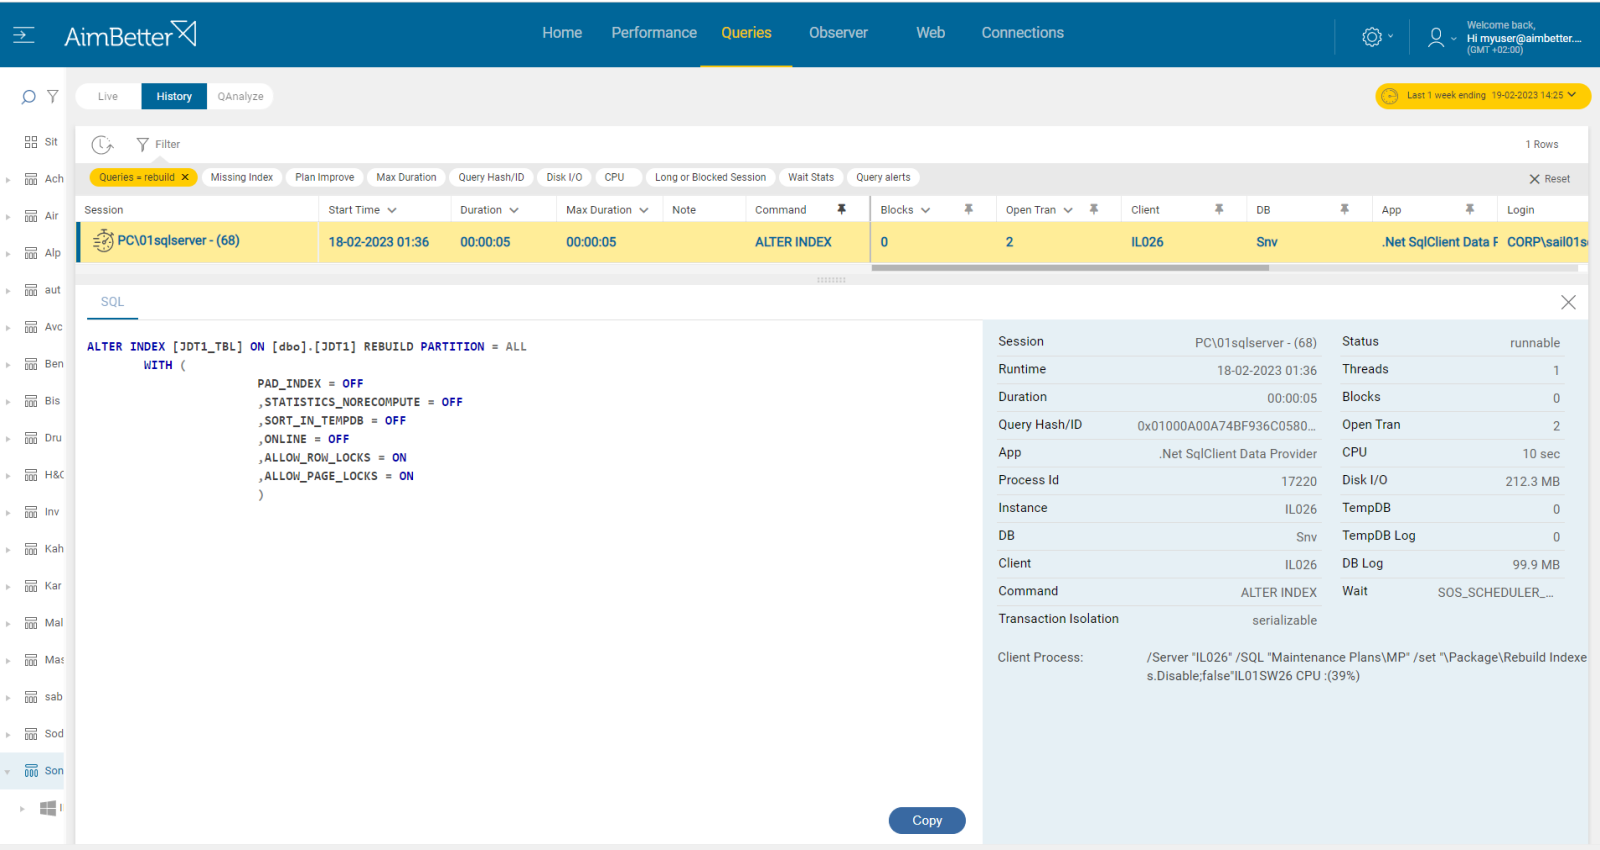
An index rebuild operation will always build a new index, which means extra space is required to build the new index before dropping the old one; a lot of CPU and I/O resources are required, which can overload the system.
Problem identification:
The index rebuild query execution plan is non-optimal to the server’s performance.
- Enter the SQL Server Management Studio, go to the maintenance plan, and check for the rebuild index task existence.
- Else, go to SQL server agent and look for a job doing rebuild index operations.
- Check the routine of the tasks, and check on overload on OS resources commands while this task is running. For this, you may need special scripts and Profiler-like tools which may take long hours.
Recommended action:
If it occurs frequently, it can be corrected by changes in the indexing procedure, for example by switching to a strategy in which fragmentation is analyzed every night and only the fragmented indexes are processed. Our Expert Support Team consultants are available to analyze and assist.


