This metric is intended to identify any case where the transaction log file has grown beyond the planned size. The threshold sets a level beyond which log size triggers a warning. Logfile size is highly dependent on the level of activity, on database backup being performed correctly and frequently, as well as the mode of SQL database recovery.
All user activity that modifies, deletes, or creates data is logged. High levels of user activity, especially in the case of long-running transactions, can cause log files to grow exponentially.
Actions that affect the tempdb size include SELECT statements which use temporary working space to complete the query. Long-running transactions might also fill up tempdb’s transaction log. Tempdb is used implicitly by user transactions for internal objects such as work tables for sorting, work files for hashing, cursor work tables, and row versioning. Even if the user transaction includes only reading data (SELECT queries), internal objects may be created and used under user transactions resulting in the tempdb transaction log being filled.
In the case of long-running transactions where SQL uses this transaction log for recovery purposes, as described above, it has to see back to the start of the transaction. Where a transaction takes a long time or does a lot of changes, the log cannot truncate on the checkpoint for any changes that are still in open transactions or have started since that transaction started. Example: A delete of multiple rows in one statement is one transaction, and the log cannot do any truncating until that whole delete is done. In Full Recovery mode, this delete is logged, which could be a large volume of log records. Poor transaction management and not watching for and closing open transactions can quickly expand the log file.
Find out how you can save hours of work when investigating the root cause of this issue.
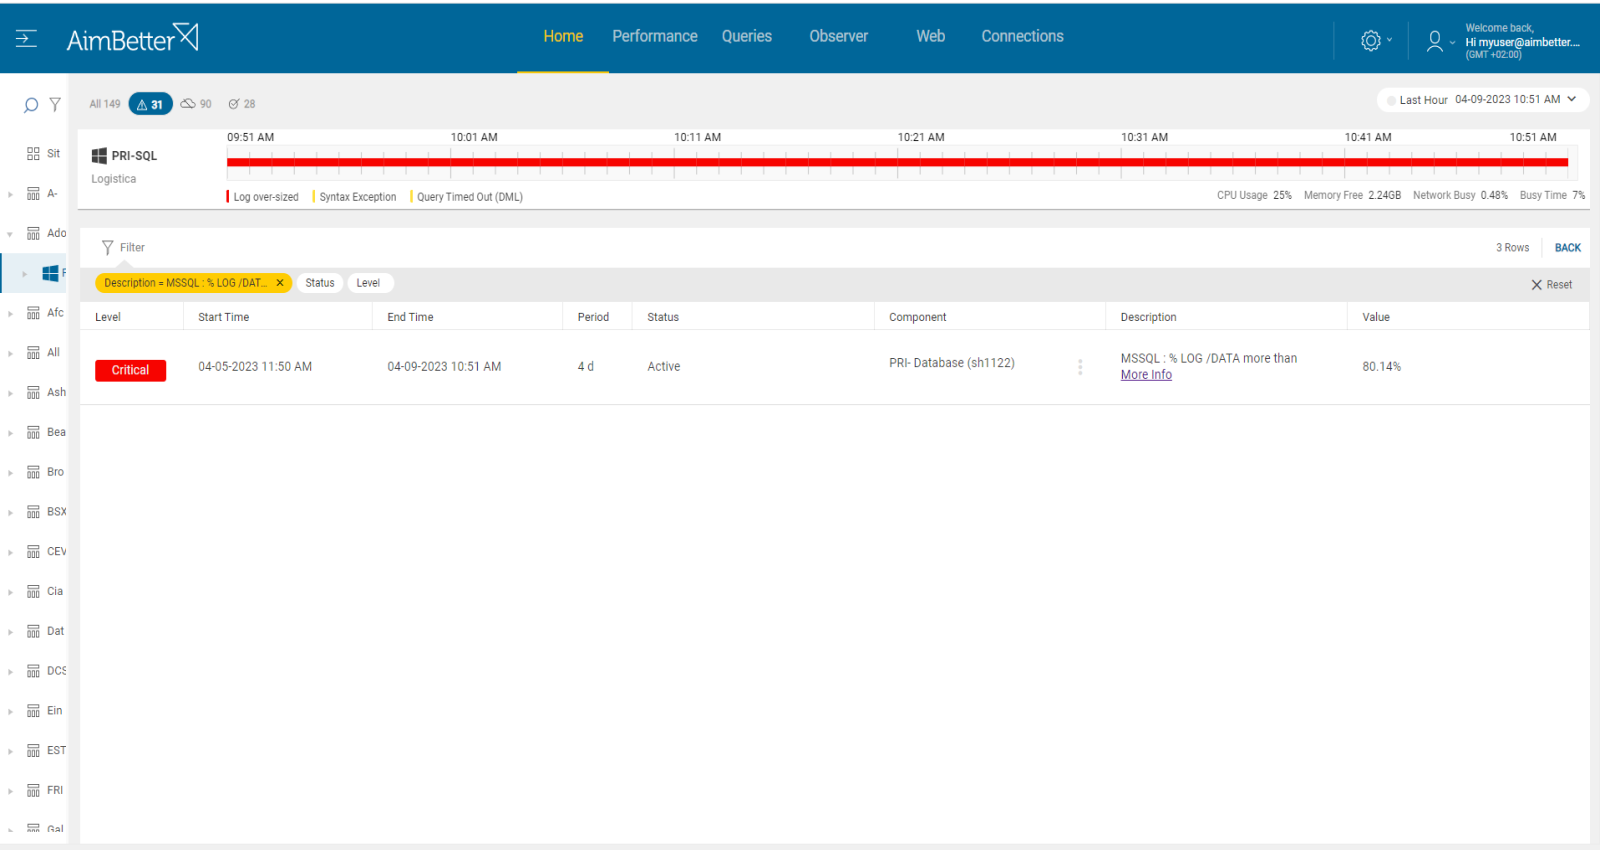
Symptoms
The transaction log size relative to the database size has grown larger than the threshold ratio.
Impact: High
If uncontrolled, log files can consume all available disk space, leading to a system crash. As well, as the log gets larger, the potential for more downtime when recovering from a disaster increases. If the entire database is destroyed, restoring from backups involves recreating the data and log files. The larger the log file is, the longer this takes.
The further impact may be seen from the effect on page file usage. As logs grow in memory and reduce overall available space, page life expectancy may fall substantially.
Expected behavior
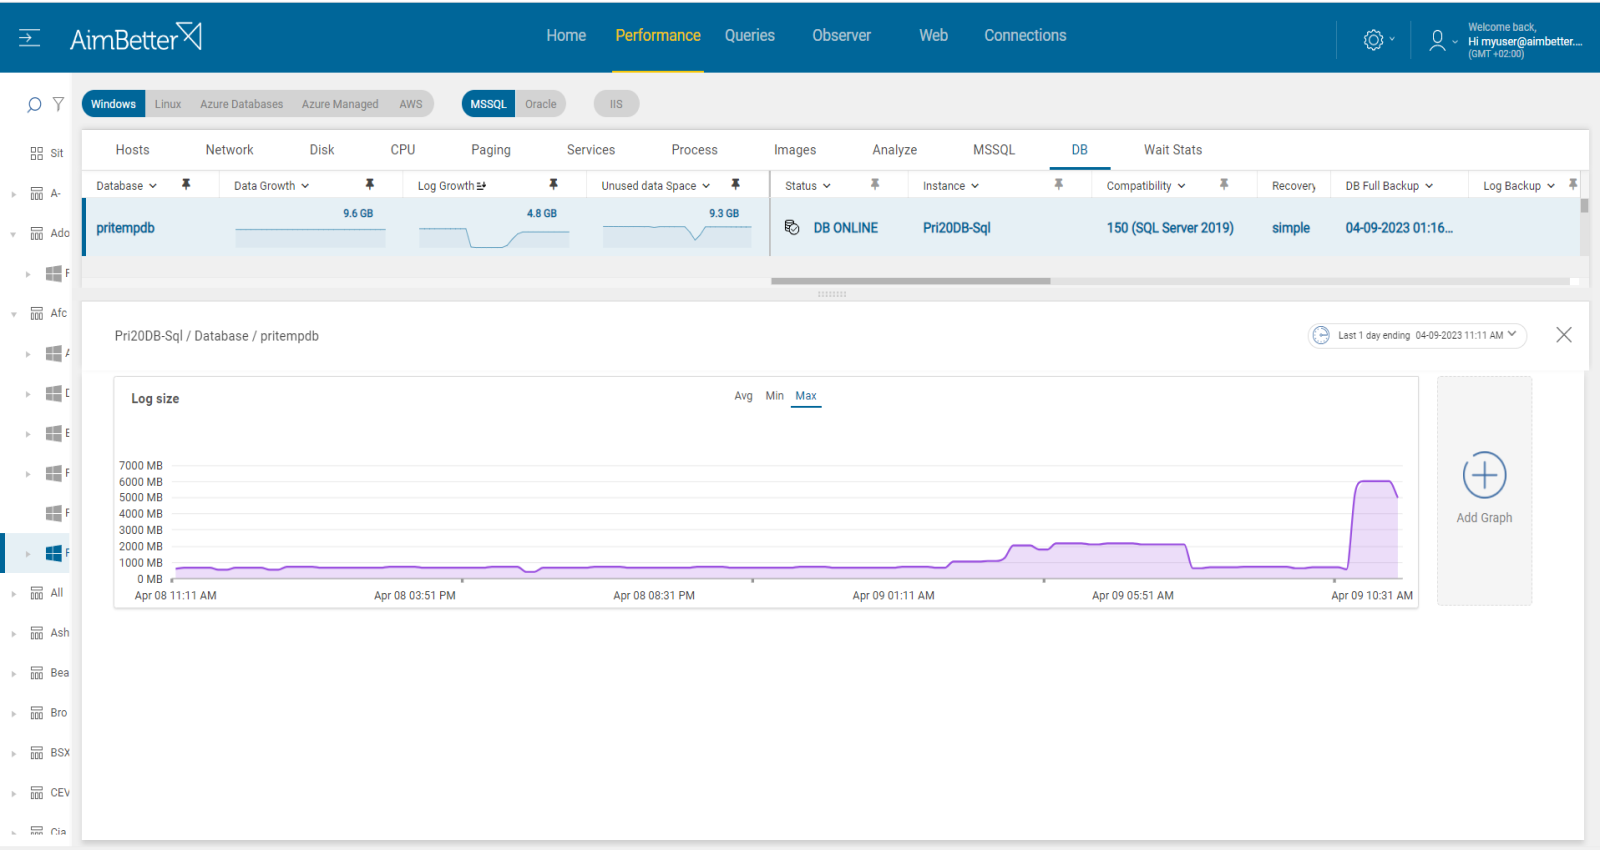
This value should be calculated combined with both total log disk space(.ldf files), log backups disk space, and slow executions and compared to data file size(.mdf file). Log % should be less than 50% in small DBs or less than 5GB in big DBs.
Possible causes
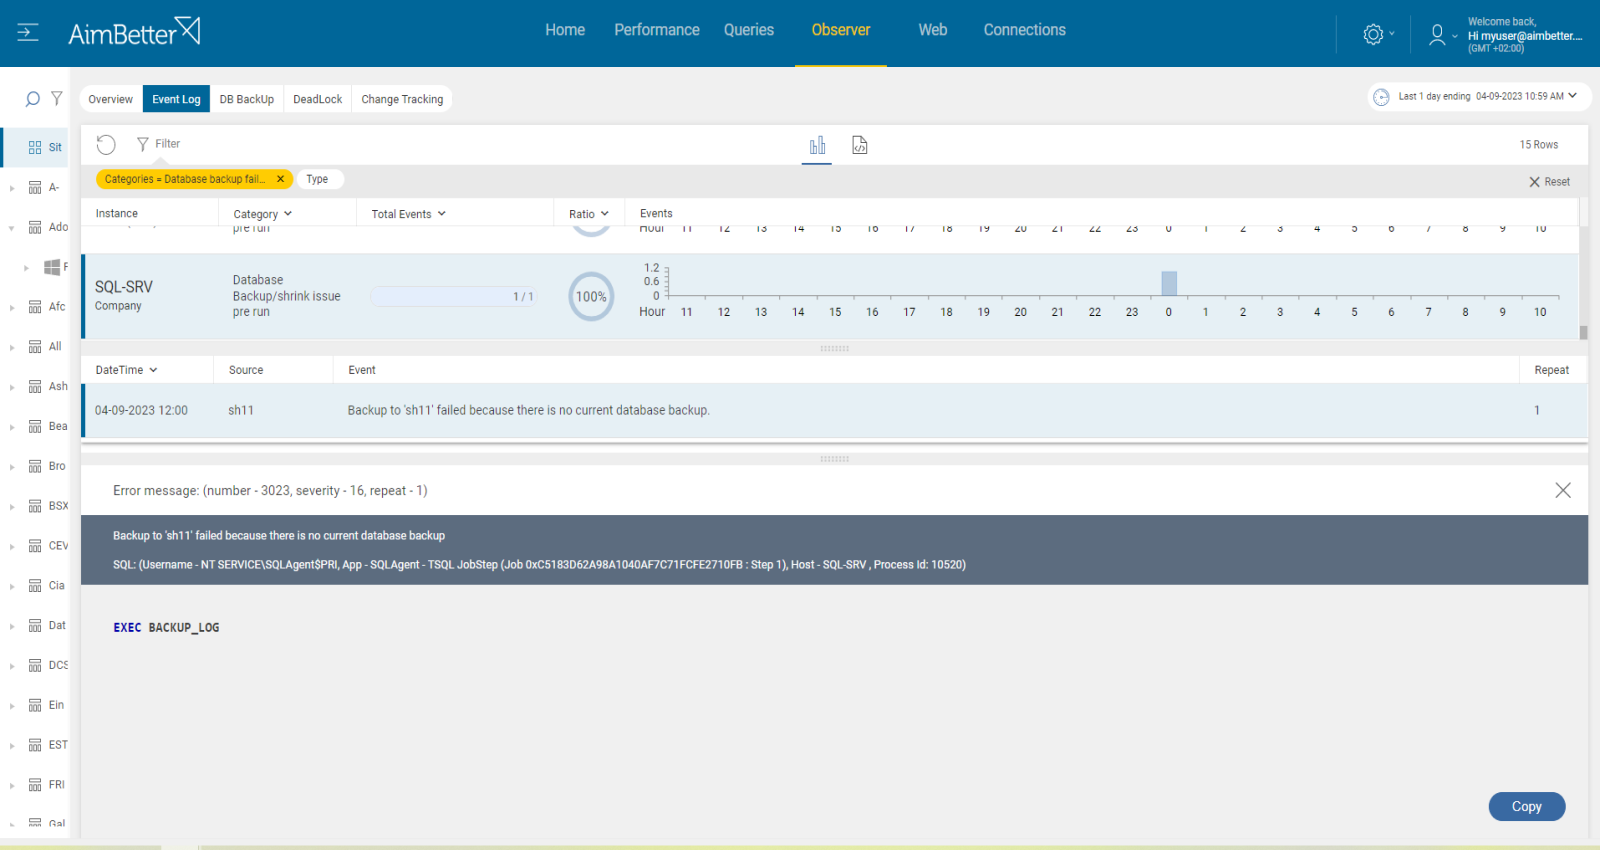
1- Backups failing or incorrectly scheduled Priority: High
Once databases in SQL Server are configured with the full recovery model, the transaction log file will continue to grow until a backup is taken. Therefore, transaction log backup should be scheduled in order to avoid log growth. In addition, failure of backup (especially in Full Recovery mode) will result in continual log growth.
Problem identification:
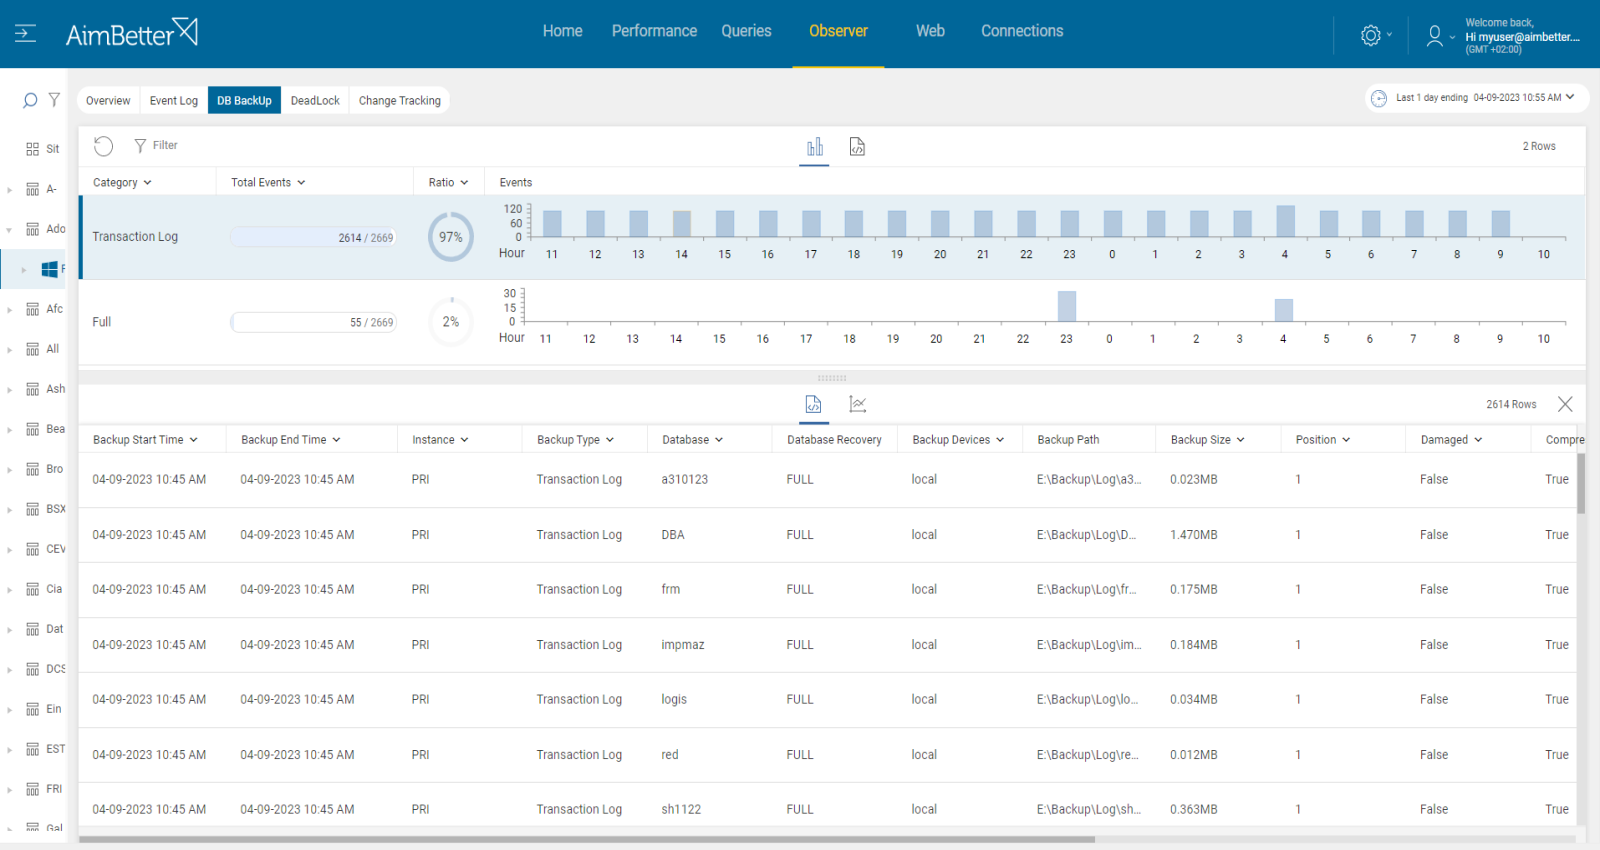
Check for the last backup date of the transaction log backups.
1. Identify which databases are in full recovery model and have log file growth. For that, you should use a script or check manually in DB properties or check manually in file explorer (when knowing the correct path) searching for .ldf extension. For Linux, you can try using the next command(fill it with correct details): find /path/to/search -type f -size <size>
2. There are several ways to identify the missing backups of the transaction logs:
- Open SQL Server Management Studio and connect to your SQL Server instance. Expand the “Management” folder and right-click on “Maintenance Plans” and select “Maintenance Plan Wizard” from the context menu. When selecting maintenance tasks, look for BackUp Database Task and specify the database for which you want to check the last backup date of the transaction log. View the history of maintenance plans and look for a list of all the transaction log backups performed for the selected database.
- Alternatively, you can use T-SQL to check the last backup date of the transaction log by running a script.
- Otherwise, if you acknowledge the correct transaction log backups folder, search in there for the last log backups of the databases.
Recommended action :
Review your backup schedule, and run any missing backups. Change the recovery model of full recovery model databases to simple if high routine backups are not needed. See our recommendation for dealing with backup problems here.
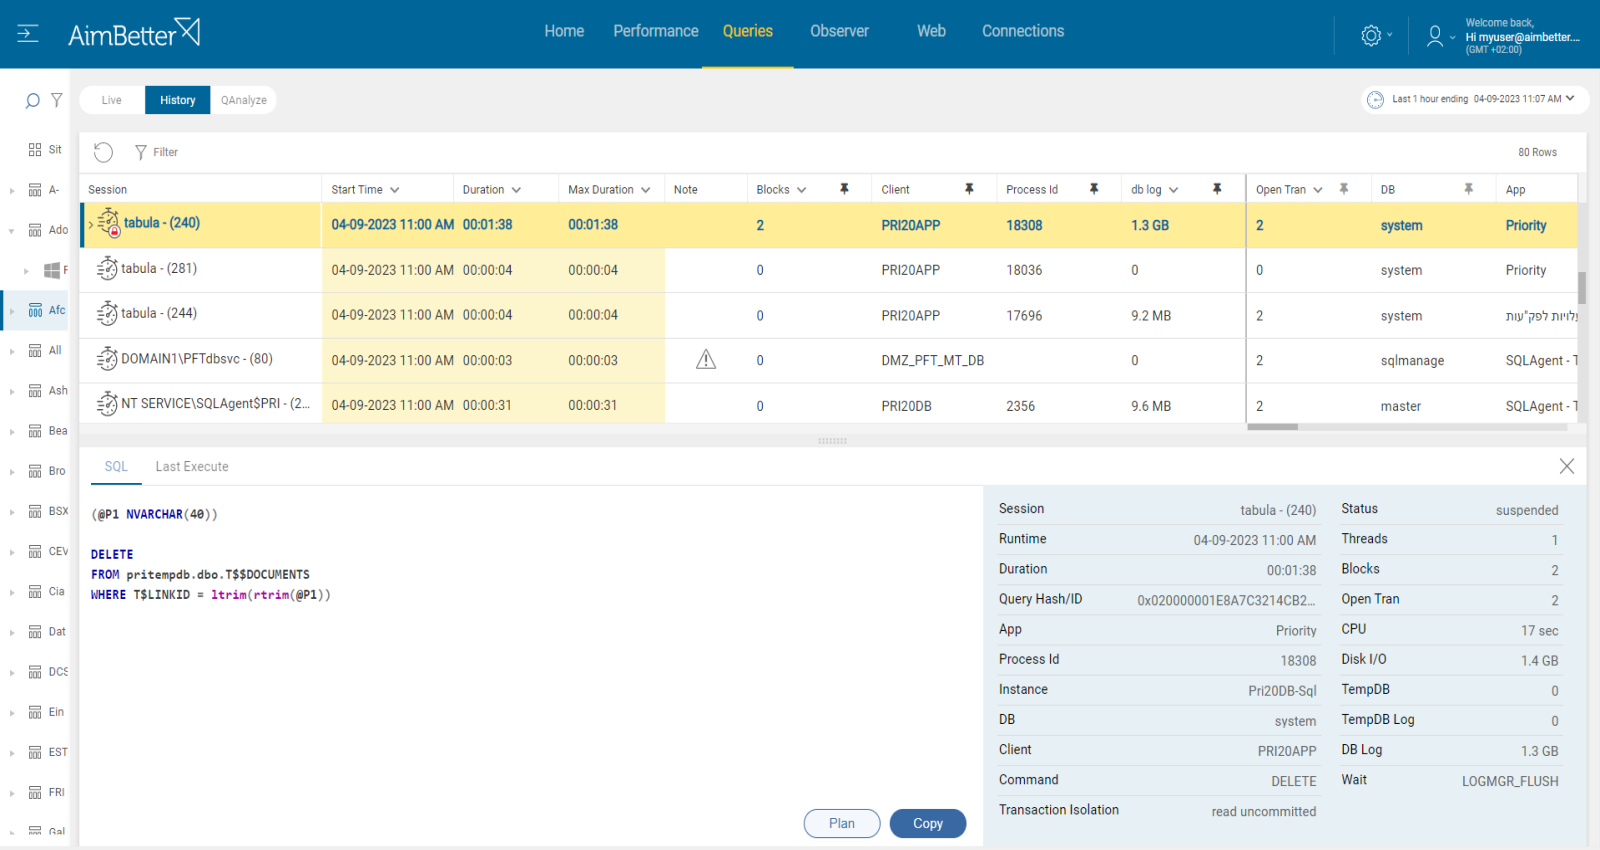
2- Long-running transactions Priority: Medium
Each transaction running in SQL Server is recorded in the transaction long. Once the transaction is large, it can take a high volume from the log file.
If a transaction takes a long time to complete, it will occupy space in the transaction log until it is finished. The growth of the log file is usually gradual and increasing as long as the transaction is open and active.
Problem identification:
Look for active transactions in SQL Server when trying to identify the session id, execution time, source, performance, and databases involved.
1. In the SQL Server Management Studio, write a script searching for active transactions and their details, such as the session ID, transaction ID, start time, transaction type, and transaction state.
2. Try to identify which of the queries affect the database’s log file. It might be hard to do, requiring a skilled DBA that knows how to do it.
3. Look for a way to improve the query execution plan; you should also consider using indexes. It might take time, even for a highly skilled DBA.
Using our solution, it’s easy to identify long-running and larger transactions.
In one screen, including valuable filters, you have all details required: SPID, login, execution time, number of open transactions in a single session, resources consumption, query plan, recommendation to change query’s plan, affected databases, size of log growth, status, and more.
Recommended action :
Properly size your log file and disk capacity to account for a worst case scenario (e.g maintenance or known large operations). Optimize the application code – avoid starting a transaction in your application that is having long conversations with SQL Server, or risks leaving one open too long.
See our recommendations regarding long queries here.
3- Low disk space: Priority: High
In some cases, the business routine requires that the log files of a specific database are always consumed at some volume. Sometimes the source of the issue is not the oversized log file itself but the too-low volume of disk space allocated to transaction log activity.
Problem identification:
1. Identify the oversized database files. You should use a script or search for it manually in DB properties.
2. Use tracking tools such as SQL Server Profiler in order to identify the routine performance of queries and check if the performance of the queries is considered good. Take into account that you should do several executions and follow them for days in order to characterize the routine queries.
3. If any issues are not found, then the source of the issue might be allocated to the disk of the log file (.ldf extensions).
4. Compare whether the disk’s total volume is low or the disk is taken by heavy files that are not related to SQL Performance. Using programs, try to identify if this status is recent or routine.
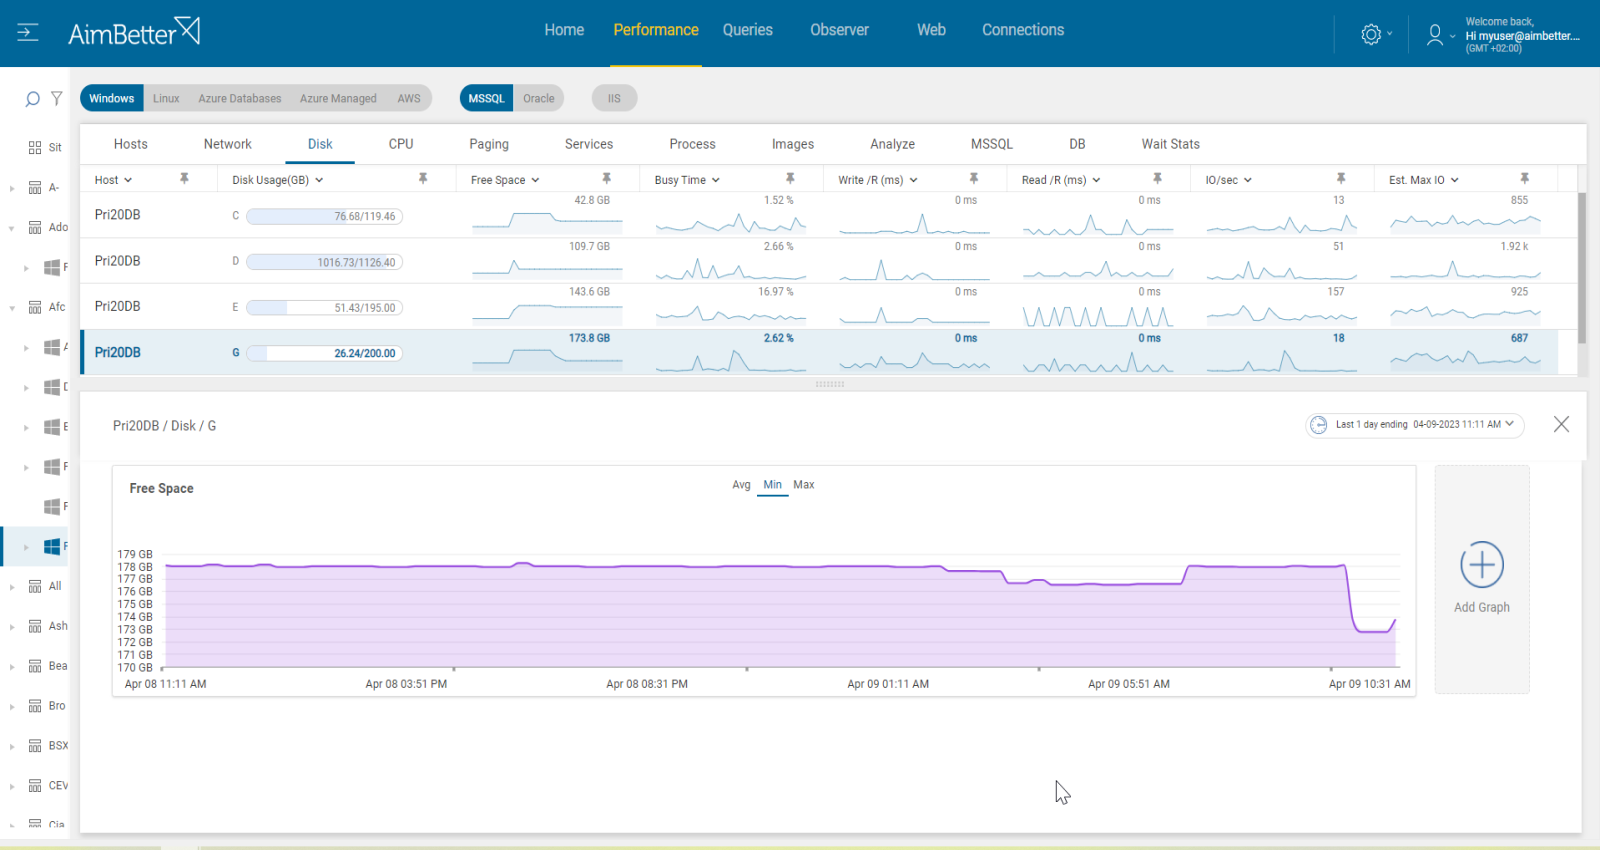
Our tool provides a notification once the disk space is low, you can follow it over time using graphs and identify causes for lower disk available space.
Identify routine queries using one screen which provides you data for at least a month, with all details required of queries running in the server.
Identify easily the allocated disk to log files of databases.
Recommended action :
Consider replacing the allocated disk with a log file. It’s required to be done in a time frame when downtime is possible.
Consider deleting unnecessary files (that are not SQL activity related) or transferring them to other drives.
4- Incorrect buffer pool allocation Priority: Medium
As free memory is consumed, pages residing in the memory are swapped out to disk to be replaced by needed data. See our explanation of page life expectancy here.
In SQL Server, data is stored in 8 KB pages. When data is required for input/output, the page is first read from the disk and stored in memory. The area allocated is called the Buffer Pool. Once a page is loaded into the pool, all subsequent access is very fast and efficient, whereas disk I/O is relatively slow.
Problem identification:
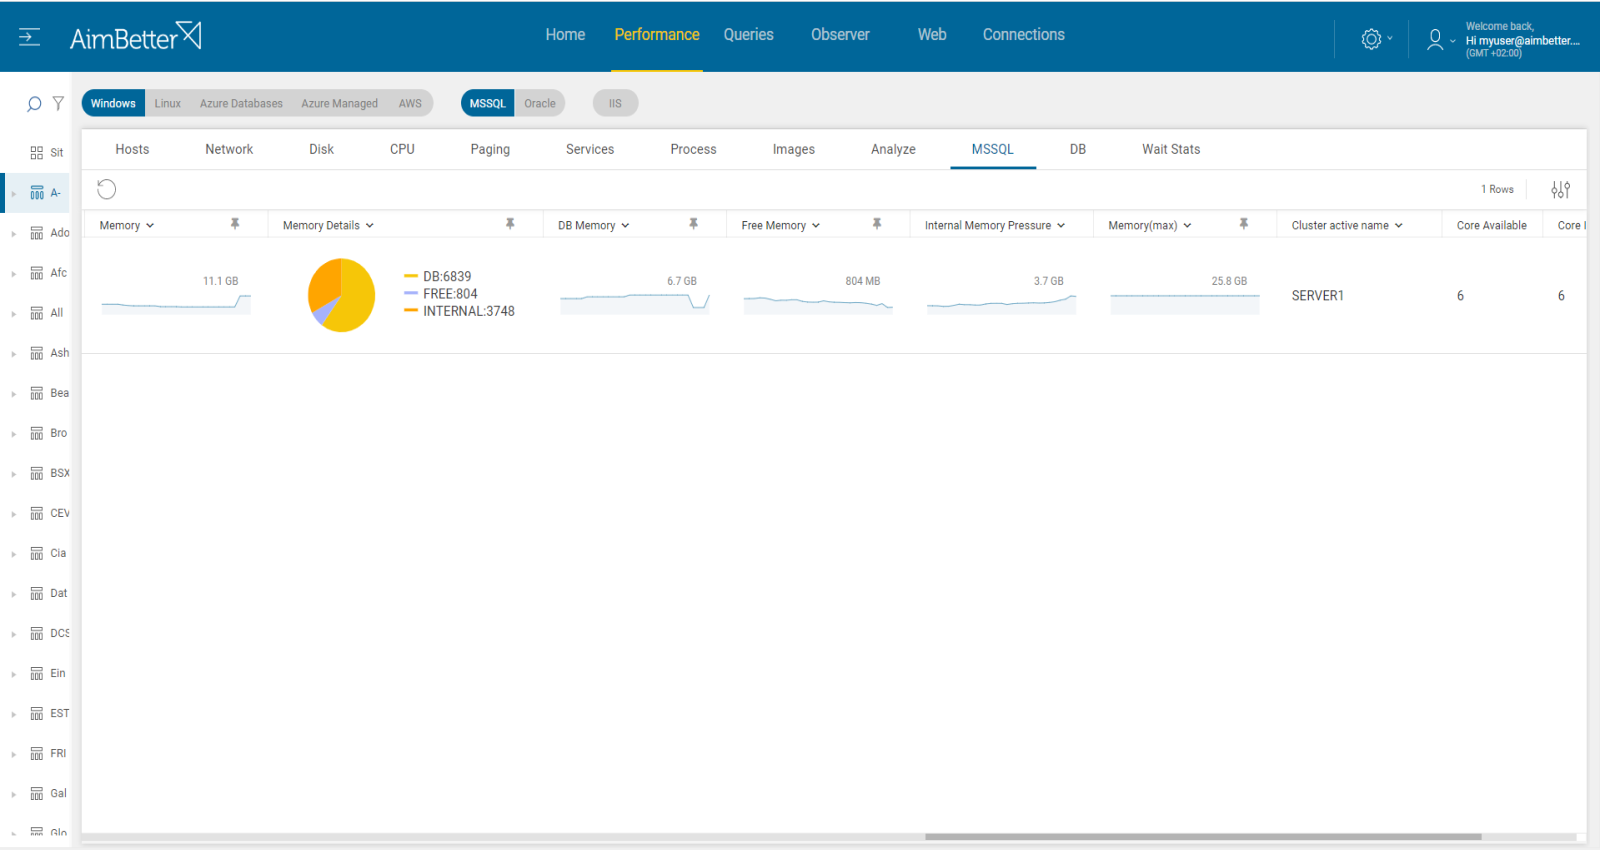
Check the maximum server memory setting in SQL Server, comparing it with the existing total RAM memory.
Compare the ratio of physical RAM to database size – aim for RAM to be equal to or more than 20% of the largest database.
Check the performance of queries saturating the buffer pool.
1. To compare the maximum server memory setting in SQL Server with the existing total RAM memory, you need to enter the SQL Server Management Studio, log in, and look at the instance properties. Parallelly, enter the task manager and view the current performance, which changes every moment. Here, you don’t have historical data on it.
2. Compare the performance of queries using high cache by running a performance analysis. You can use SQL Server Profiler or another similar tool. This action might take at least a few hours. It overloads your server and is valid only to the current time; you can’t know what happened days or weeks before.
3. Look for a way to optimize the queries by reducing the data they retrieve or tuning their execution plans. This mission might be complicated, requiring a highly skilled DBA that can view a complete SQL query plan that might be long and complicated.
You’ll be immediately notified if there are long-running queries by our solution or if the problem is a lack of memory dedicated to the SQL Server.
The source of this issue is clear!
For performance improvement, simply check our recommendation for missing indexes or plan improvements and save hours of work looking for the source cause of this issue.
Recommended action :
Correct the buffer pool allocation by allocating more memory to SQL, if possible. Set a value in the ‘maximum server memory’ option of the ‘server memory options’ page that leaves enough memory for the OS itself. Otherwise, add RAM memory..
See our explanation of page life expectancy here.
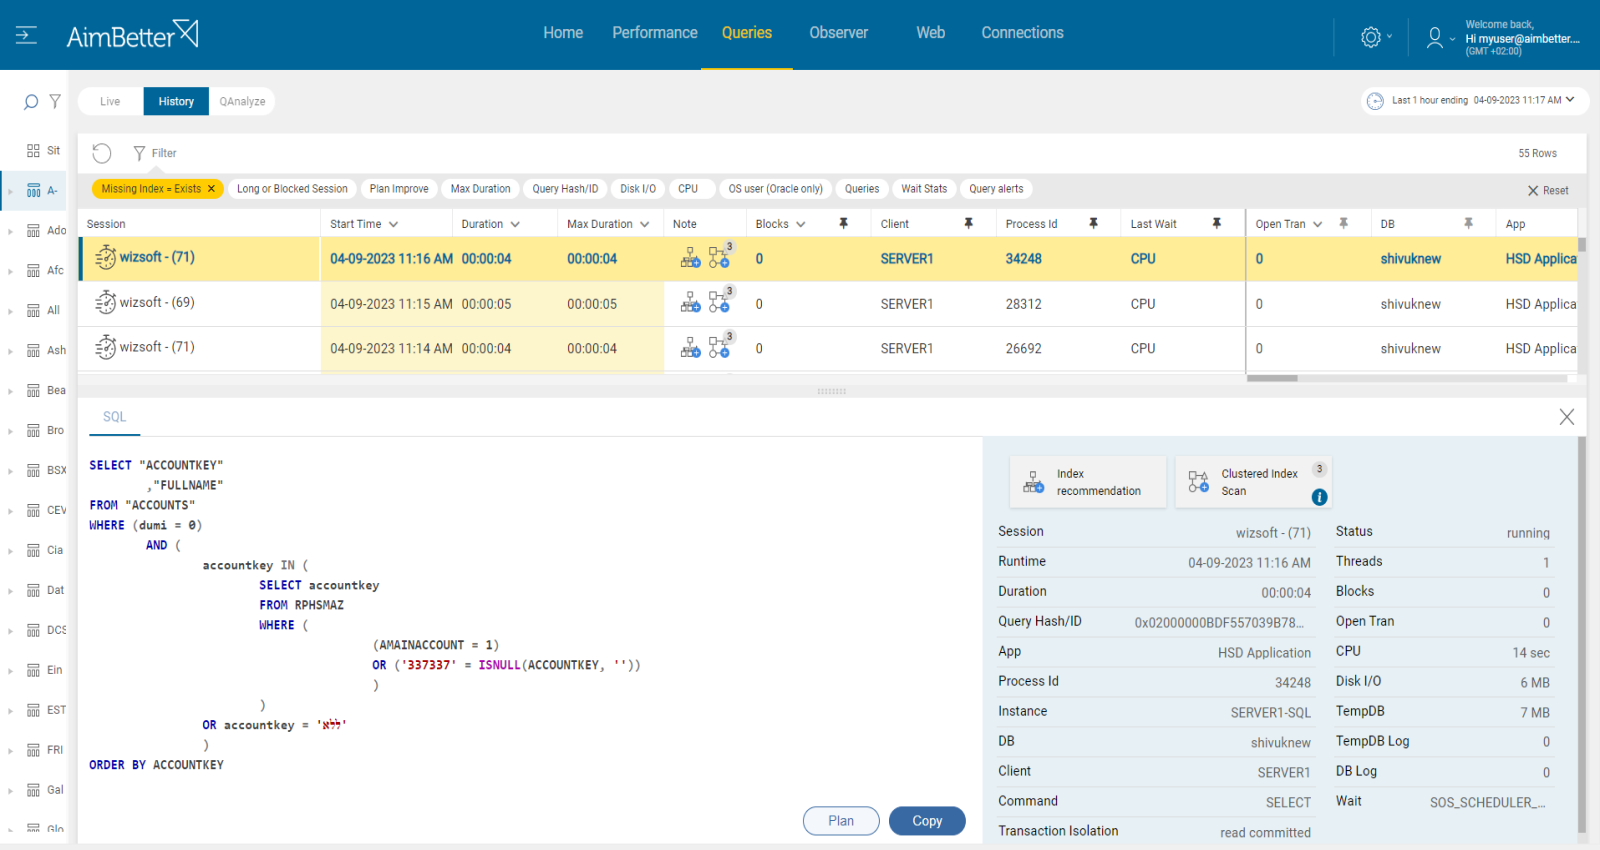
5- Missing or corrupt indexes or Queries coding written ineffectively Priority: Medium
If query coding is not written well, it might affect the log file size of a database. Too much data may be updated at once or the query may run for too long. One cause for that might be a non-optimal execution plan or missing indexes.
It means SQL Server is suggesting that your query could run faster with an index. 99% of the time, corruption is related to disk or disk driver/firmware.
Problem identification:
Identify which queries are running too long or their performance is not good.
Investigate query execution plans or missing indexes issues that could improve performance.
1. Using tracking tools, identify queries that perform poorly. It might be because of high execution time or non-optimal query plans. You can use performance analysis or SQL Server profiler. This step is complicated and might take time to do. You can’t guarantee accurate results since you check only current issues without historical events.
2. Think about which appropriate improvement would optimize the queries. For example, You can use the Database Engine Tuning Advisor or other tools to help identify the missing indexes.
3. Monitor the response times using performance counters. You lay on current moments.
Our solution implements an automatic algorithm on each query session, looking for missing indexes or non-optimal query plans.
You can simply check our recommendation for missing indexes or plan improvement in most Cache-consuming queries.
For each query, you can also easily see their code and download their plan
Recommended action :
Implement missing index or plan improvement recommendations with the help of a DBA.
Otherwise, use the AimBetter monitoring tool’s recommendations and follow the future performance with it.


