AlwaysOn is a term used in the context of Microsoft’s high-availability and disaster recovery solutions. It has two modes:
AlwaysOn Failover Cluster Instances (FCI) – basically, traditional clusters;
AlwaysOn Availability Groups (AG) – basically, mirroring.
The foundation of both modes is to use multiple SQL Server hosts to distribute workload and also to address issues of disaster recovery, but the exact way they enable high availability and disaster recovery is quite different.
Failover Cluster Instances use clustering technology to provide failover support for an entire SQL Server instance, including its databases. It creates two or more nodes or teamed hosts that coordinate with the domain controller to specify which of those physical nodes will control a virtual instance (IP address, Virtual Network Name, and a virtual instance) — but only one node can be active on only one physical host at a time. There’s only a single copy of the databases.
AlwaysOn Availability Groups uses flexible data replication, failover, and read scaling for specific databases using a group of secondary replicas. It uses mirroring (server-to-server communication via endpoints) to keep synchronized copies of data on multiple hosts and keep AG listeners pointed at a read/write replica for normal database interactions. This enables having read-only replicas allowing for scale-out.
This last mode can have two configurations: asynchronous-commit availability replica in which every availability database should be in the SYNCHRONIZING state since transactions are considered committed as soon as they are written to the primary database. Another option is a Synchronous-commit replica in which every available database should be in the SYNCHRONIZED state since transactions are not considered committed until they are successfully written to both the primary database and all other replicas.
The health of a cluster is defined via a voting mechanism. The total cluster is represented as a QUORUM, consisting of a number of host nodes and two possible witness types (file-disk or share-file).
Each node has a VOTE, and the witness also does. The cluster must have a majority of “online” votes to be viewed as operational. The counting is affected by the overall scheme. In the case of a static scheme, the total number of nodes is constant, so in cases where nodes are shut off, they are counted as “offline” and, therefore, a negative vote. In dynamic quorum schemes, nodes that are shut down are removed from the count altogether.
It is good practice that clusters are more stable if they have an odd number of votes.
Find out how you can save hours of work when investigating the root cause of this issue.
Symptoms :
AlwaysOn now reads as ‘not synchronized’ indicating loss of quorum for the database cluster.
Impact: Critical
The database is no longer classified as healthy. High availability and disaster recovery features are now lost.
Expected behavior :
Database clusters should never lose quorum. Any instance needs to be investigated.
Possible causes:
1- Hardware failure. Priority: High
Limited resources such as CPU, memory, or disk I/O on either the primary or secondary replicas can impact the speed of data replication, causing synchronization delays.
For example, disk or storage problems on server replicas can lead to delayed I/O operations and affect data replication.
The Cluster service on this node may have stopped, or the availability replica has transitioned to the resolving role. The cluster node was removed from the active failover cluster membership. The Cluster service on this node may have stopped.
Problem identification:
Identify errors related to OS resource usage causing slow or failed replica operations. It should be checked on the same time period that the replica is done.
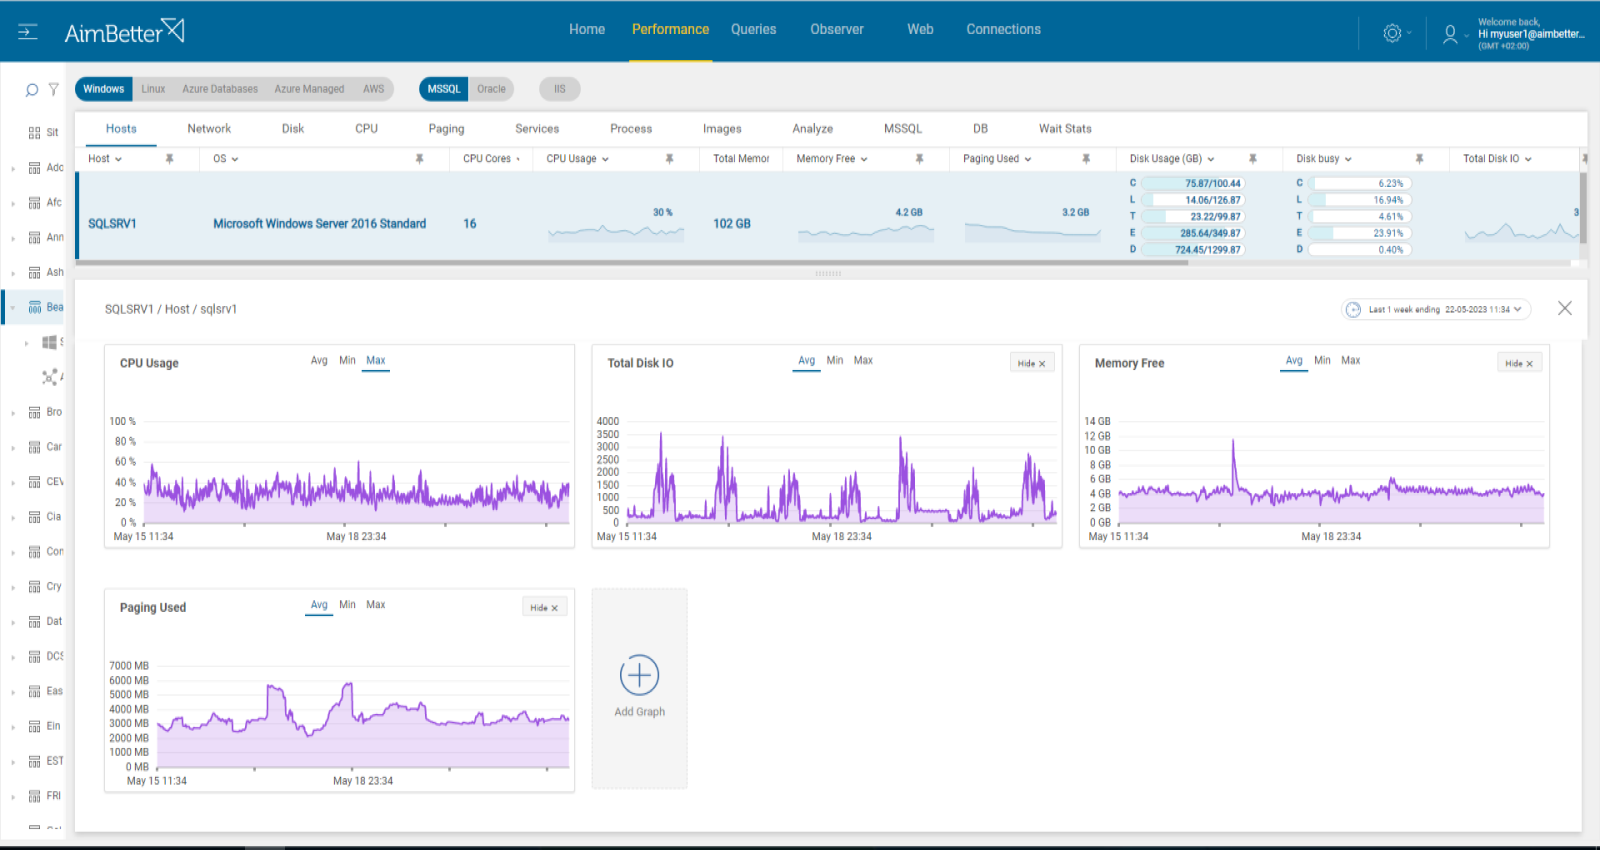
- Track performance over time and notice if queries are running slower or application response time is too slow. You can use tracking tools such as SQL Server Profiler. This step might require many hours and is hardly efficient.
- Investigate the system logs. For example, using Windows OS, check the Event Viewer’s logs and look for errors related to OS components, such as CPU, Memory, or disk I/O errors. You should also review database logs. For linux, most OS logs are stored in ‘ /var/log/ ’, or ‘journalctl’. This step might also be lengthy and without guarantee of results since it’s very vague what to look for.
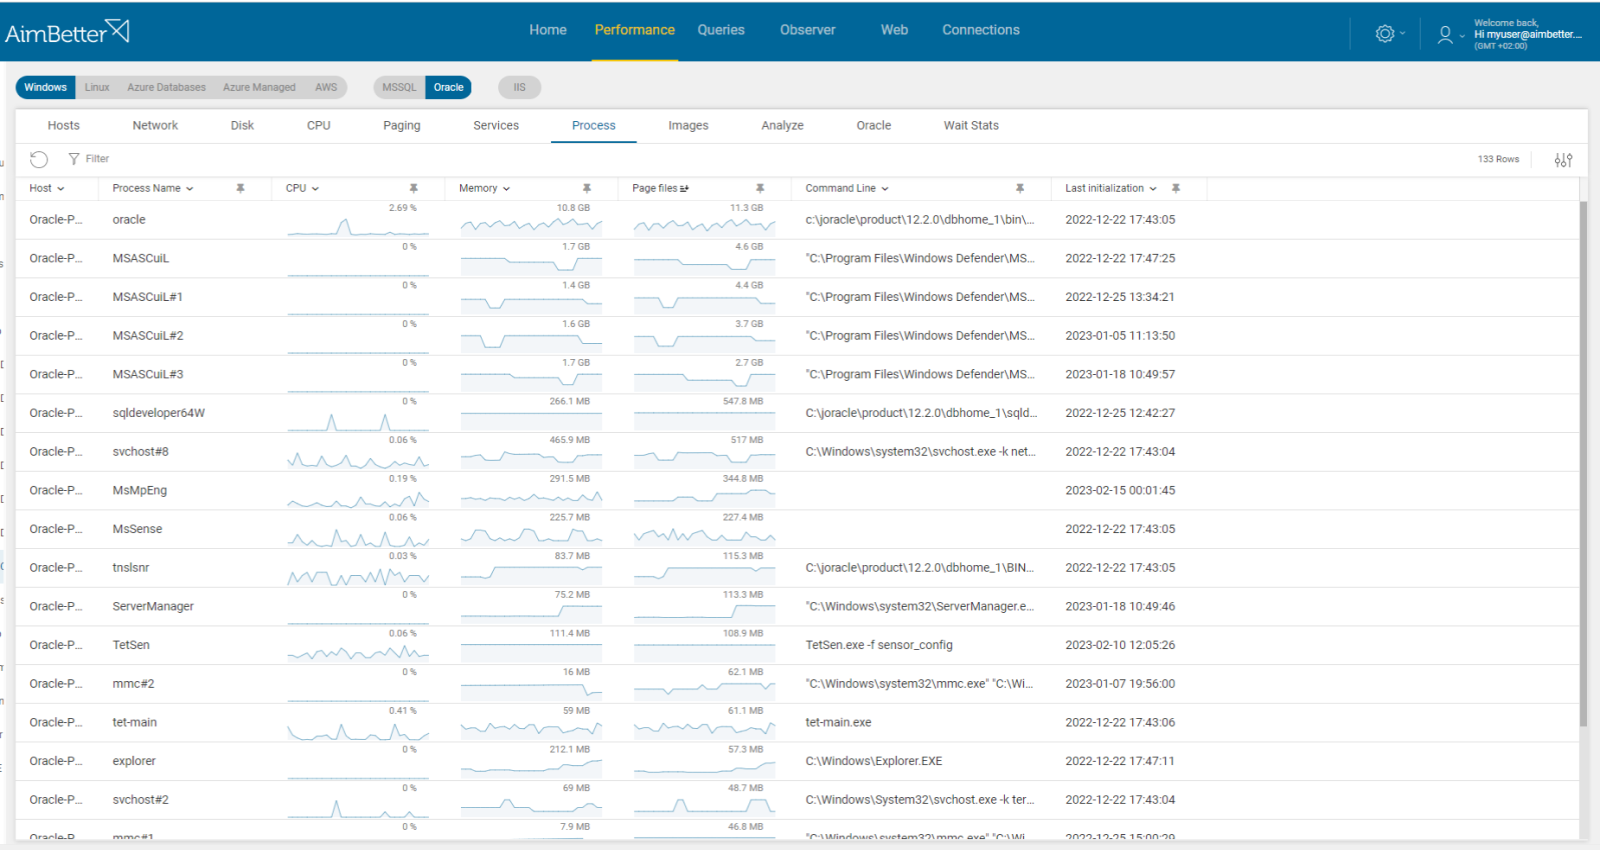
- Check the Task Manager or Activity Monitor: use built-in OS tools such as Performance Monitor to identify if there are processes that are using too many resources. You can’t guarantee precise results when checking the online status with no historical events. For Linux, you can use ‘htop’ as a real-time resource monitor.
- Look for unnecessary startup programs: Some programs may start automatically and run in the background, consuming OS resources. You should disable it. It might take time to identify it.
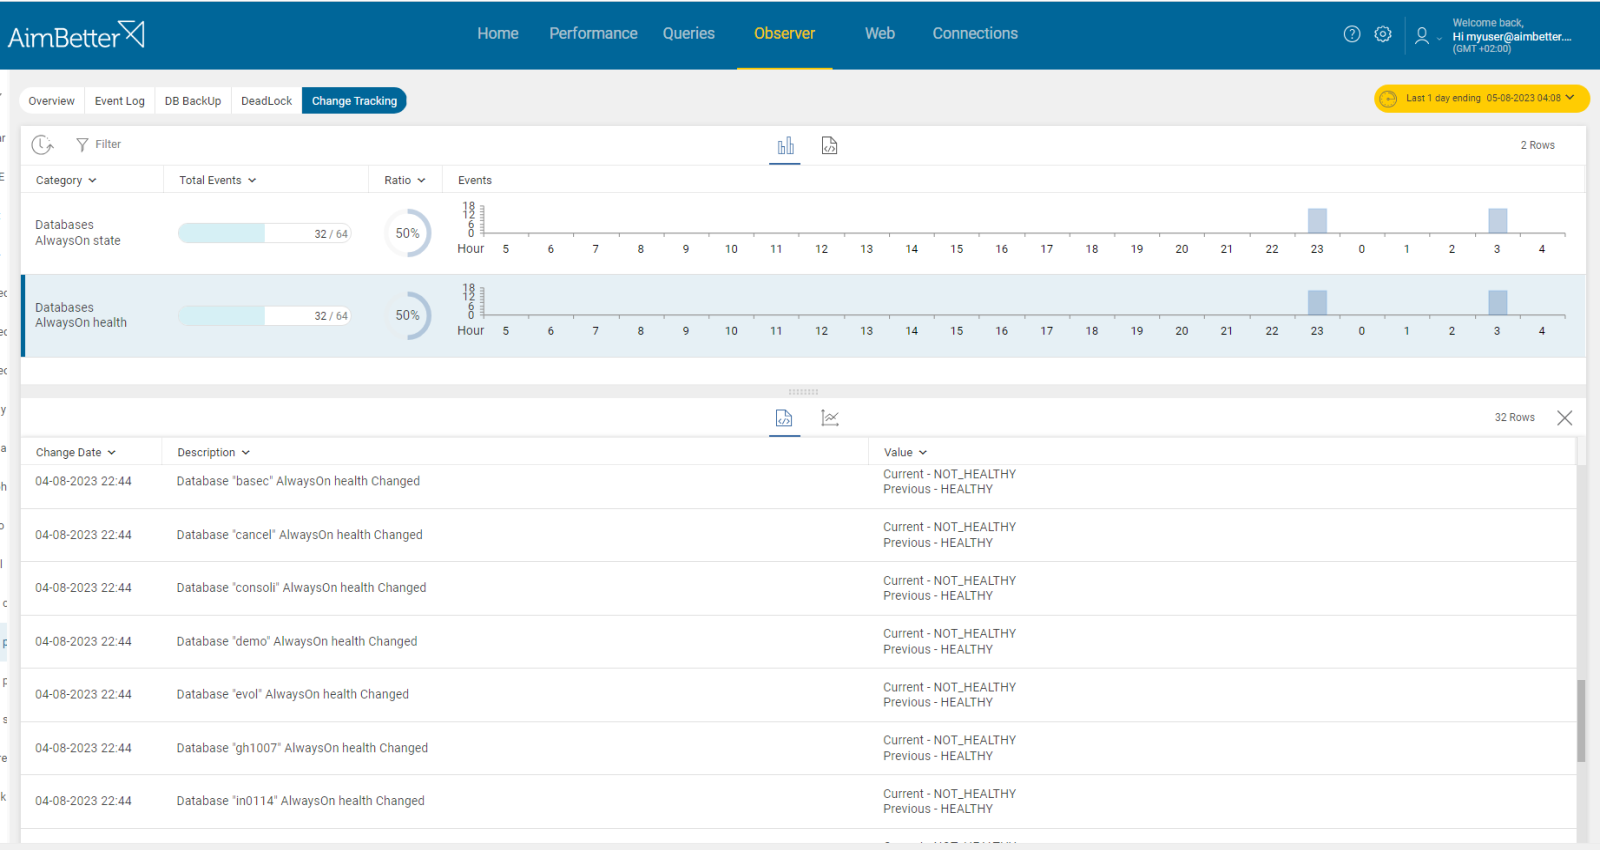
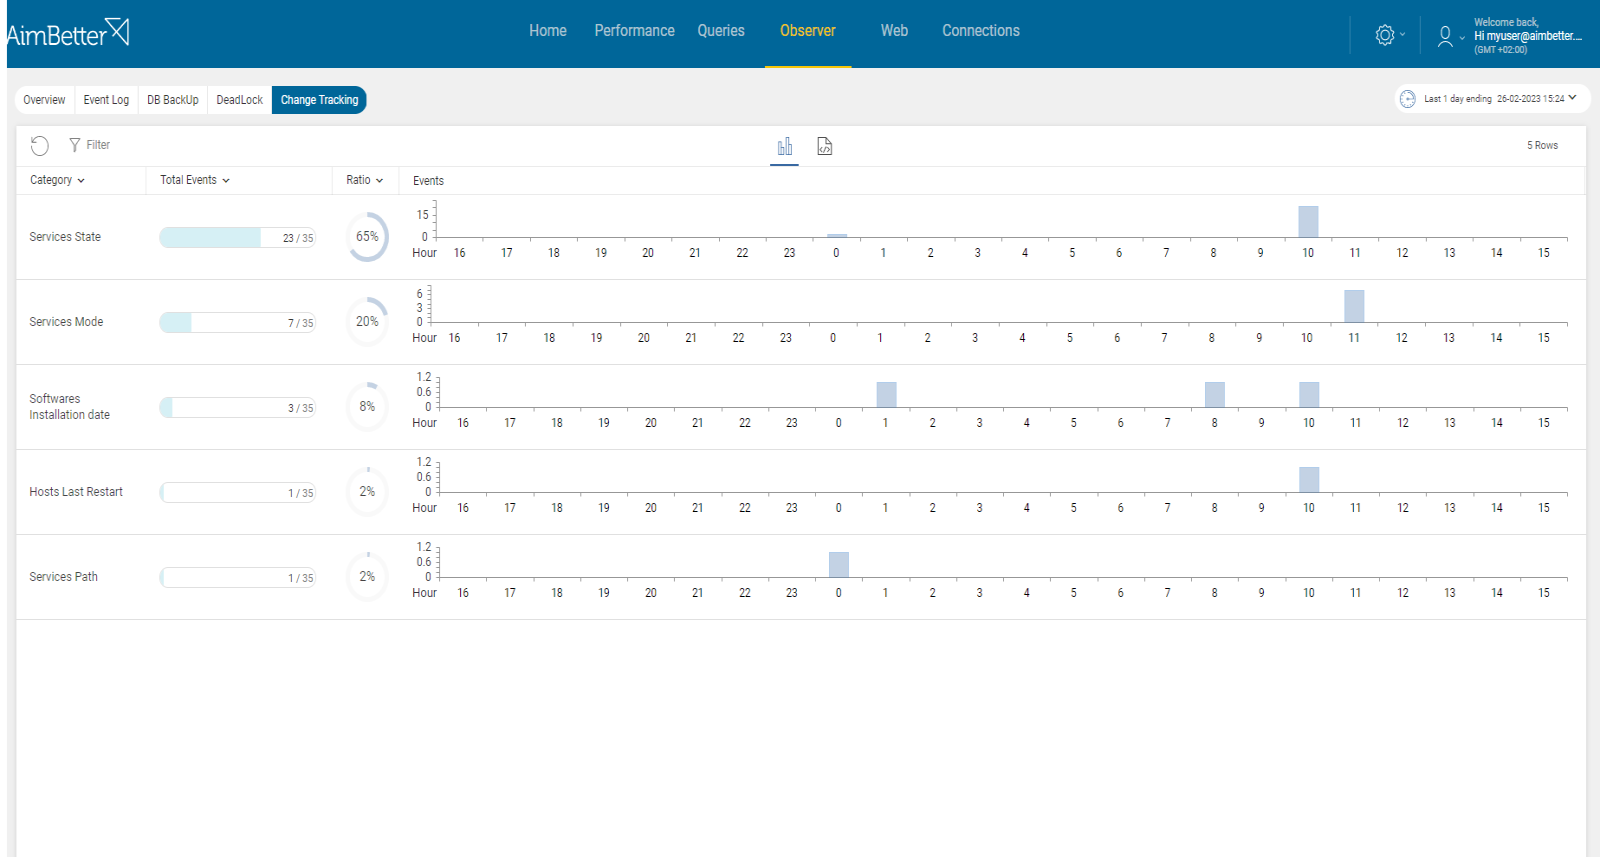
- Check which of the following events happened at the same time as the databases’ status changed to unhealthy.
Recommended action :
When all nodes and witnesses are located on specific hardware, failure of this hardware will result in a loss of the vote and may cause the quorum to be lost—track which nodes are still functioning to determine the point of failure. Take appropriate steps to bring the missing node back up.
Make sure your software and drivers are up-to-date and keep track of the OS resources’ performance over time.
2- Network failure or high utilization. Priority: High
Synchronization between instances relies on network connectivity. Network interruptions, delays, or packet losses between primary and secondary replicas, might decrease data synchronization. These events might lead to unsynchronized replicas when the replication is configured to be synchronous.
Either a network or a firewall issue exists. The cluster node was removed from the active failover cluster membership. The Cluster service on this node may have stopped. This could also be due to the node having lost communication with other active nodes in the failover cluster.
If the secondary replica is unavailable, the synchronization cannot occur until it’s online.
Problem identification:
Identify issues related to network failure or overload at the same time when databases’ status changed to unhealthy.
- Using a network monitoring tool, you should check how much traffic is flowing through your network and which applications or devices are using the most bandwidth. Take into account that most monitoring tools help pinpoint when a problem starts, with which you can’t compare time frames. In addition, look for times when there’s network packet loss.
- Review your network logs to see if there are any unusual patterns or events that correspond to the spike in network traffic. You should also check for hardware or software errors related to the network adapters on this node. This task might take some hours.
- Ensure that your network devices are configured for the most optimal performance and function correctly. Make sure also to check the firewall or security settings.
- Check which of the events happened close to the time when the databases’ status changed to unhealthy.
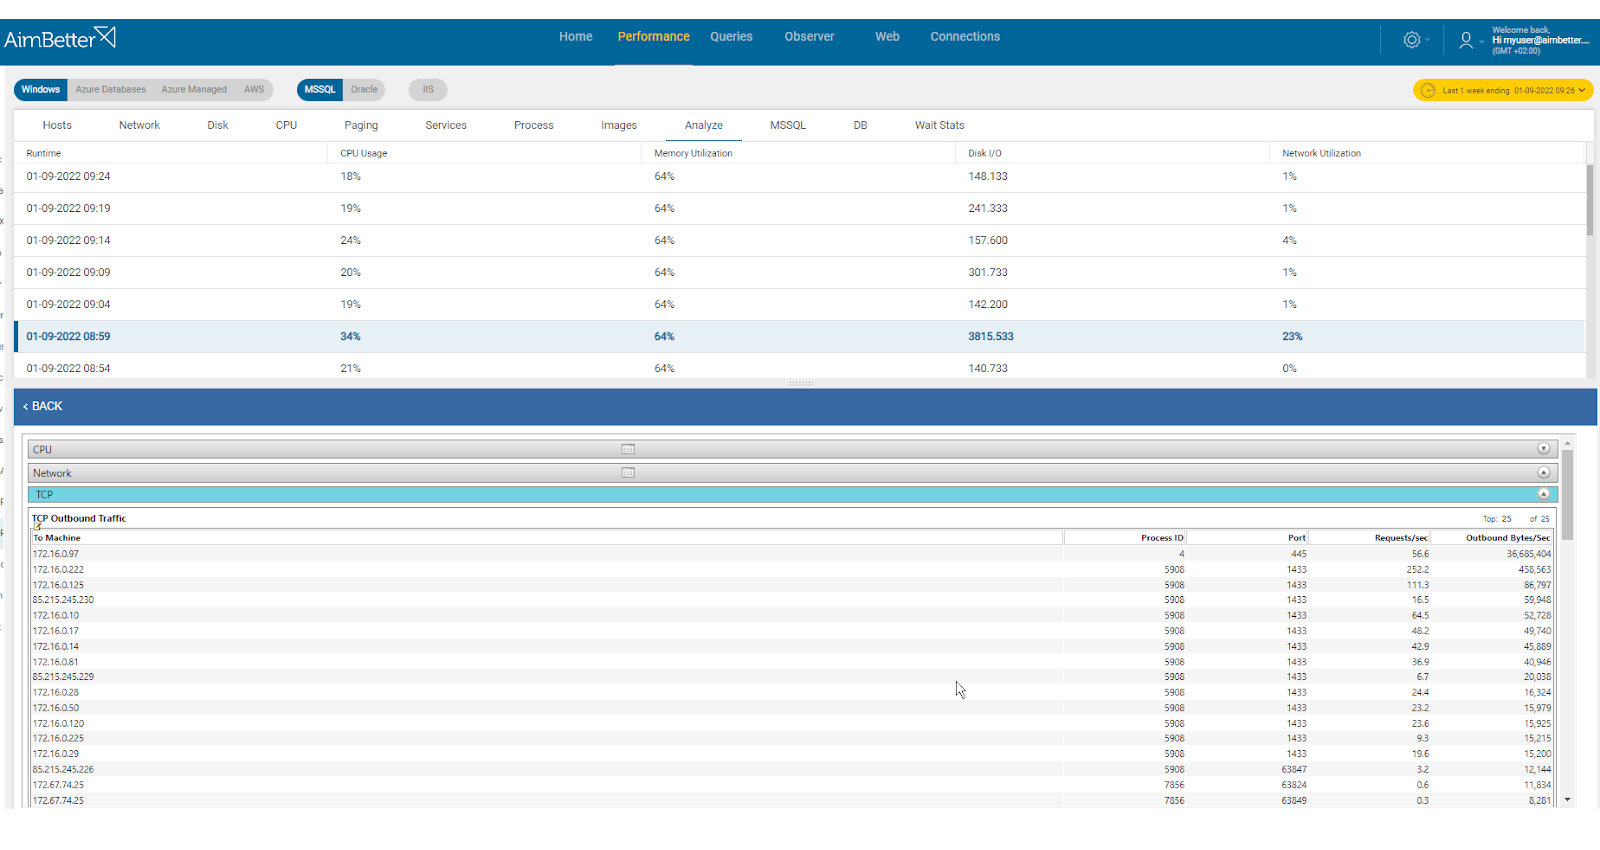
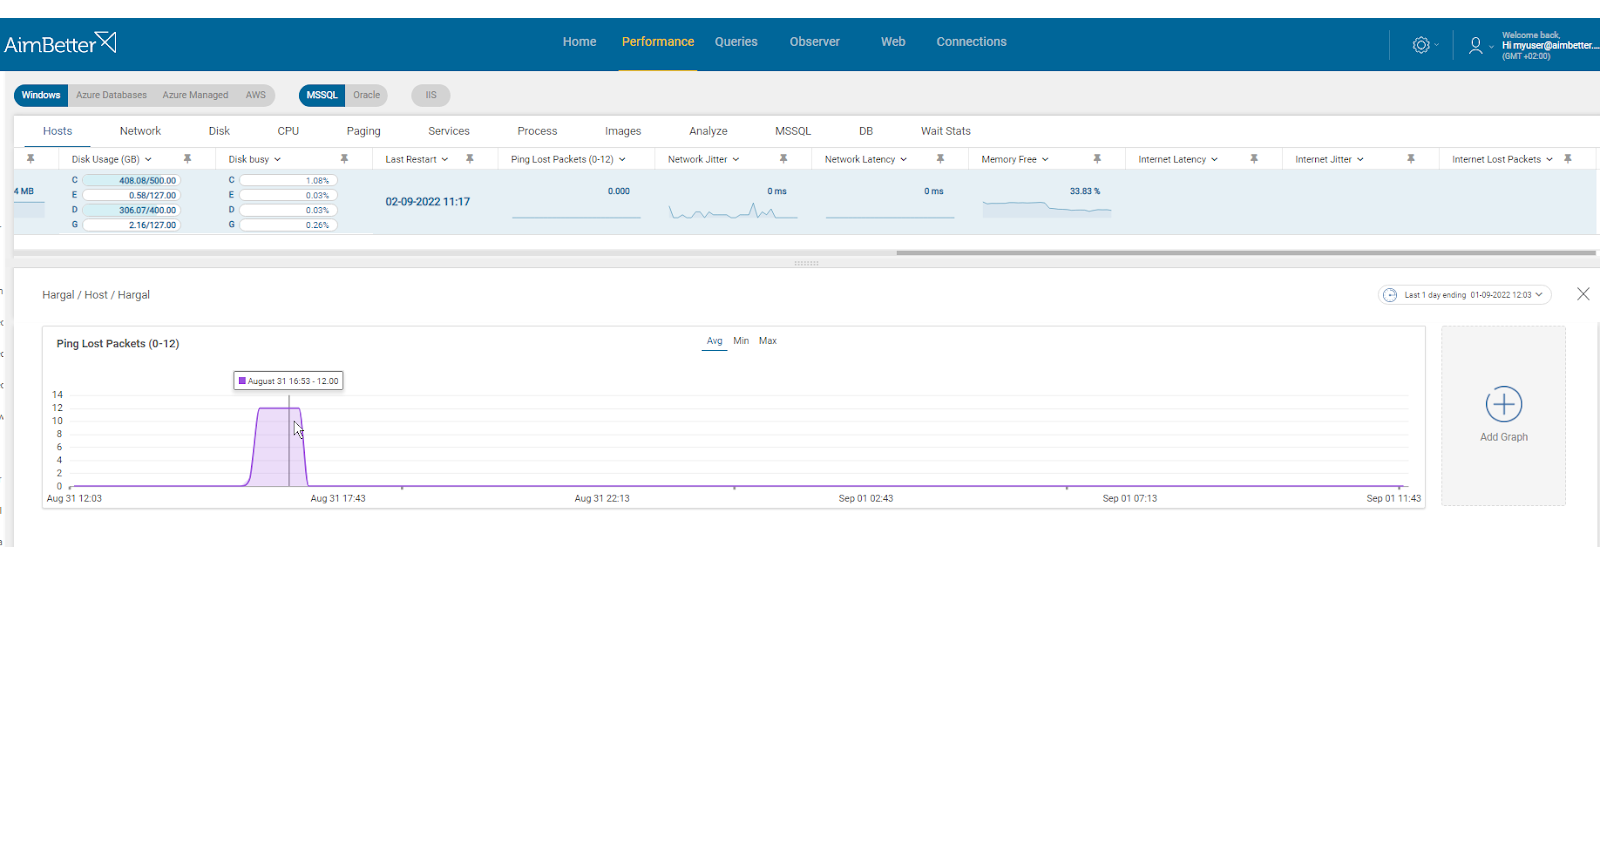
AimBetter raises an alert for any abnormal network utilization or network activities that require further analysis, displaying peaks and comparisons between timeframes.
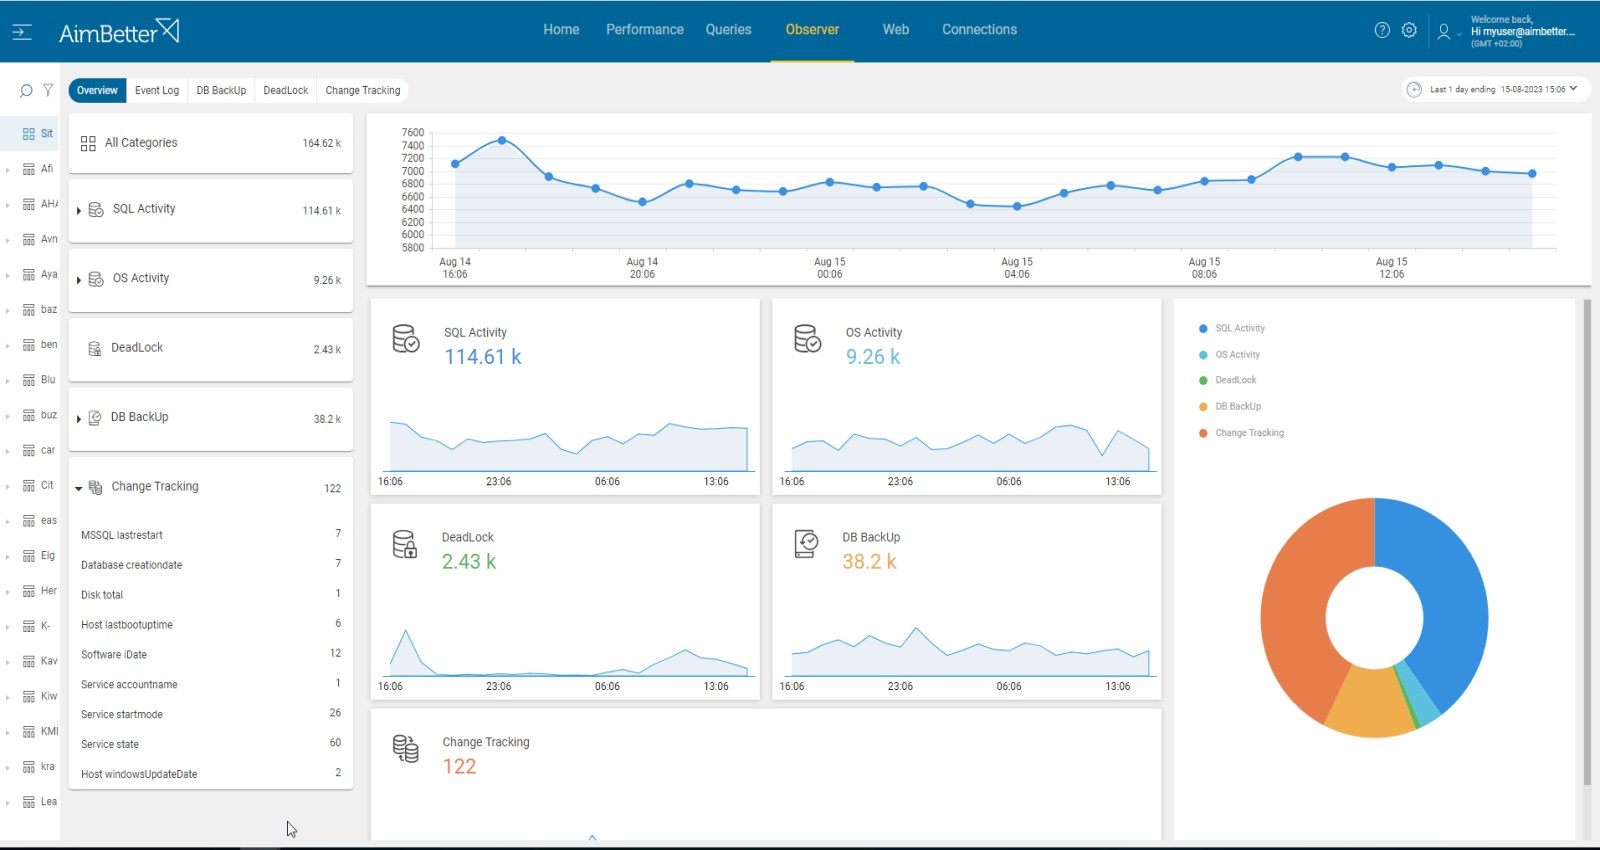
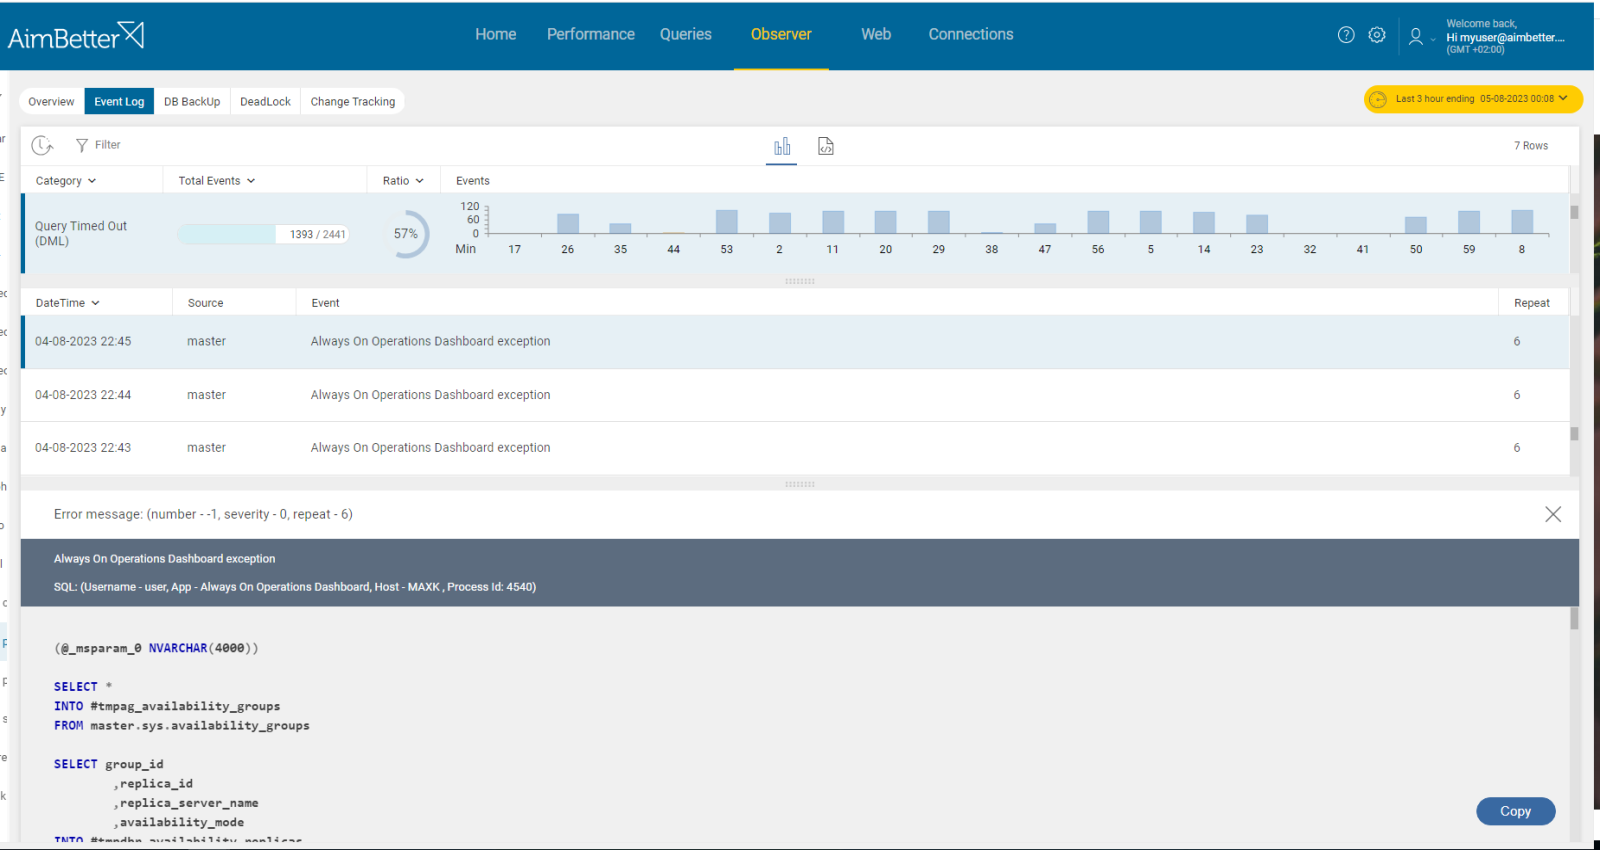
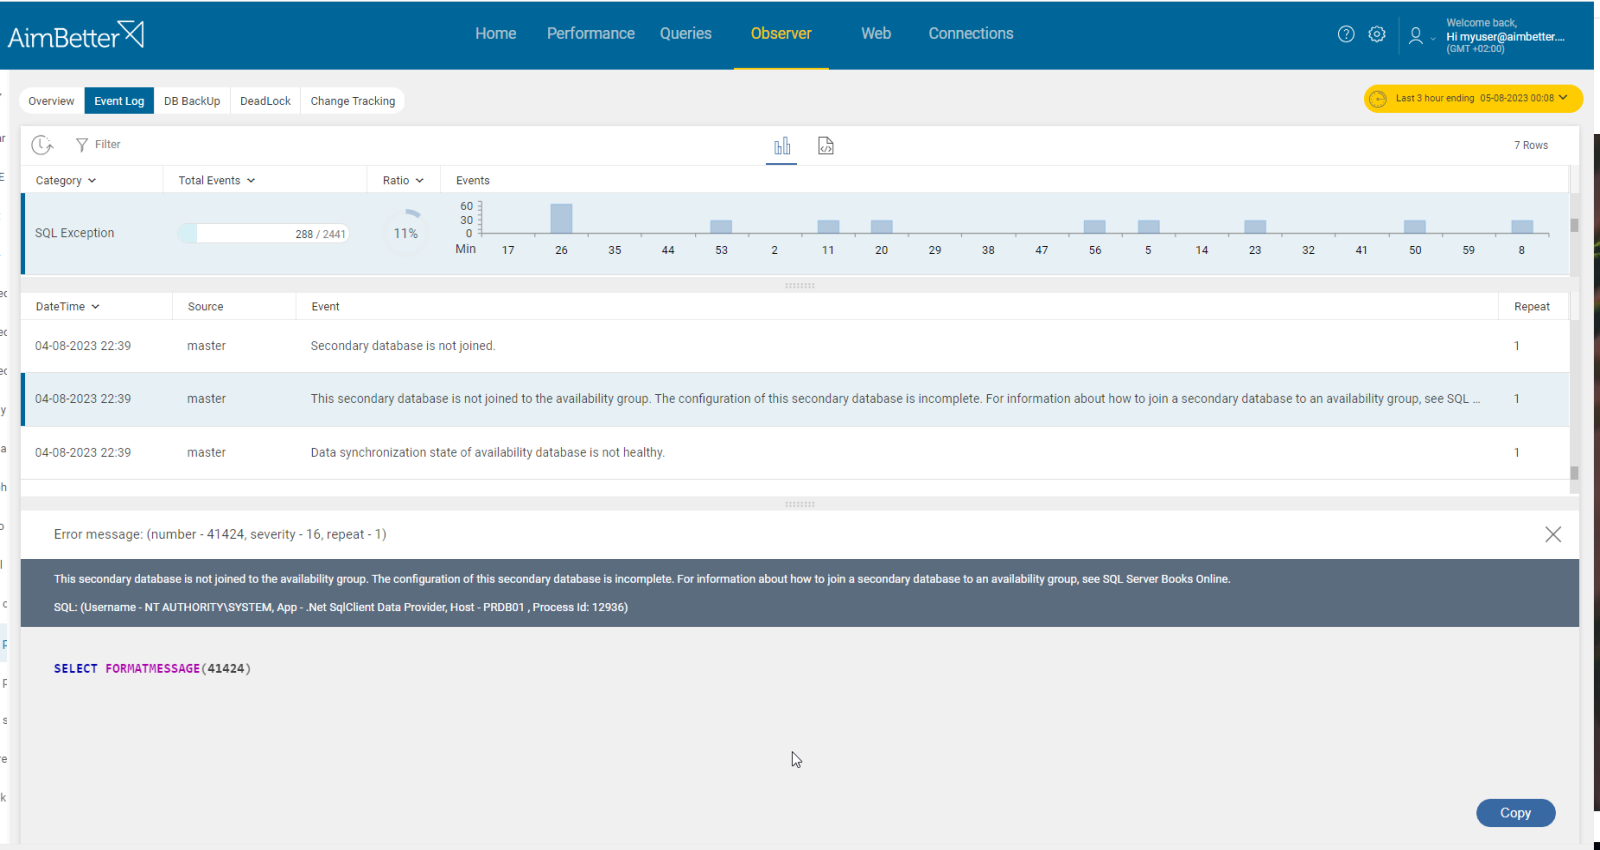
It is easy to investigate what happened close to the event with AimBetter’s event logs and change tracking tools.
Further, in the event that the server is unavailable for connection, a notification is immediately sent.
Recommended action :
You might change network settings for better performance or improve hardware, providing a better bandwidth.
If the higher network traffic is because of external operations, contact its organization to check whether they can reduce the network traffic amount. Otherwise, manage your own network traffic differently or increase the bandwidth.
In case of a server crash, restart and investigate the cause of the crash. In case of network failure, replace faulty components and restore network functionality. Check for failures in any other network components to which the node is connected, such as hubs, switches, or bridges.
3- Long Running Transactions or Blocking issues. Priority: Medium
Delays in the synchronization process might be caused when there are long-running transactions or blocking situations. Eventually, this delay might cause failures, for example, when the query receives a timeout.
Problem identification:
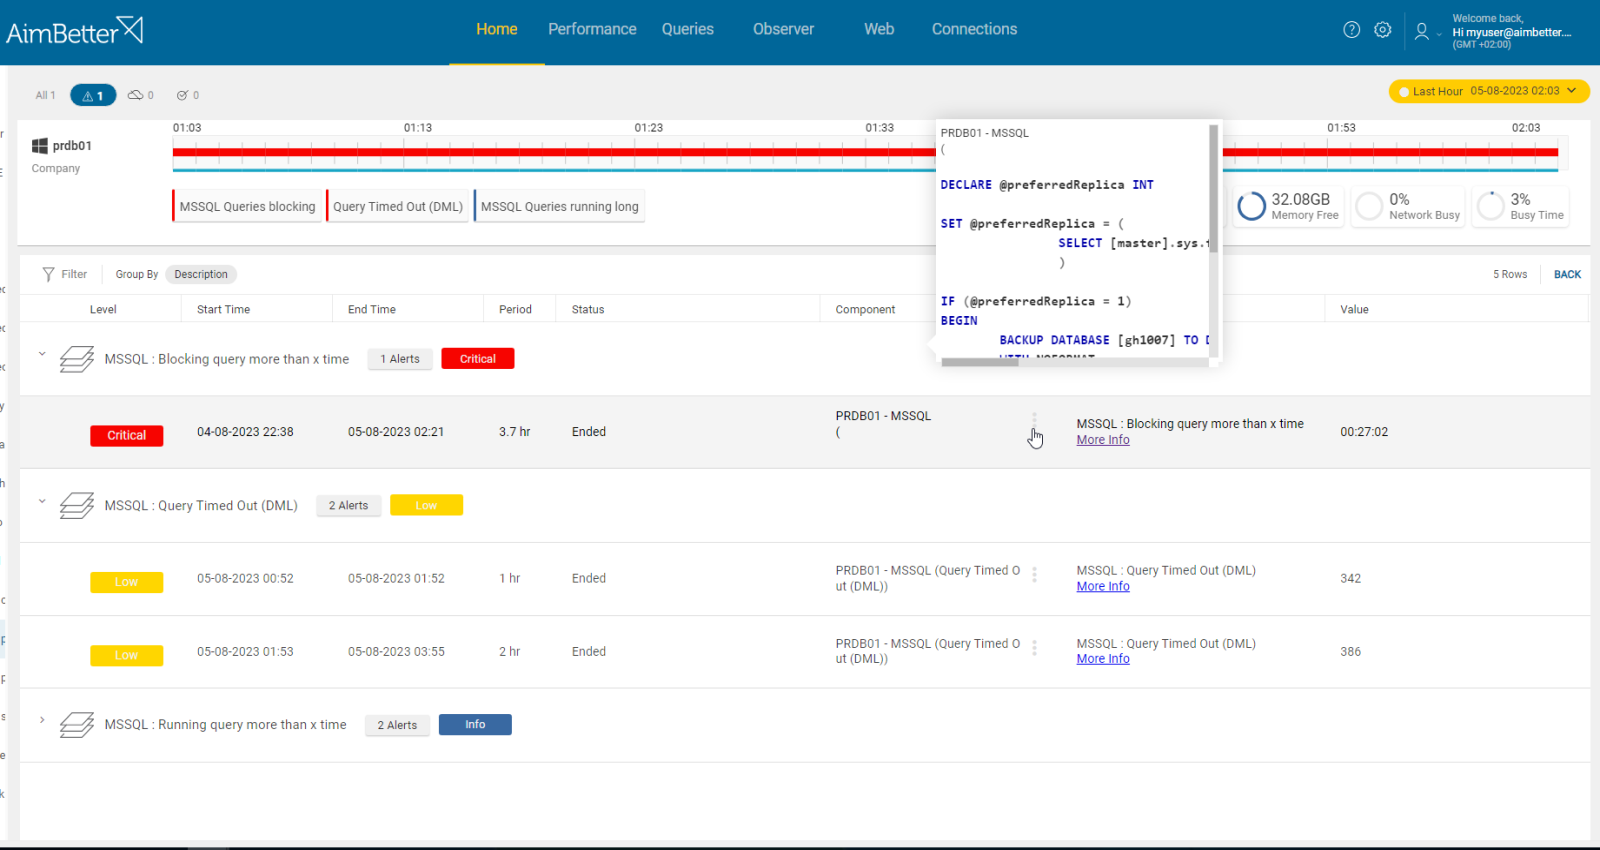
Look for long-running transactions or blocking queries events during the time in which the databases’ status changed to unhealthy.
- Use tracking tools in order to identify long-running transactions or blocked queries. For SQL Server, you might use SQL Server Profiler or extended events. This task has to be performed by a skilled DBA and may take some time. Focus on cases where the process is related to the replica and synchronization. In addition, you can look for exceptions, like query time-outs for long-running queries.
- Another option is using database logs or DMVs (dynamic management views). You can also use the SQL Activity Monitor or Performance Counters.
- Review the SQL Server error logs for messages related to blocking or long-running transactions. It might take some time.
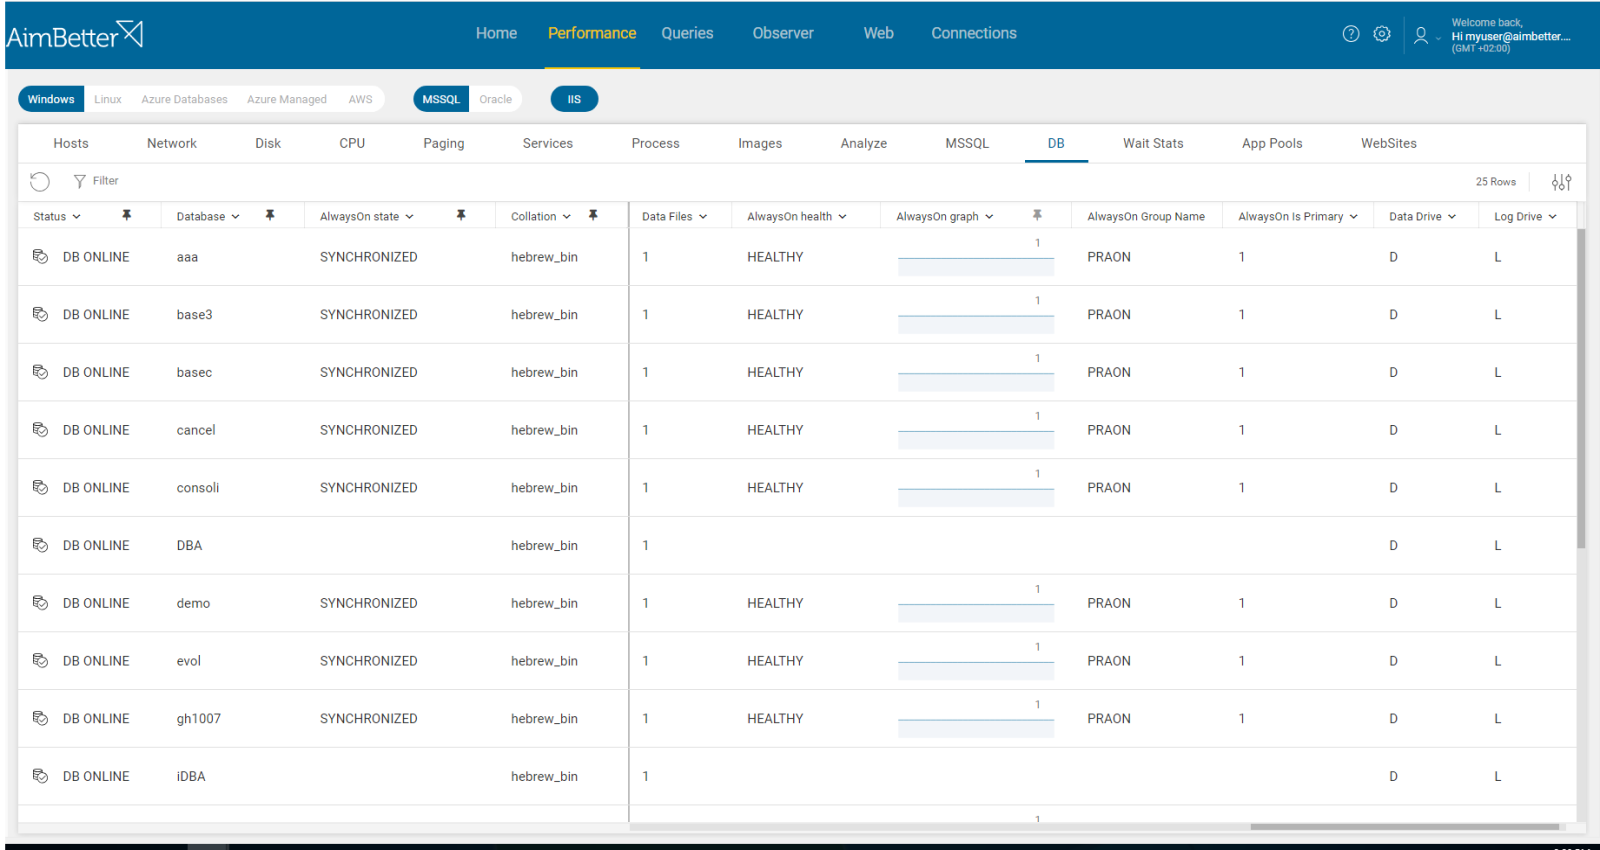
- Track the Always On Availability Groups dashboard to ensure unsynchronized times and failovers.
Recommended action :
Make sure the transactions don’t remain open for more time than needed. Check the database design and storage. Make sure to optimize the query’s execution plan if needed in order to reduce execution time.
4- Errors or inadequate permissions. Priority: Medium
Incompatibilities between the primary and secondary instances participating in Always On might cause errors in synchronization between them. Differences might be in configuration, schema, versions, or permissions.
Problem identification:
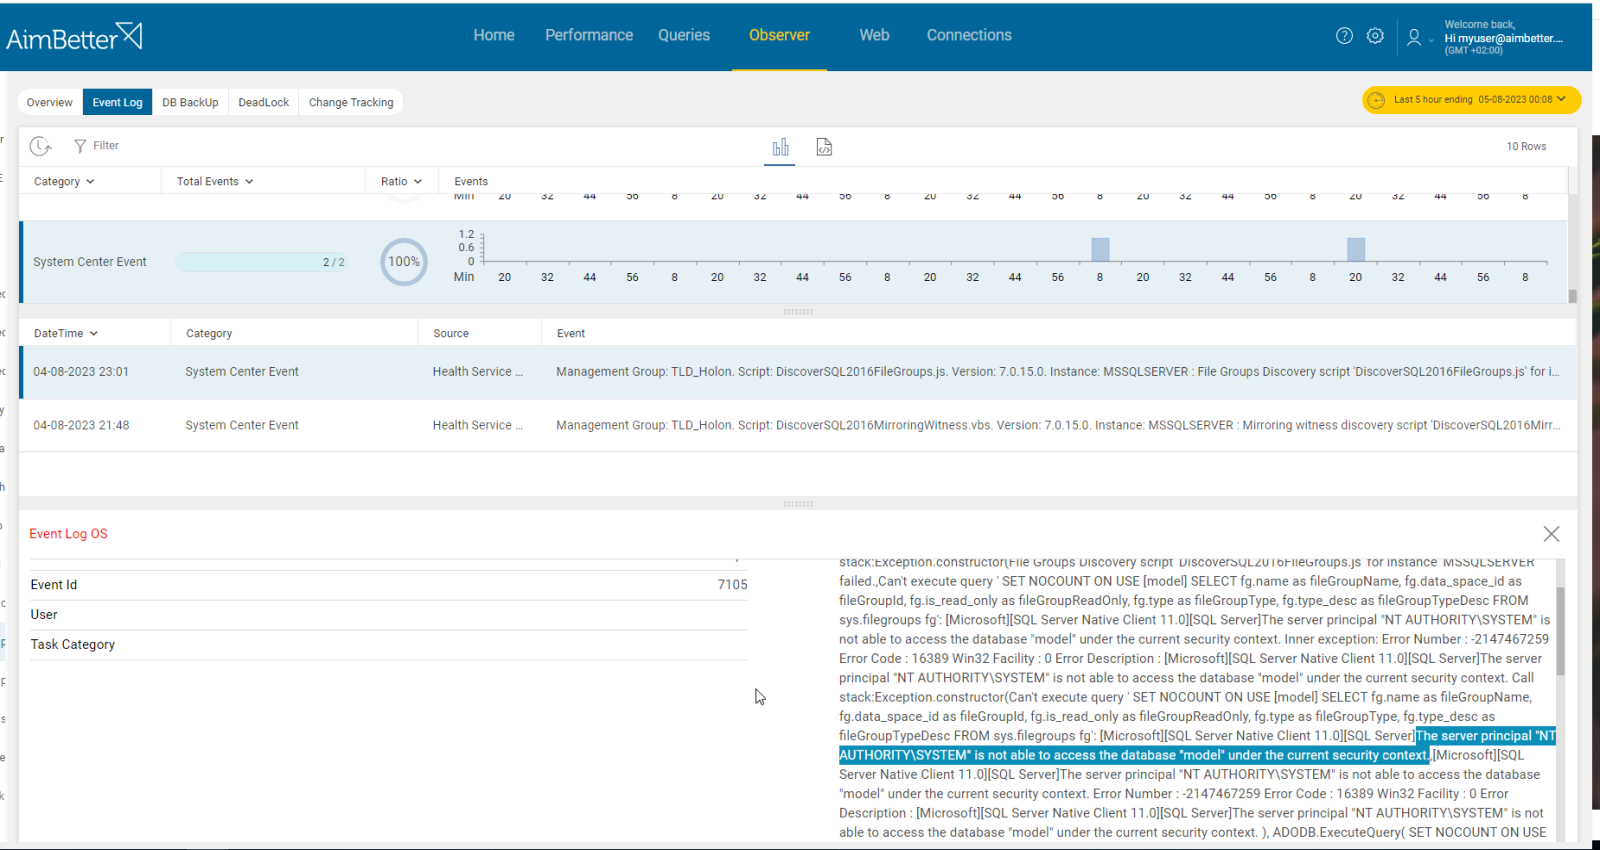
Identify differences between the primary and secondary servers that raise errors in the execution process of the synchronization.
- Use tracking tools in order to identify errors or permission issues in both nodes. For SQL Server, you might use SQL Server Profiler or extended events. It might take time and require a DBA.
- If using a Windows Failover Cluster, review cluster logs for any issues or else review the SQL Server error logs. For linux, you can use high availability (HA) and failover clustering like Pacemaker & Corosync tools. It might provide a clue.
- Use DMVs to track the availability group status, health, and synchronization state.
- Investigate all details collected and check which you should focus on that affects the databases’ healthy status.
Recommended action :
Validate schema and configuration consistency. Review recent changes to the environment that might have impacted synchronization. Ensure that both primary and secondary replicas are running compatible versions of SQL Server. Make sure that the Availability Group settings, listener configurations, or permissions fit.


