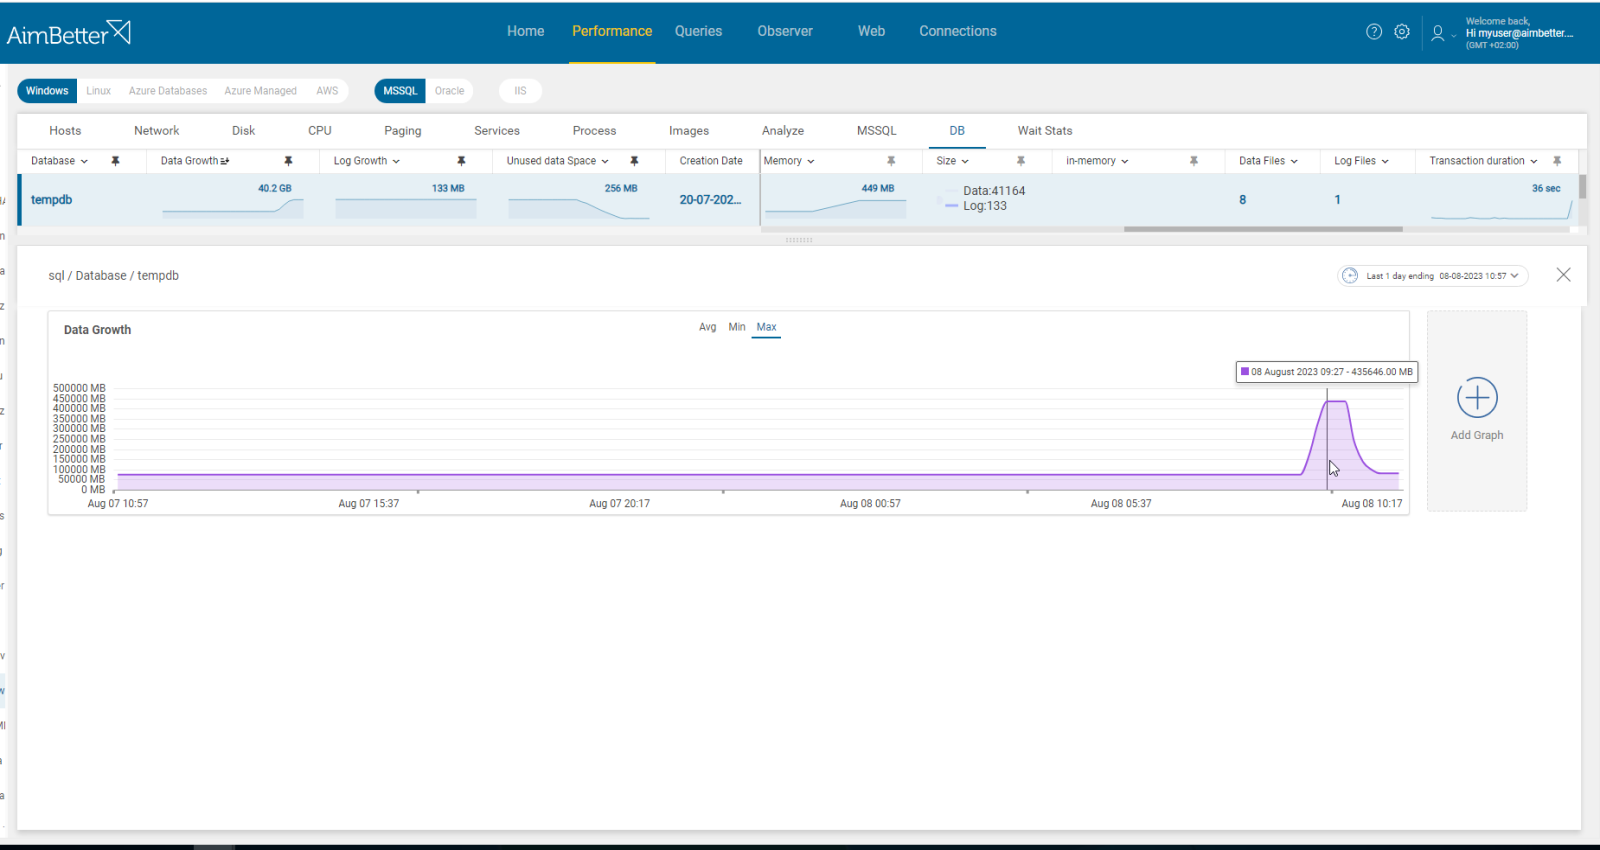
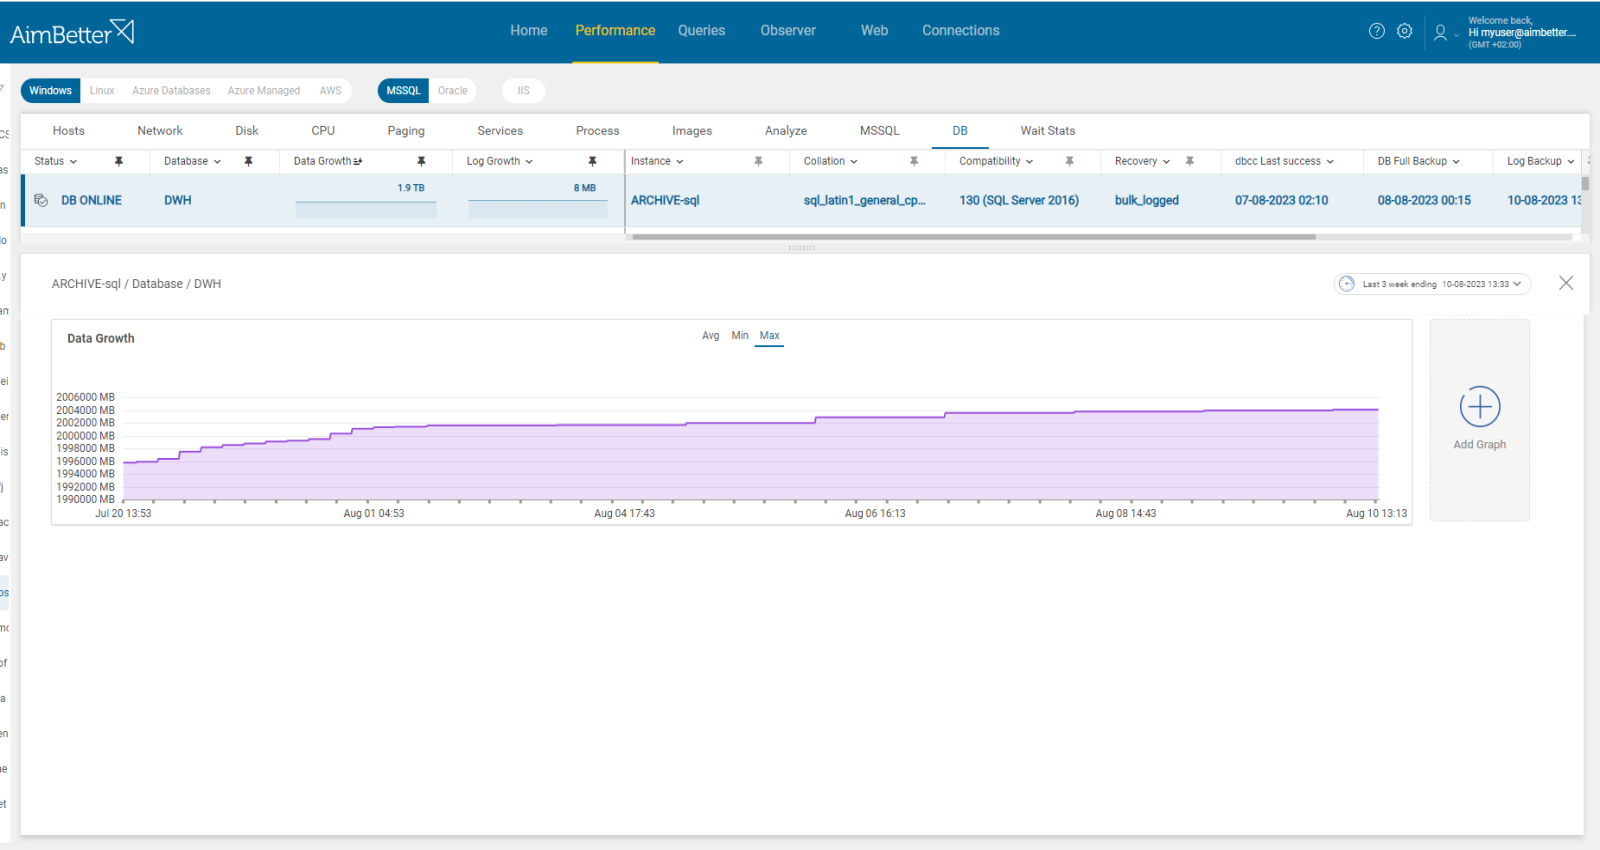
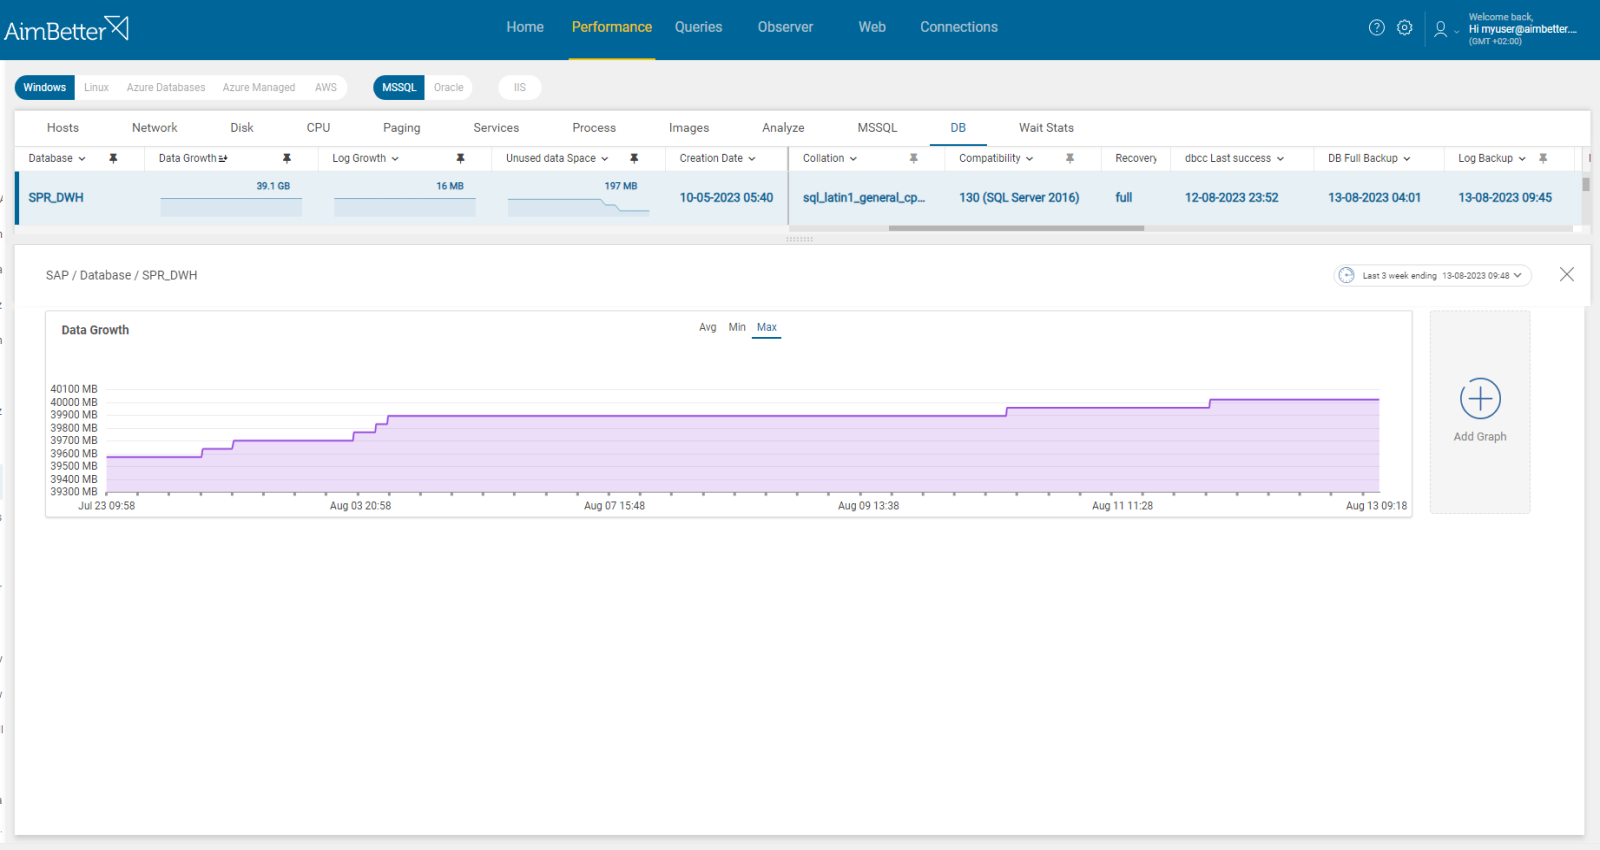
Data growth refers to an increase in the amount of the database’s data files. For SQL Server, (.MDF) file extension, for Oracle, (.DBF) file extension.
This metric is intended to identify any case where the database file has grown to be bigger than expected. The threshold sets a level beyond which file size growth triggers a warning. The database file size is highly dependent on the level of activity and the overall health of the database. The trigger levels should be set in accordance with past behavior and also take into account capacity levels to absorb such growth.
Find out how you can save hours of work when investigating the root cause of this issue.
Symptoms
The total database size increased and is now larger than the designated threshold.
Impact: High
If uncontrolled, data files can consume all available disk space, leading to a system crash, and the rapid increase in database size might slow down queries’ performance.
The bigger the database file, the backup and restore processes of the database are going to be longer, as well as maintenance tasks. When the data load is high, higher resource utilization (CPU, Memory, Disk I/O) is expected.
Expected behavior
There is no standard metric for database growth. This alert indicates unexpected behavior and needs to be investigated.
The best practice, in this case, is to evaluate the total data disk space (MDF or DBF files), together with full/differential backups disk space and slow executions, in light of the business flow and specific database role. Tables usage (including in-memory tables) should also be checked periodically, including indexes’ usage.
Possible causes
1- Inefficient Coding or recent data updates without deletions. Priority: High
If the sudden increase is noted during normal operations, it may be an indication that a query is inserting new data in an invalid manner – possibly a loop.
When doing data insertion, new records update and are inserted into tables, causing the growth of the database file might as it accumulates over time. Without managing the deletions properly, the database data files might grow uncontrolled, resulting in unused space within the database files.
Problem identification:
Identify big data files which have grown rapidly. Check if some are with large unused data space or had many inserts of new records recently.
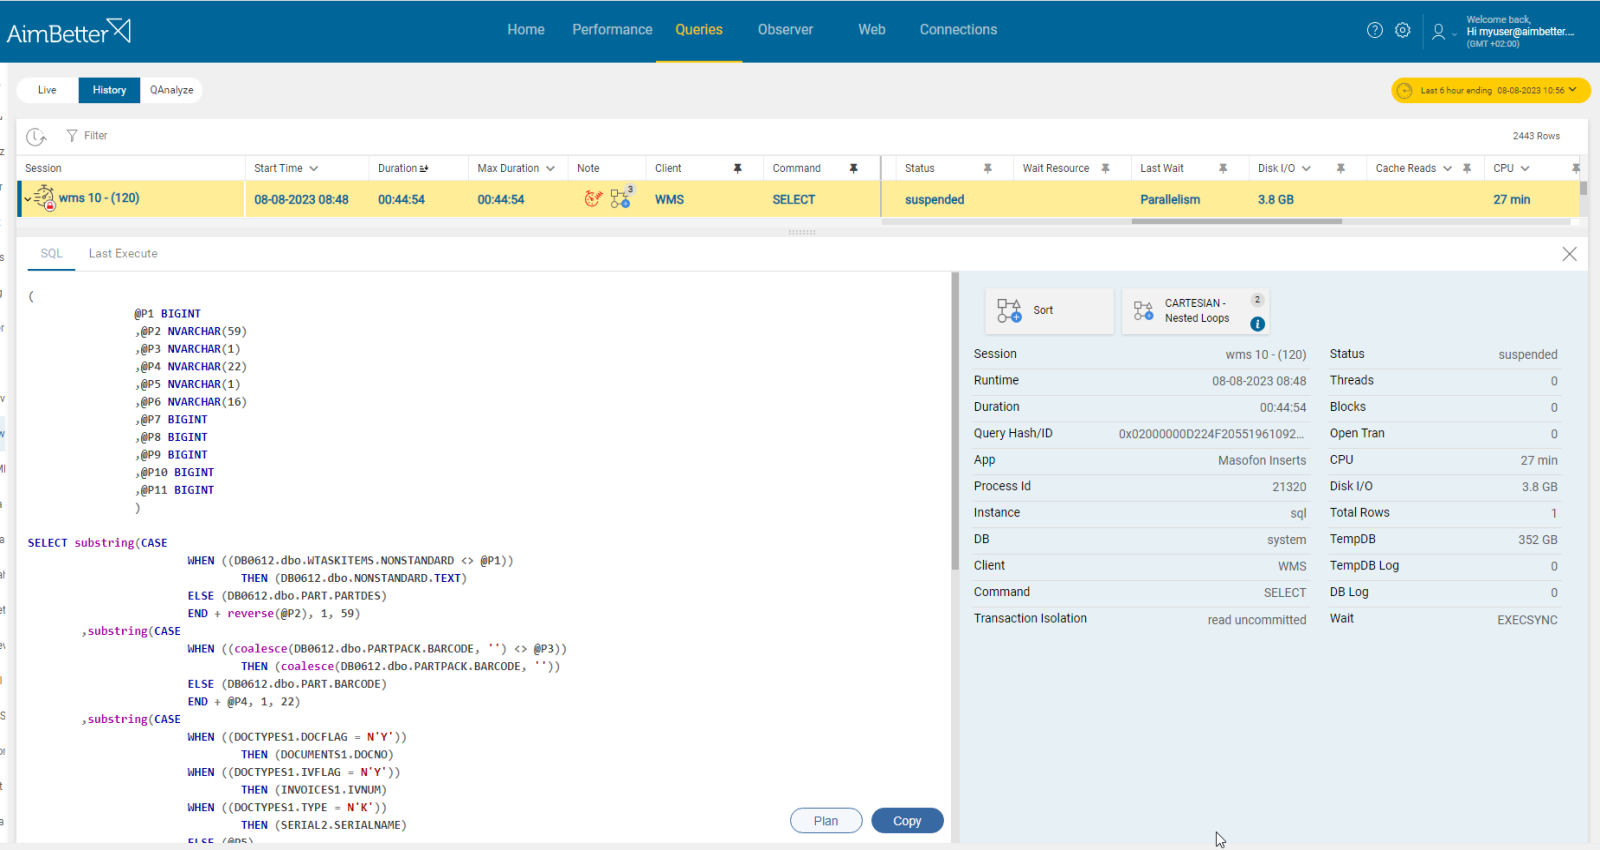
- You should regularly monitor the database’s size, checking if it has grown or not. For that, you can implement a script written by a DBA. You should also track disk usage, using the Performance monitor for that.
- Identify and analyze queries that are frequently executed and contribute to data growth. For SQL Server, you can use SQL Server profiler. For Oracle, you can use Oracle Enterprise Manager. Both Oracle and SQL Server also provide system views that offer insights into query performance. Take into account that you should track this issue, taking some time in order to have results in a wide time range, and still, you don’t have history data to compare with.
- Examine execution plans for inefficient queries. Track queries with major updates and inserts of data to the overgrown databases.
- Optimize inefficient queries by using appropriate indexing, rewriting queries, and utilizing the execution plans.
- Track this issue over time and check if the database data file has grown slower or lesser.
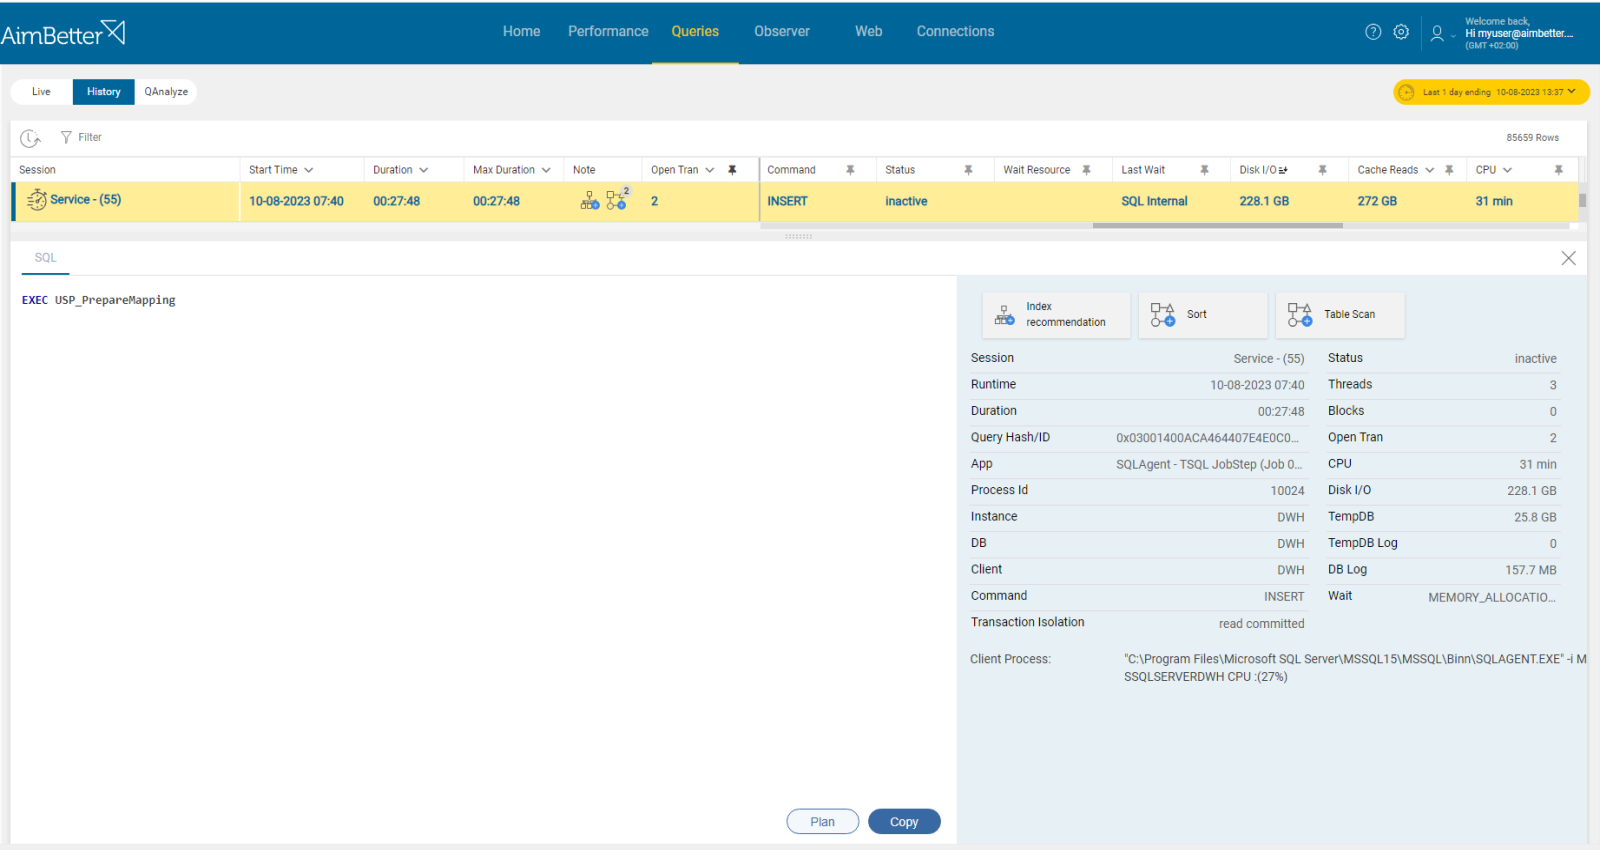
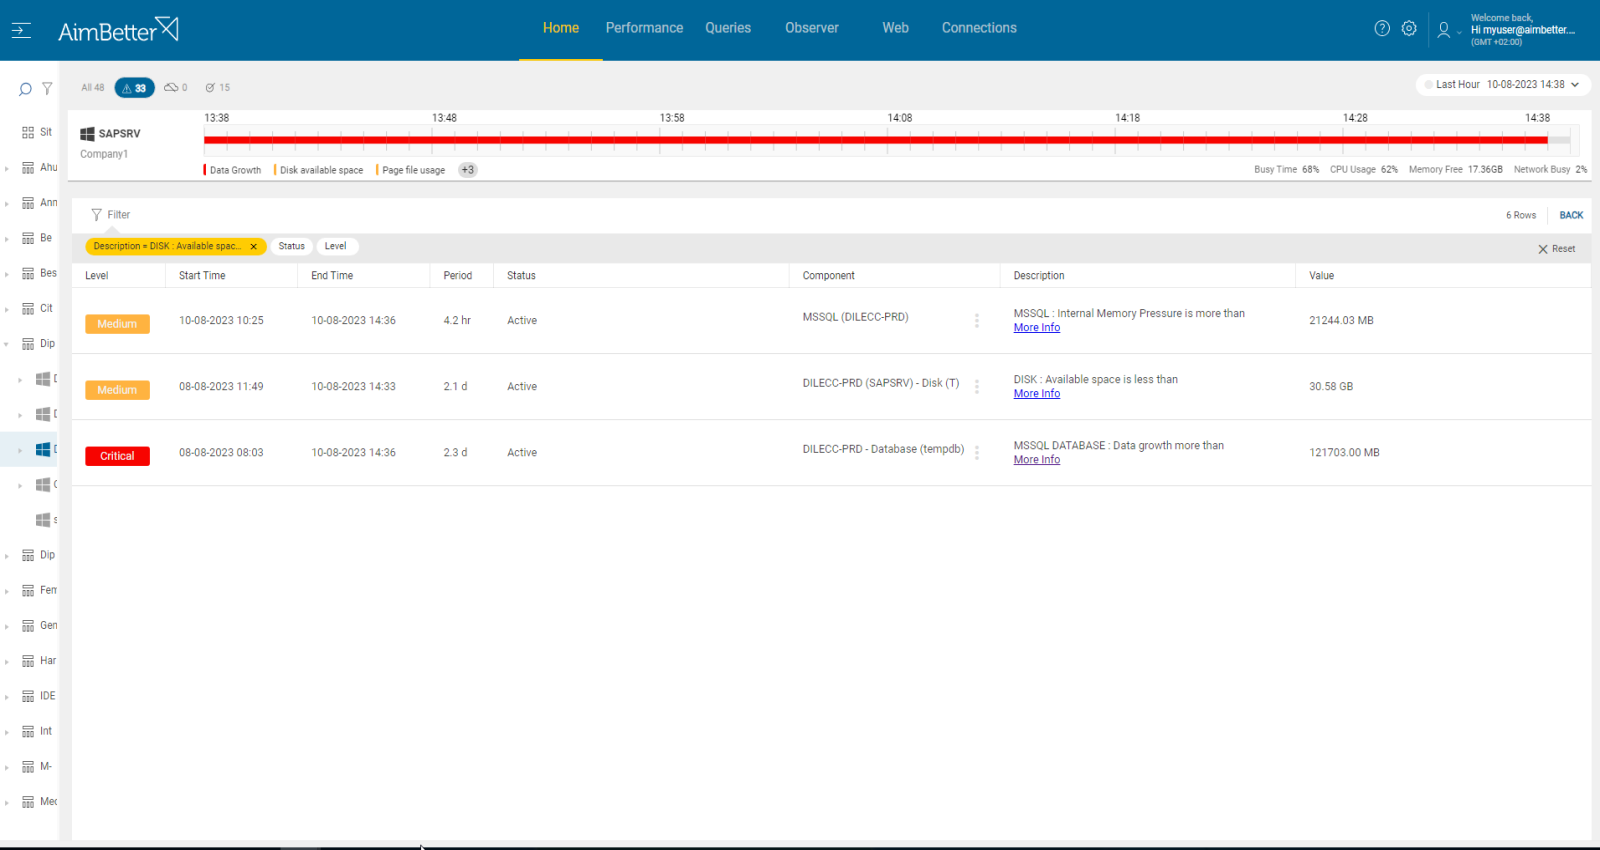
AimBetter automatically tracks and alerts about abnormalities in data growth.
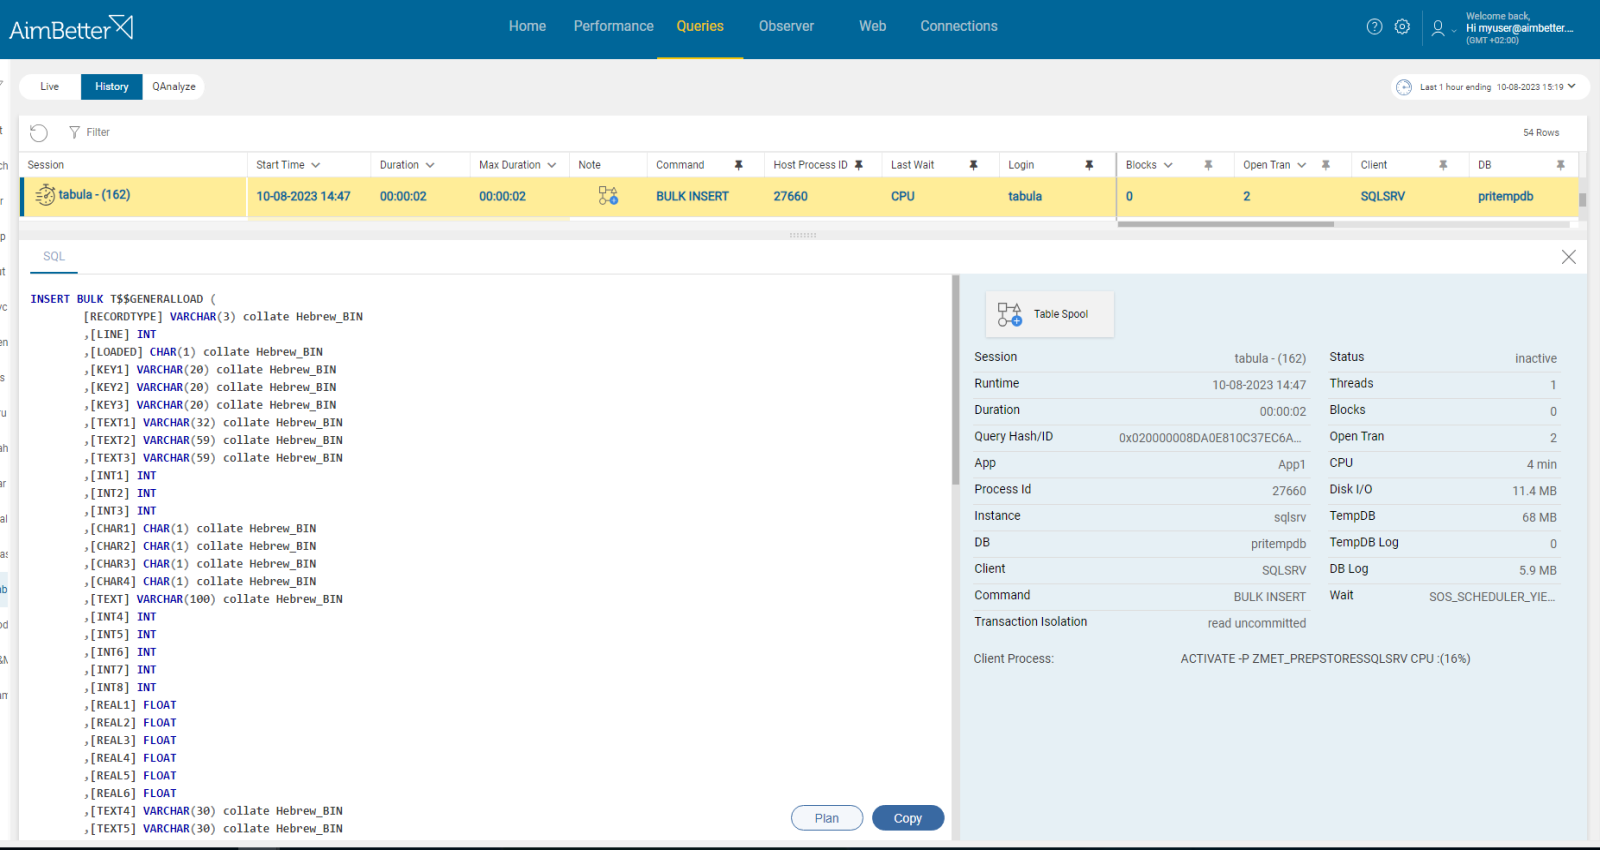
You can easily follow big inserts and updates through our solution’s capabilities to drill into the database code level.
In addition, the examination of plans is automatically done with our algorithms, providing insights on poor performance queries.
Recommended action :
Examine all currently running queries, especially those that remained active for unexpected lengths, investigating these queries code.
Avoid doing many operations that involve full table scans, excessive sorting, or high disk I/O.
Optimize queries by implementing new indexes, investigating the execution plan, and trying to lower the ratio of updates and corresponding deletions. Make sure to have data integrity checks for the databases in high routine.
2- Index Creation, Maintenance, and Corruption Priority: Medium
Indexes allow the database engine to locate rows that match certain search conditions quickly.
Creating, rebuilding, or reorganizing indexes can contribute to database file growth since it consumes additional storage space. Reindexing can increase the size of the database. The reason for this is that when you rebuild an index, there must be enough empty room in the database to create a copy of the largest table in the database as the index rebuilding occurs.
Indexes for sure contribute to better performance, as indexes accumulate, queries might become faster. However, the storage space required by the indexes can impact overall database file growth.
Problem identification:
Identify queries related to index creation, maintenance or corruption that involve high disk I/O to a recently grown database data file.
- Using tracking tools, identify queries with high disk I/O, causing an overgrown database data file. It might be because of high execution time or non-optimal query plans. You can use performance analysis, SQL Server profiler, or Oracle Enterprise Manager. This step might take time, and there is no guarantee of accurate results since you check only current issues without historical events.
- Apply filters to focus on queries involving index creation, maintenance, or corruption. In order to identify missing indexes, you can use Database Engine Tuning Advisor or other tools.
- Another option, also for live environments, is querying system views to identify active queries with high I/O activities.
- Investigate the execution plans of I/O-intensive queries. Look for operations that involve index creation, maintenance, or corruption. For that, you should monitor database event logs and error messages.
- Analyze any scheduled jobs or scripts responsible for index maintenance. For that, you should know your database environment.
Recommended action :
A normal effect of reindexing is data growth. However, good practice is for the DBCC DBREINDEX process to be run at times when normal activity is lowest. The reindexing process should be followed by the process to shrink the database (DBCC SHRINKFILE). Normal database size should be seen after that has finished.
Make sure to follow routinely for unnecessary or fragmented indexes and check if it’s possible to compress part of it.
3- Large and complex queries or bulk operations. Priority: High
Bulk data load is defined as the process of rapidly inserting a large volume of data into a database. Data growth might happen because of loading too much data at once by implementing bulk operations. It might be BULK INSERT (for SQL Server) or SQL*Loader (for Oracle).
When the query is too complex, for example, having large joins, it can require additional space and thus affect database file growth.
Problem identification:
- Use tracking tools in order to identify bulk insert operations or queries with complex joins. For SQL Server, you might use SQL Server Profiler or extended events. For Oracle, you might use Oracle Enterprise Manager (OEM). It might take time and require a DBA. Filter by the relevant database that its data file has grown.
- Other option is using performance counters related to bulk insert operations, or query performance views to identify statements involving high rows count.
- Identify irregular I/O patterns to identify bulk operations or large queries.
- Investigate the query execution plan in order to identify queries with meaningful and many joins operations.
Recommended action :
Avoid implementing many large queries and divide them into several executions if possible. For bulk operations, consider implementing minimal logging and better data-loading options. Instead of inserting all data in a single batch, consider breaking bulk operations into smaller chunks.
4- Logging and long Transactions. Priority: Low
Along with log growth, which might be caused by high levels of transaction activities (updates, inserts, and deletions, which the transaction log needs to record), data growth might also occur.
When data is modified or added to databases during a transaction, new data pages can be required, resulting in database data file growth.
Problem identification:
- Using tracking tools such as SQL Server Profiler (for SQL Server) or Oracle Enterprise Manager might help to capture events related to increased data activity which is measured by data page allocations. Take into account that you have to wait until getting efficient results since history data is not provided.
- Other options might be using database logs or DMVs (dynamic management views), which should be done by someone familiar with these tools.
- Investigate the queries’ code in order to prevent them from causing data growth, if possible.
Recommended action :
Make sure the transactions don’t remain open for more time than needed. When new pages are created, data growth will happen since it’s a consequence of database activity, yet you can make sure that performance won’t be harmed. Check the database design and storage. If the database is big, separate storage should be allocated for it.
5- TempDB Usage. Priority: Low
TempDB in SQL Server stores temporary data, such as temporary tables, stored procedures, and query results. It’s common when queries cause tempdb’s file growth.
Problem identification:
Identify growth of the tempdb file by identifying increased performance and long-running queries.
- Connect to the SQL Server Management Studio, and check the tempdb database properties. Otherwise, use system views.
- Use extended events or traces (using SQL Server Profiler) to capture information about TempDB growth events. A DBA might do it, yet it won’t provide historical data. Therefore you wouldn’t be able to identify this issue as new or repetitive unless you wait for an undefined period of time when this issue might keep happening again and again.
Recommended action :
Make sure that tempdb has multiple data files to divide I/O utilization, and allocate these files to separate storage from the other database data files. Optimize problematic queries and control their performance. Continuously monitor tempdb database file usage and performance metrics to detect growth when it happens.


