In SQL Server, a query is processed as a batch request. A Batch represents the execution of a single unit of work and may contain one or more T-SQL statements.
Batches are an important metric for understanding the way that SQL processes queries. Multiple batches that work with multiple objects can be folded within a single transaction and can have several execution plans (for each batch).
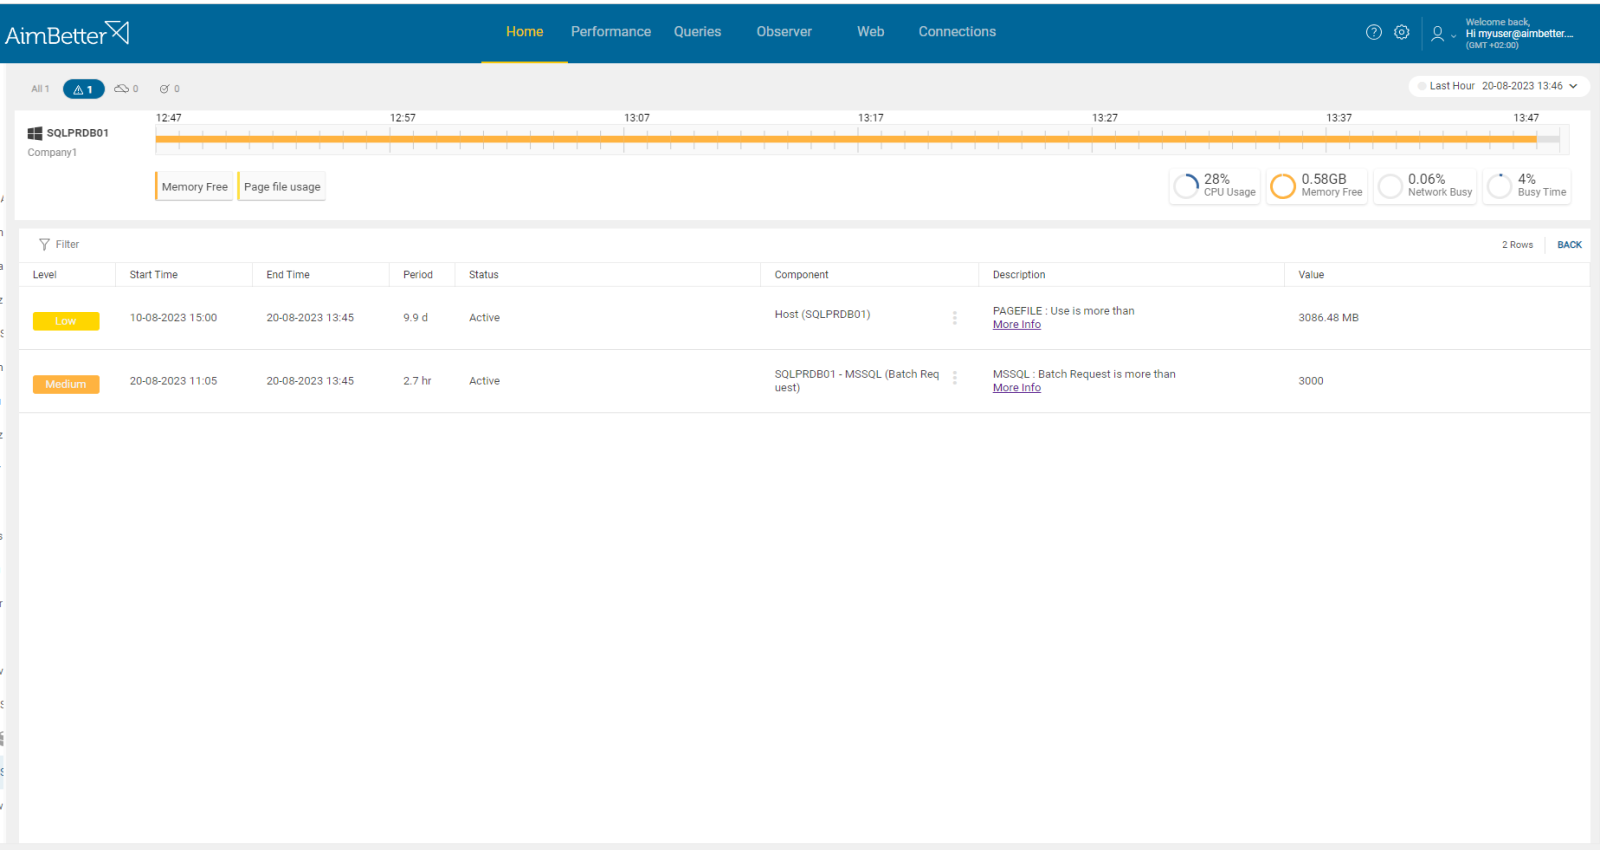
Batch requests increase indicates that the SQL engine is busy due to a high workload on the database engine.
Find out how you can save hours of work when investigating the root cause of this issue.
Symptoms :
More batch requests are measured per second, indicating the SQL engine is busy. Processes tend to be slower than usual.
Impact: Medium
When the server is busy, the performance will be slower, and the user experience will degrade. The CPU usage and RAM consumption might increase, and I/O performance will become slower.
Expected behavior :
There is no standard metric for batch requests. This value should maintain an average of what value provides the best performance. It can also get higher, yet server performance won’t necessarily be affected badly. The value should be maintained where it can be increased, but performance remains satisfactory.
Possible causes:
1- Increased user activity. Priority: High
When queries are running too slow, a user can try doing the same process multiple times, creating too many connections at once, which might increase the batch requests. In addition, a sudden surge in application usage might cause an increase in user activity since more users are accessing the SQL Server, creating new batch requests in each operation.
Problem identification:
Check for increased user activity, originating more queries in the database environment.
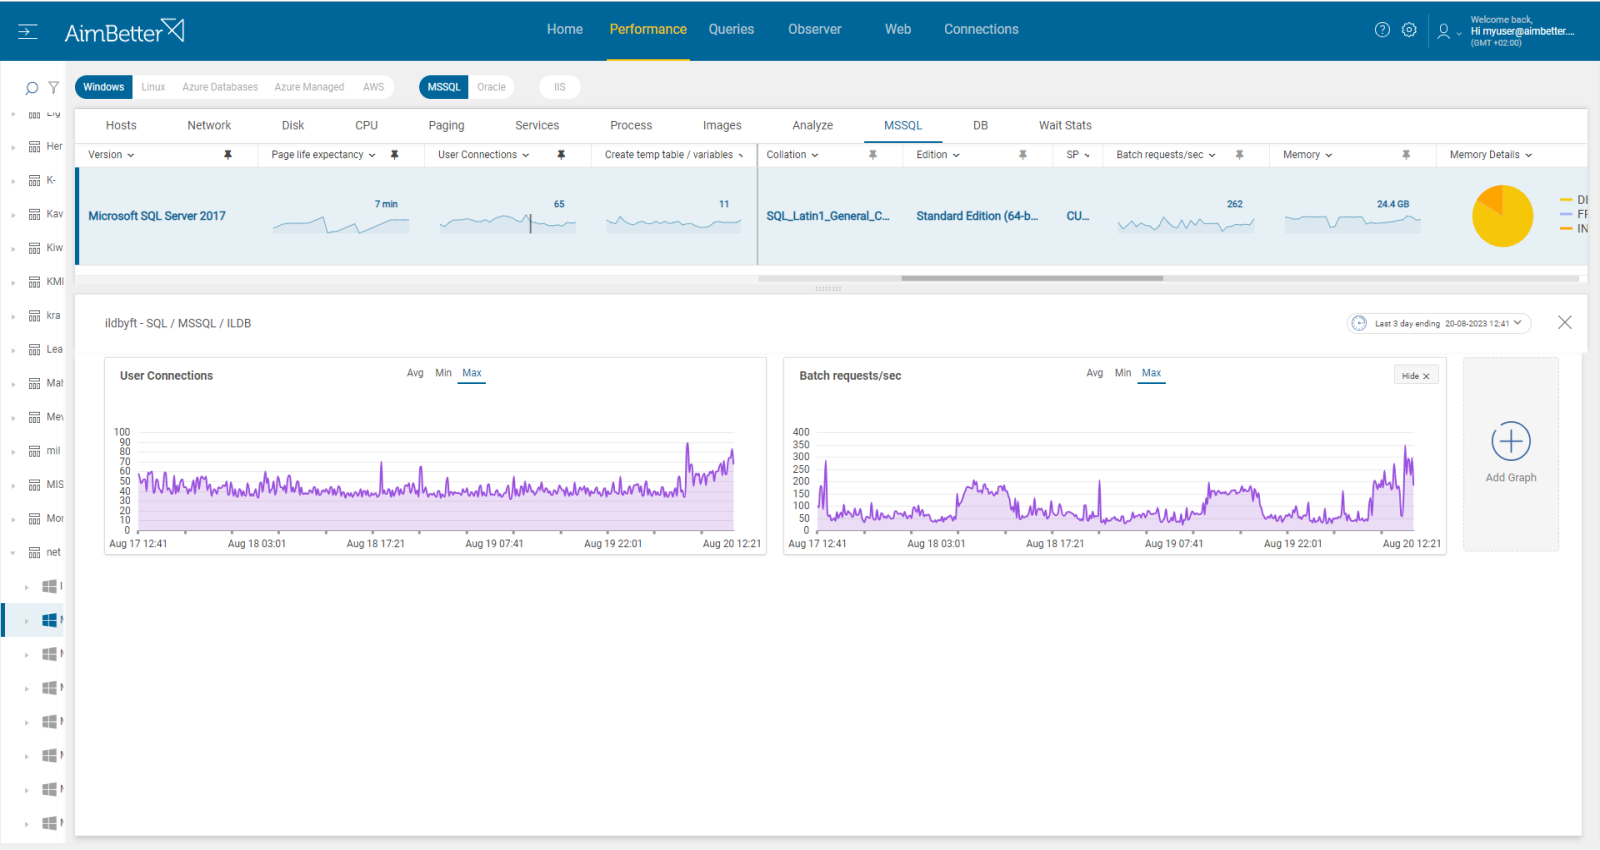
- Use database tracking tools, such as SQL Server Profiler, Azure, or Amazon tools, to track the value of batch requests per second. Track the metrics of the number of executions and the number of user connections.
- Check the application’s logs for any unusual activity or errors related to connections. For that, you have to search in the logs.
- Try to check if, in parallel to increased user activity, there is also a higher batch request per second.

Recommended action :
Check the source of the increased activity. It might be a single user running multiple processes, more users working at the same time, or else it might be related to security issues. It’s important to make sure that the increased activity is from a reliable source.
You should also prioritize queries and optimize them.
2- Increase in transaction volume. Priority: Medium
In some cases, when there are many transaction processes at once, it might increase the number of batch requests for a second. Transactions are one way to modify or retrieve data in a database.
In a business environment, where applications might require real-time and updated data with complex operations, more transactions will lead to more batch requests.
Problem identification:
An increase in transaction volume in comparison to normal database activity, along with an increase in batch requests.
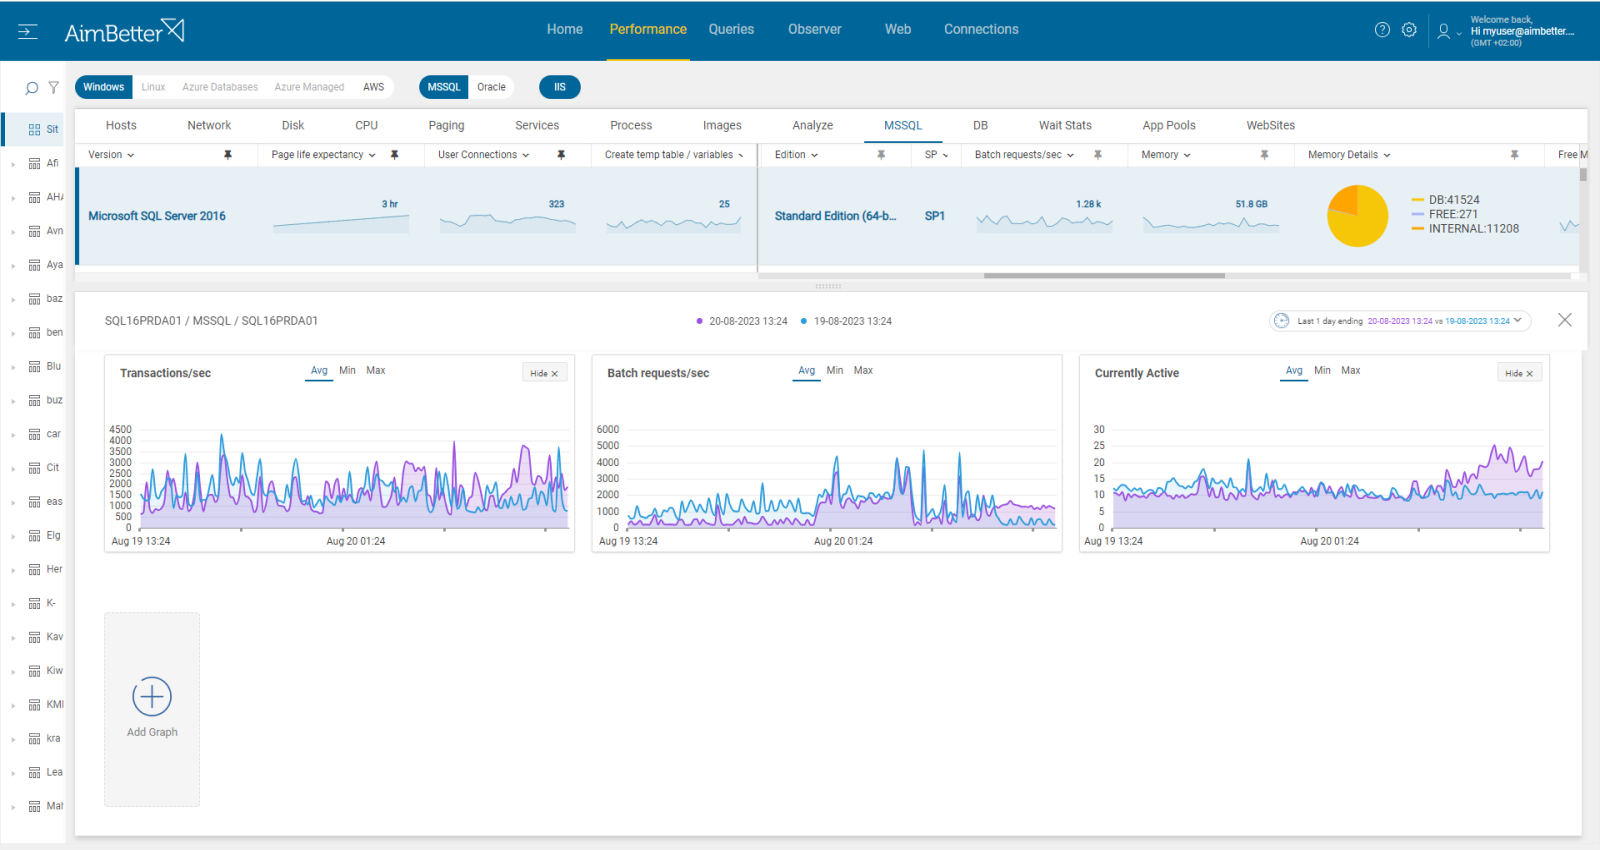
- Use the performance monitor in order to start tracking batch requests per second, transactions per second, and active session numbers. You probably will have to do several follow-ups since you need to find out which is the normal activity time and which is the increased activity time.
- Knowing your working environment well, try to anticipate events when you would expect to see increased transaction volume along with batch requests. This will indicate the reason for the increased batch requests.
- Identify whether there are specific applications or procedures that are the source for most of the transactions and try to see how to decrease them.
Recommended action :
Ensure that queries performance is optimized, and check execution plans or missing indexes.
Optimize queries for better performance using proper indexing, parameterization, and efficient coding practices. Regularly review and optimize application code.
Try to minimize the number of single transactions by grouping several operations in one batch. Schedule non-routine queries to low-activity hours. Be aware of your business working flow in order to be ready for anticipated increased activity.
3- Complex Queries or inefficient query codes. Priority: High
Queries having many joins, aggregations or subqueries might cause higher batch requests. In addition, queries performing bulk inserts or deletes might also affect higher batch requests. Bulk data load is defined as the process of rapidly inserting a large volume of data into a database. Queries having too many operations in one batch might cause higher batch requests.
Problem identification:
Identify bulk load operations in SQL Server by monitoring database activity and analyzing performance metrics. Furthermore, search for large queries with many operations. Check which or the queries are related to a higher number of batch requests.
- Use tracking tools in order to identify bulk insert operations or queries with complex joins. For SQL Server, you might use SQL Server Profiler or extended events. It might take time and require a DBA. Check which of the queries were involved at the time of higher batch requests, comparing with outcomes from the performance monitor.
- Another option is using performance counters related to bulk insert operations, or query performance views to identify statements involving high row count. Identify irregular I/O patterns to identify bulk operations or large queries.
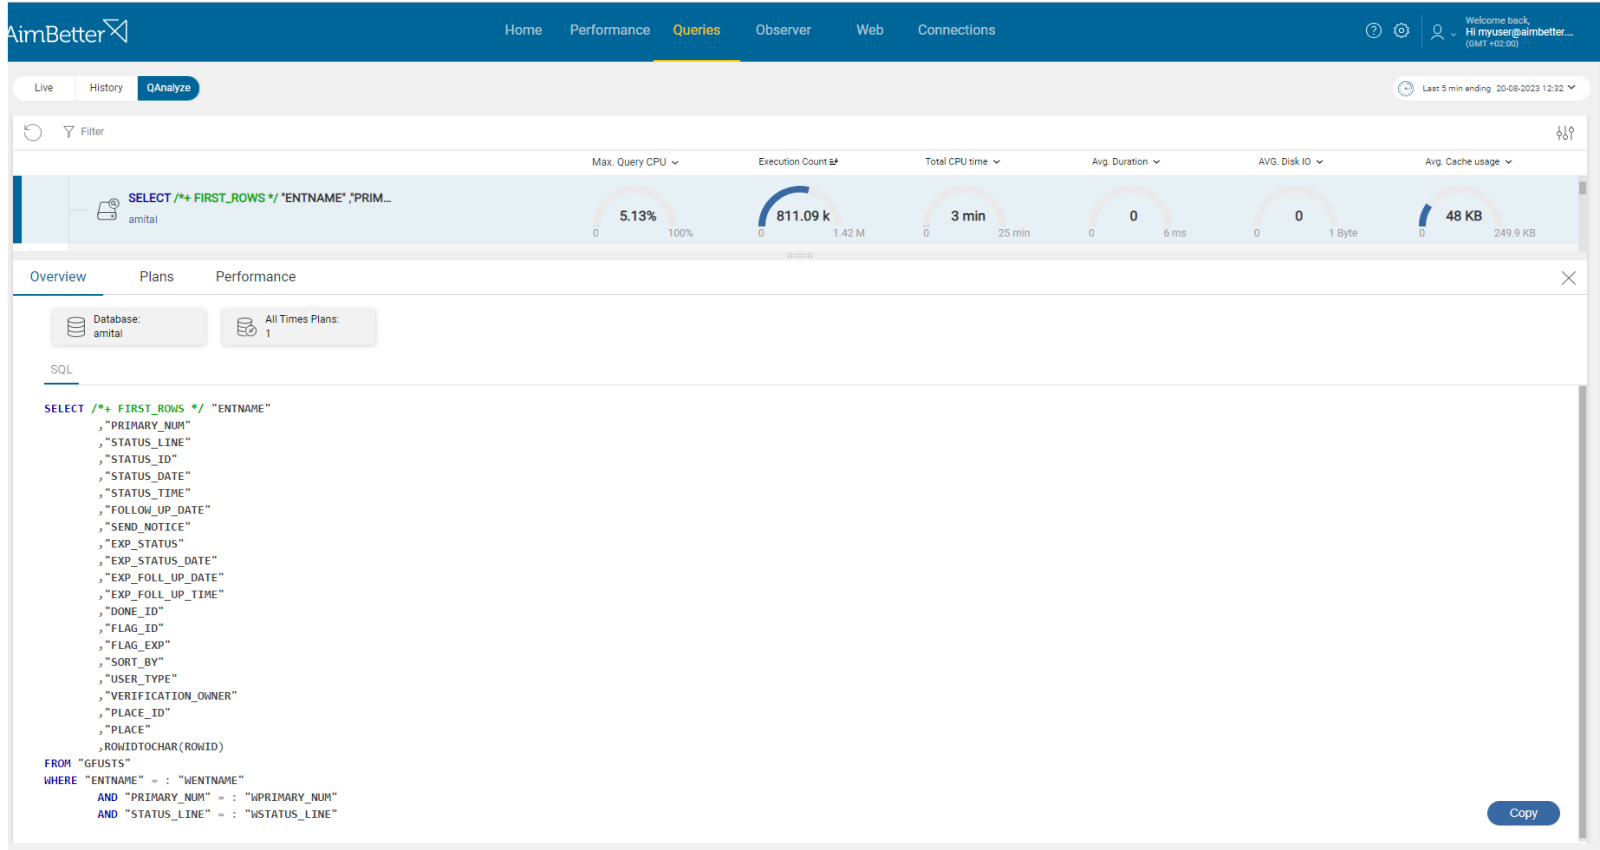
- Investigate the query execution plan in order to identify queries with meaningful and many joins operations, or queries with inefficient code.
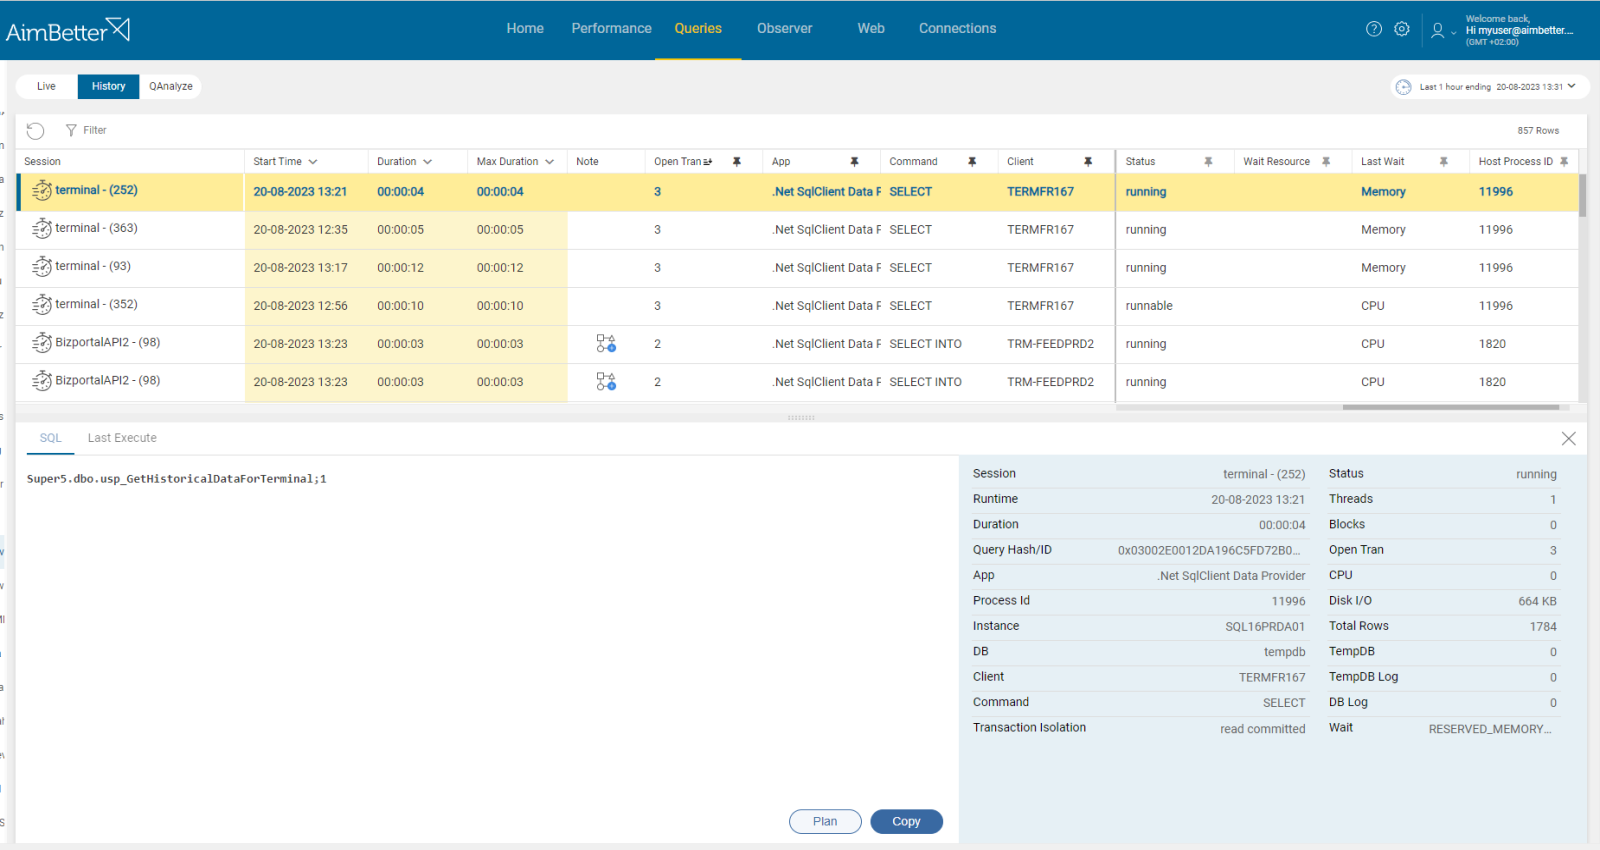
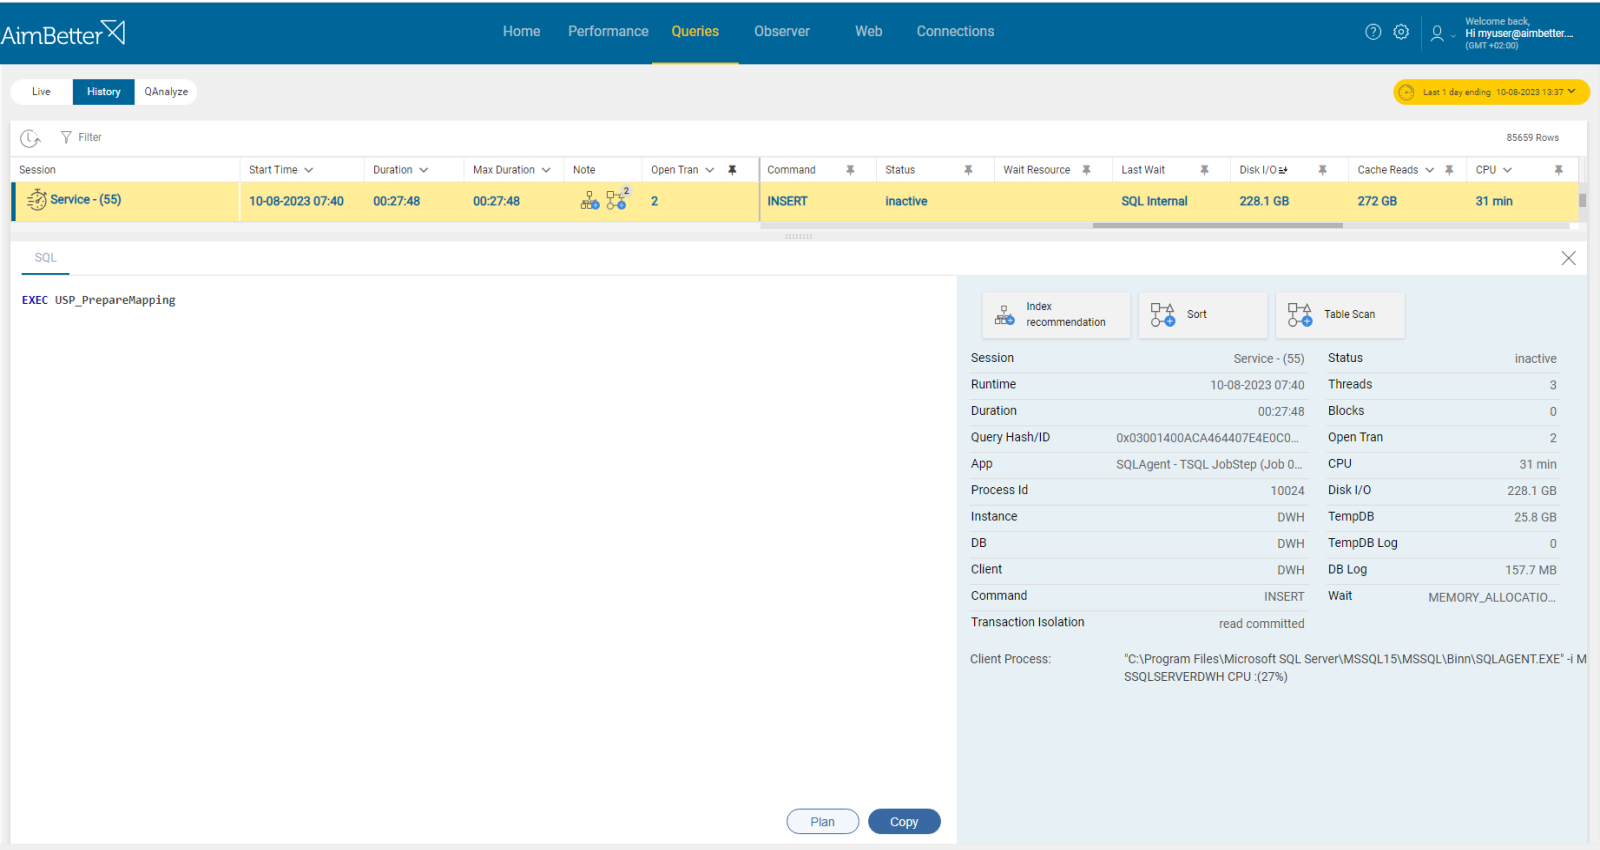
You don’t have to work hard in order to identify large queries or bulk operations. Filter by needed content using our queries panel only when receiving an alert about higher batch requests per second value.
If the query code is inefficient you will receive a note about the non-optimal execution plan once you filter for it.

Recommended action :
Avoid implementing many large queries and divide them into several executions if possible. For bulk operations, consider implementing minimal logging and better data-loading options. Instead of inserting all data in a single batch, consider breaking bulk operations into smaller chunks. Investigate the queries’ execution plans in order to find abnormalities and what might be improved.
4- Improper balancing of workload. Priority: Medium
Maintenance tasks, jobs, or heavy reports might contribute to increased batch requests during their execution. Usually, these queries contain several subqueries and have many operations on a single batch or overloading operation over OS resources due to extensive use of it.
Problem identification:
Check the general activity of the database during an increase in batch requests per second, with special attention to the applications from which the query originates. Check whether there is an increase in OS resource utilization during the same time period.
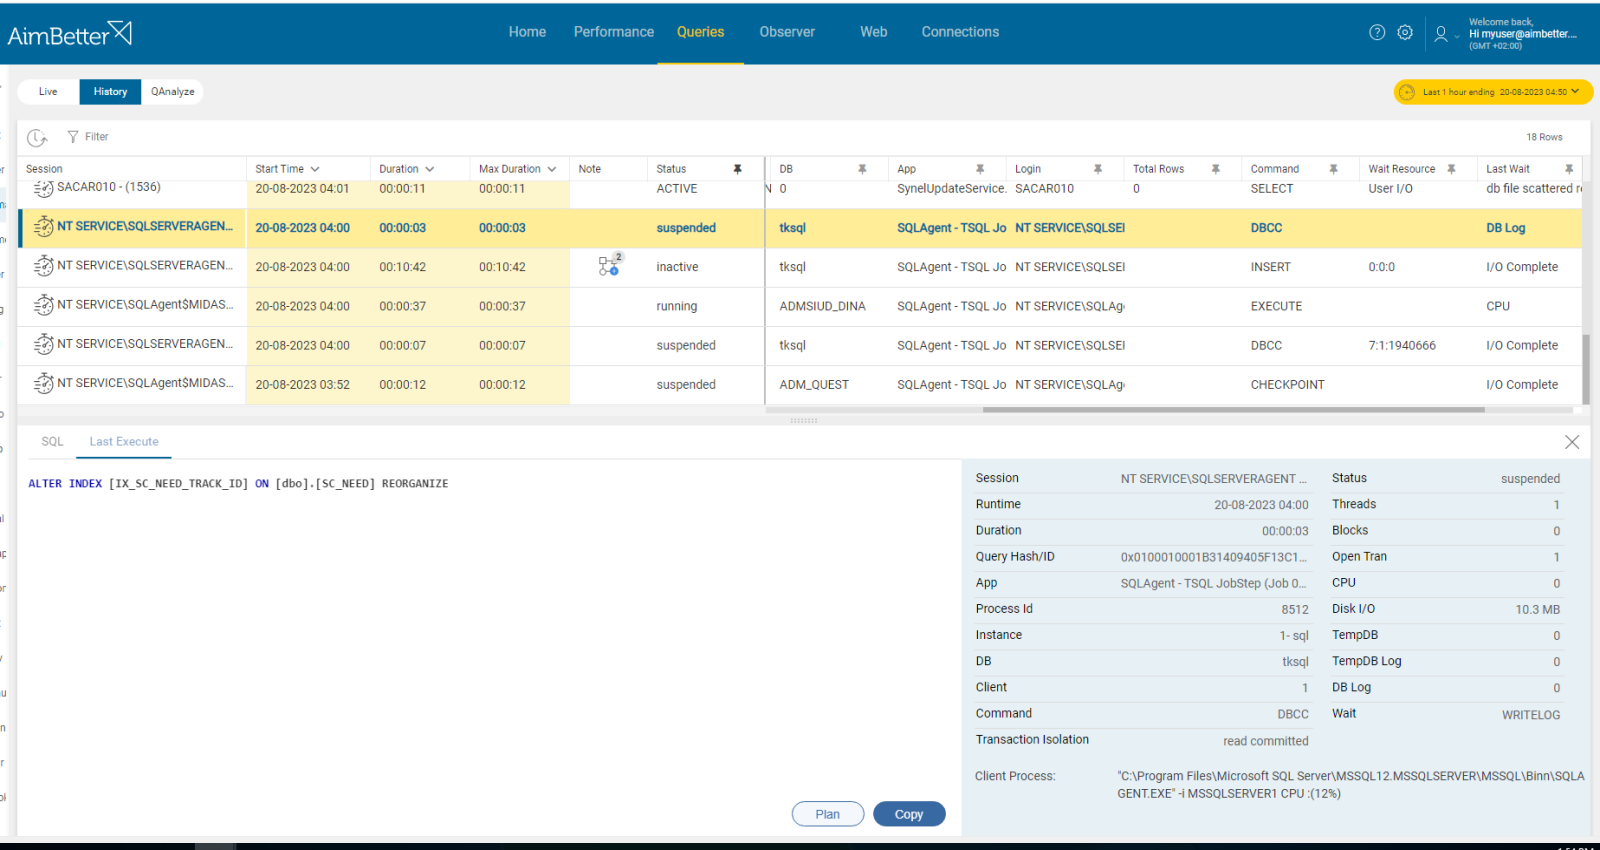
- Use tracking tools in order to identify overloading queries over resources that have applications related to maintenance tasks. For SQL Server, you might use SQL Server Profiler or extended events. It might take time and require a DBA. Check which of the queries were involved at the time of higher batch requests compared with outcomes from the performance monitor. Make sure to do several tracking- one at normal activity time and a second at higher batch request periods, for comparison purposes.
- Make sure to review your scheduled tasks – maintenance and jobs (including backups, index maintenance, statistics updates, and database DBCC checks). For jobs specifically, you can check the job activity monitor history.
- Investigate the specific queries that are causing overloading and check how you can improve their performance.
- Make sure to follow up on the changes over time and whether the batch requests value decreases or not.
Recommended action :
Review your maintenance tasks and try rescheduling them to minimize periods of activity.
Analyze the queries’ performance and tune them to reduce resource usage. If needed or possible, upgrade hardware resources such as CPU, memory, or disk storage.


