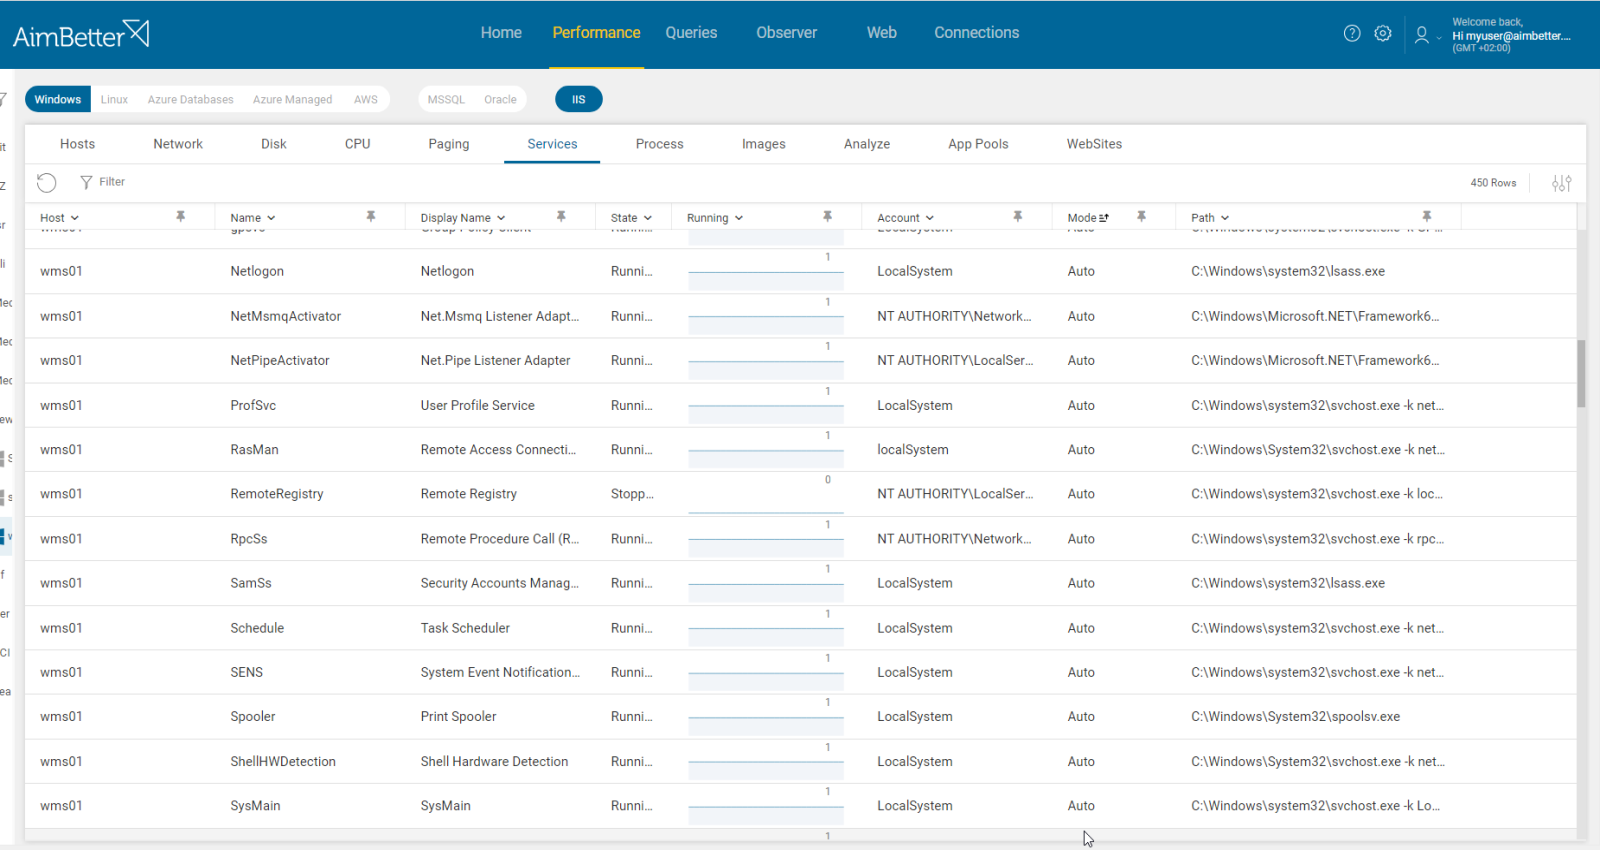
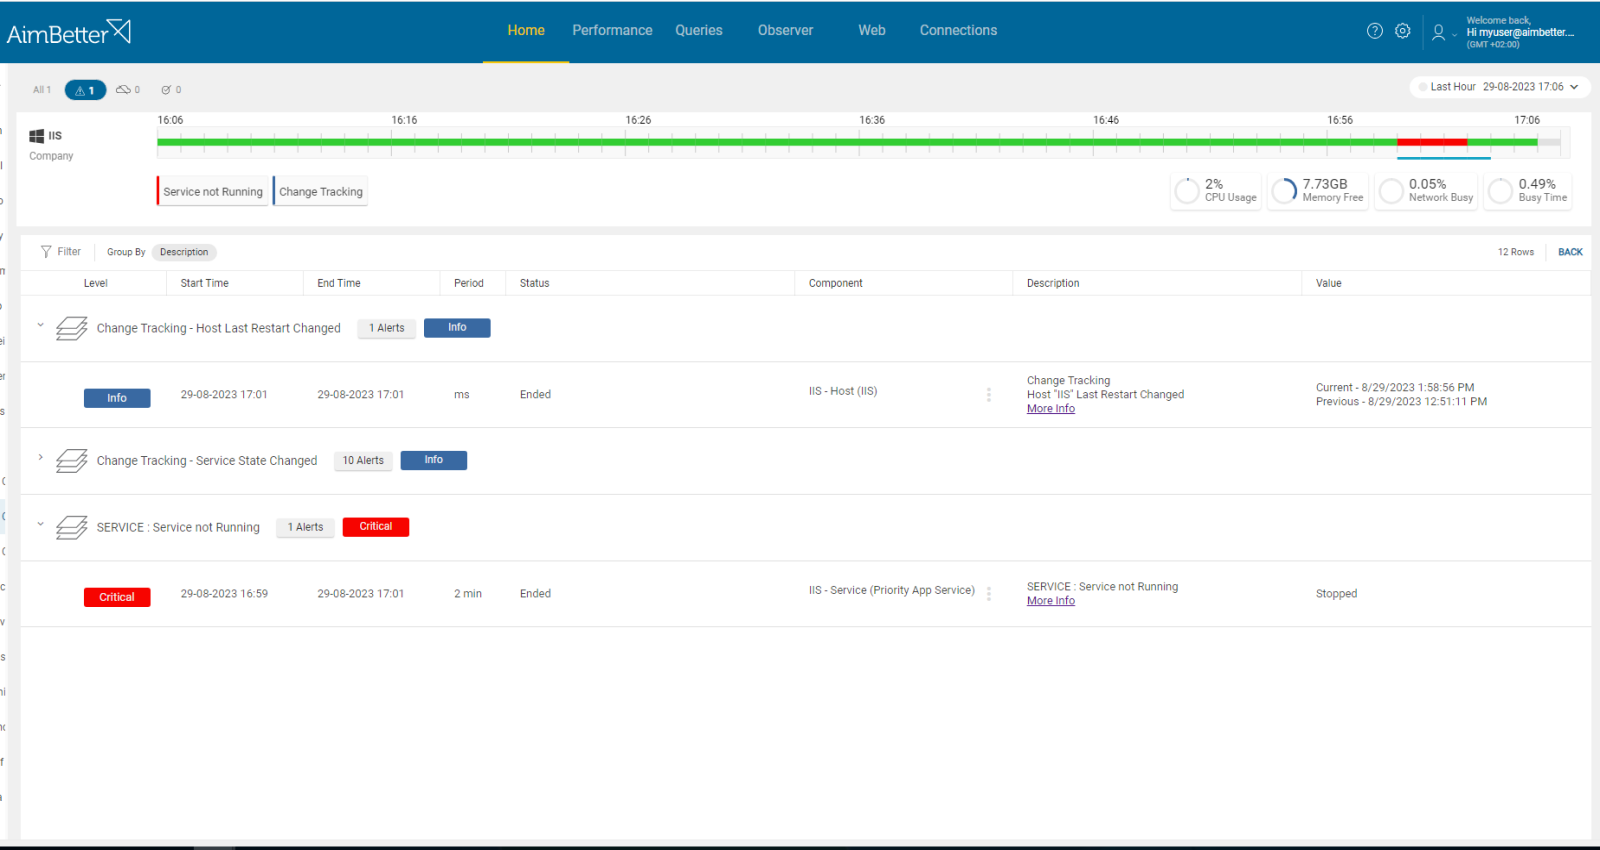
This alert displays critical information about a service that is not running over time. This way, essential services that should be running can be tracked if they have not restarted or are still stuck as stopped services.
You can edit the list of services that will raise this alert. By default, it alerts on SQL server agent or mssql services, tabula task scheduler, xis_loader, Priority services (.net, redis, app, search, wms services), Oracle service (service or ora).
Many applications (ERP, SAP, Priority, BI, etc.) run using the SQL engine as the foundation. This alert indicates that the dependent service is not responding, and this is the cause of disruption, not the SQL Server itself. Appropriate measures can be taken without unnecessarily requiring the DBA team.
Find out how you can save hours of work when investigating the root cause of this issue.
Symptoms :
Users report that some dependent application (typically ERP, SAP, Priority, BI, Report Server, etc.) is not responding.
Impact: High
Users can’t access these critical applications.
Expected behavior :
The services related to the required applications should be running and available 24/7. This alert is an informational notice concerning non-SQL-related issues to be prevented.
Possible causes:
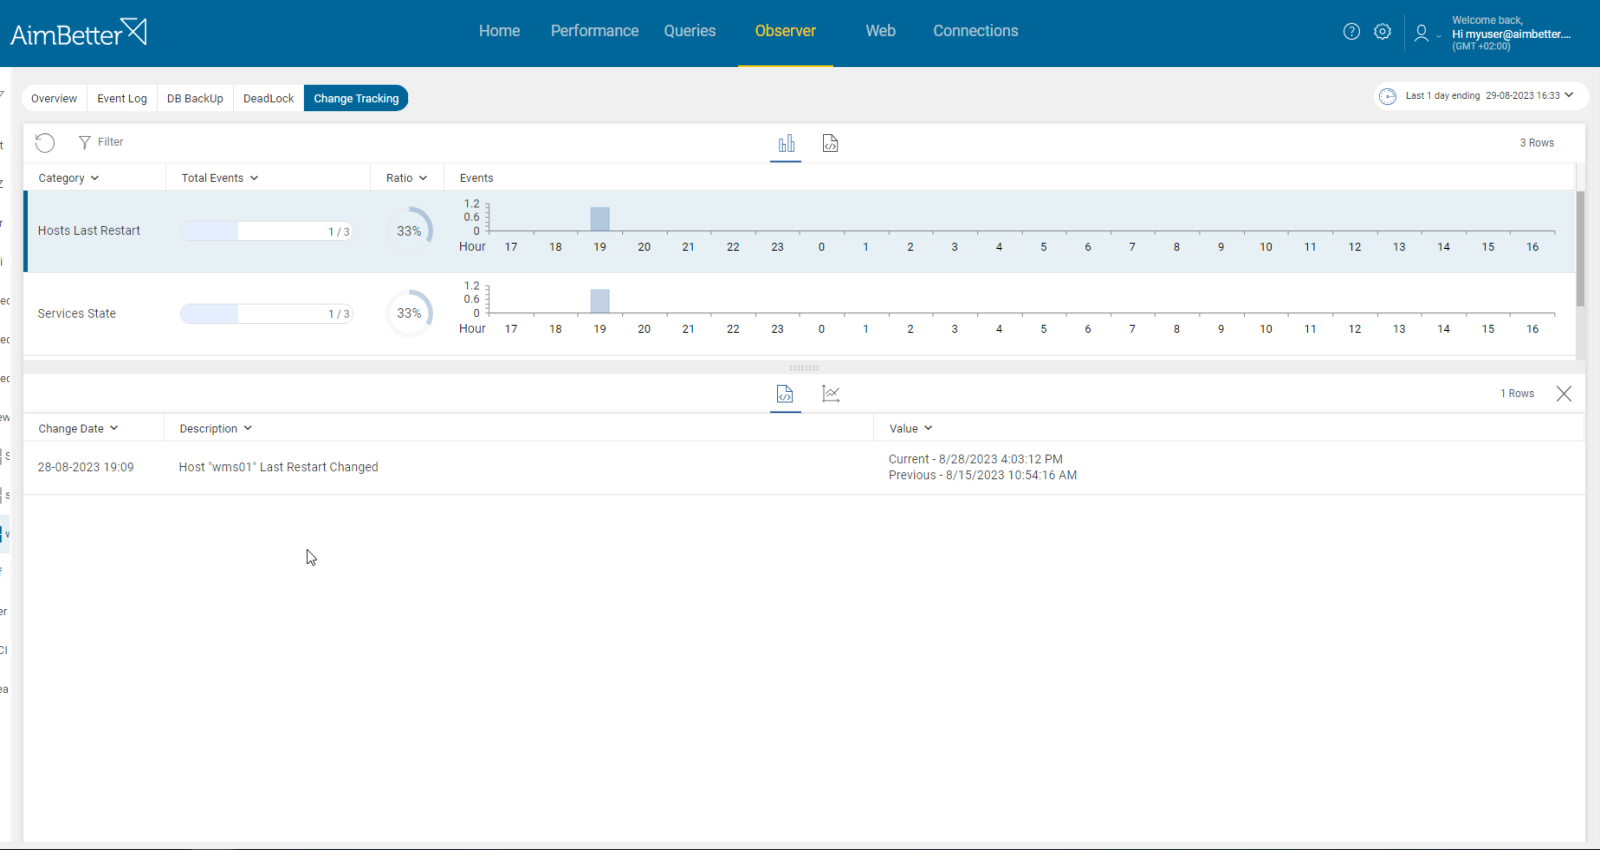
1- Server Reboot. Priority: Medium
Services might not start automatically after a server reboot or Windows update.
Problem identification:
Some application is not responding.
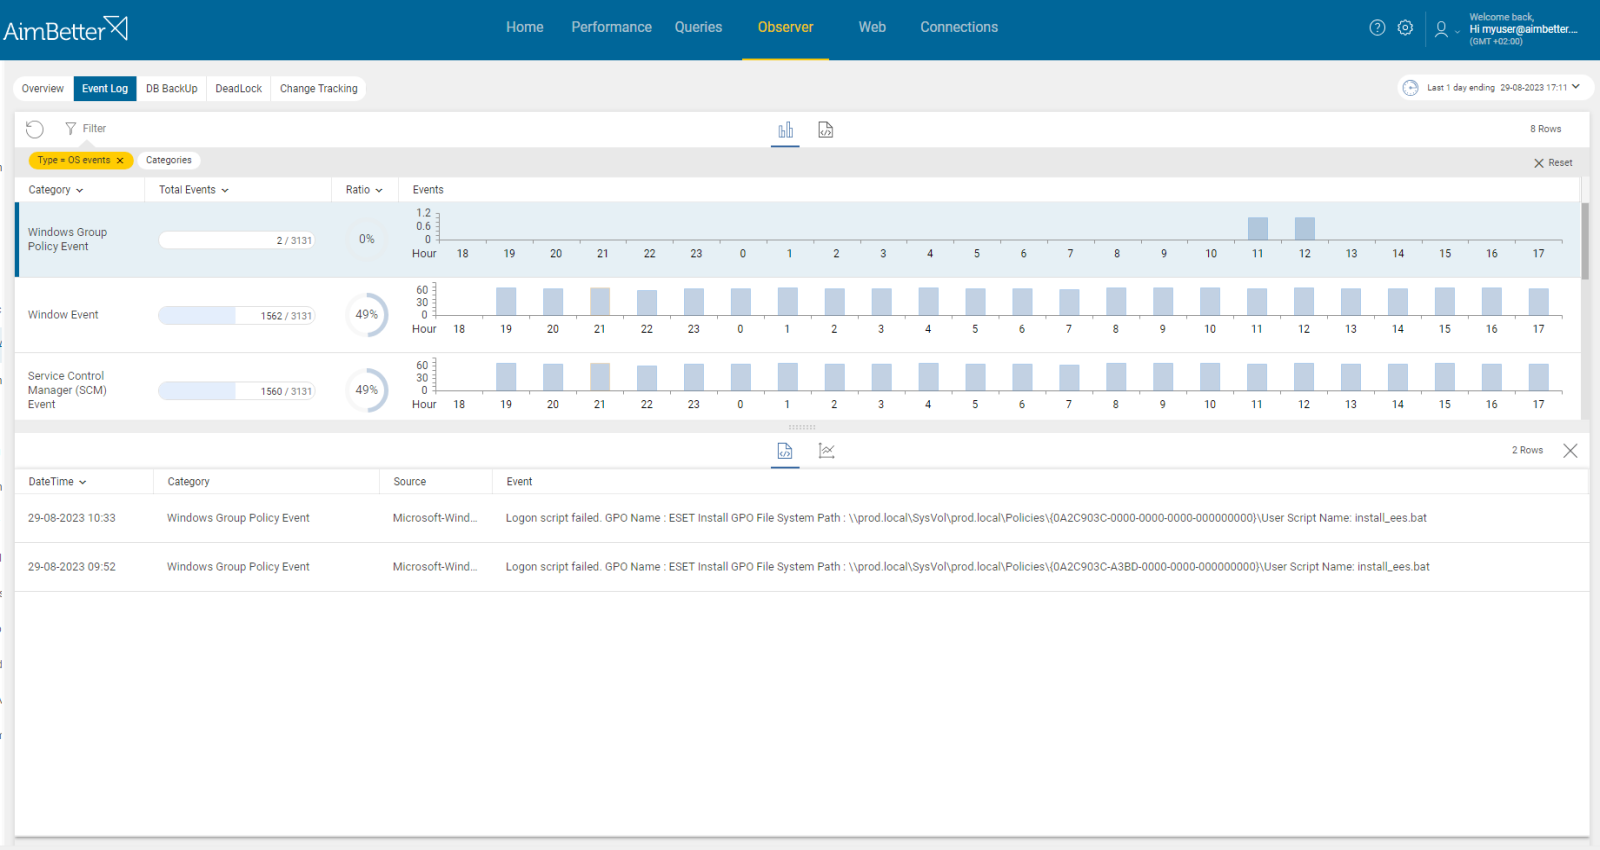
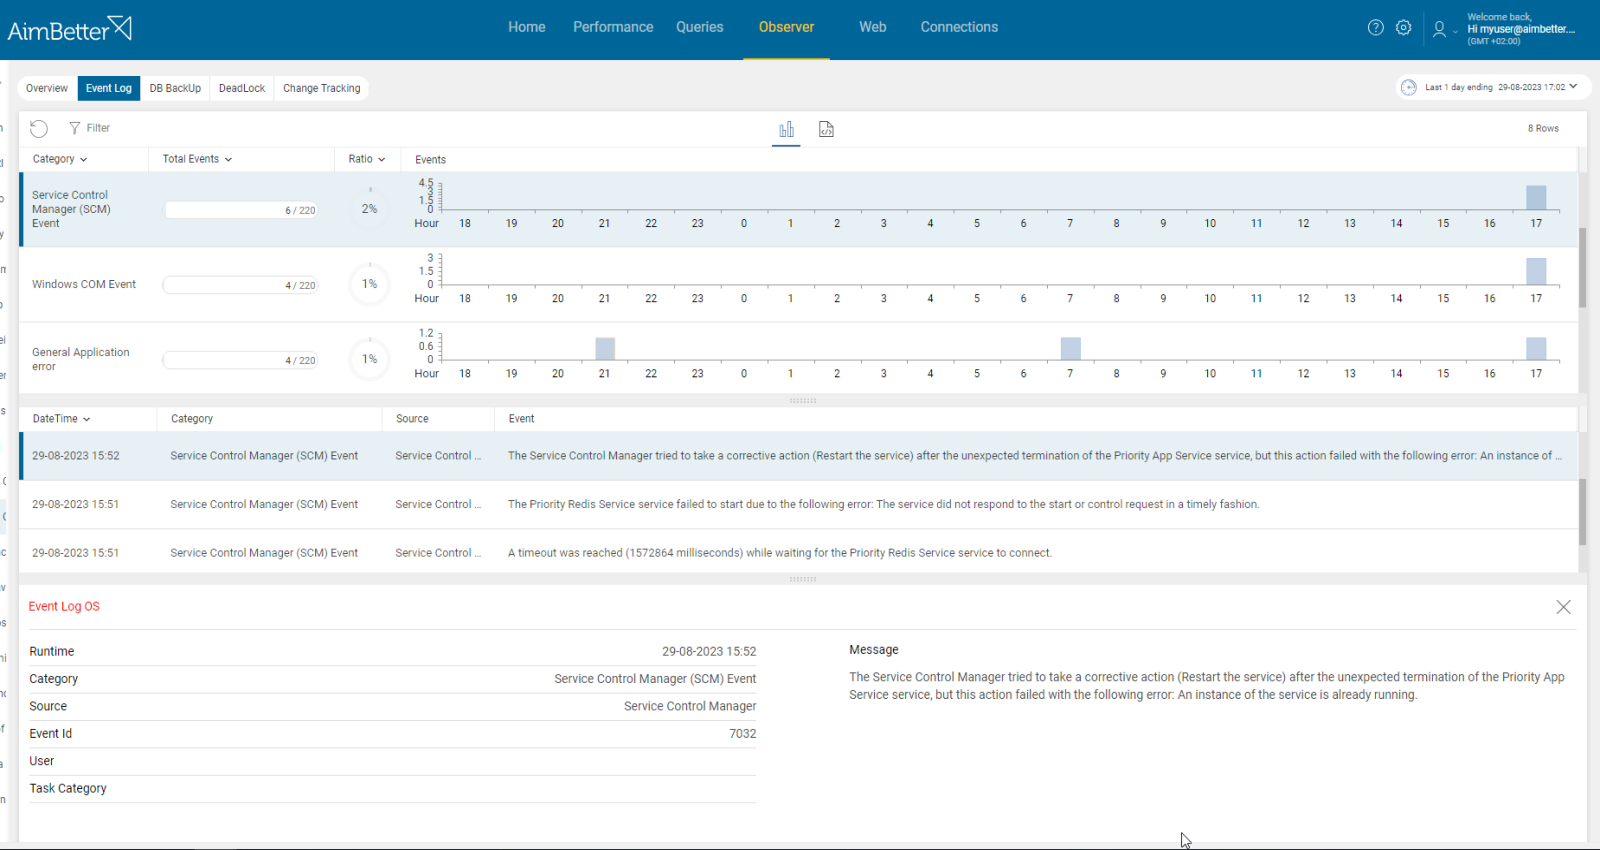
- Check the Windows Event log in the server, and look for events identifying when the service was stopped and what happened before and after. You will probably find events related to system restarts, shutdowns, Windows updates, or other system-level actions.
Recommended action :
Try changing the service setting to automatic and delayed start. It might help solve this issue.
2- Wrongly set or overloaded system resources. Priority: Medium
Resource limitations can prevent the service from initializing correctly.
If the service requires network connectivity and there are network configuration problems, it might not be able to start.
Services might not start with insufficient memory, CPU, or disk space.
Problem identification:
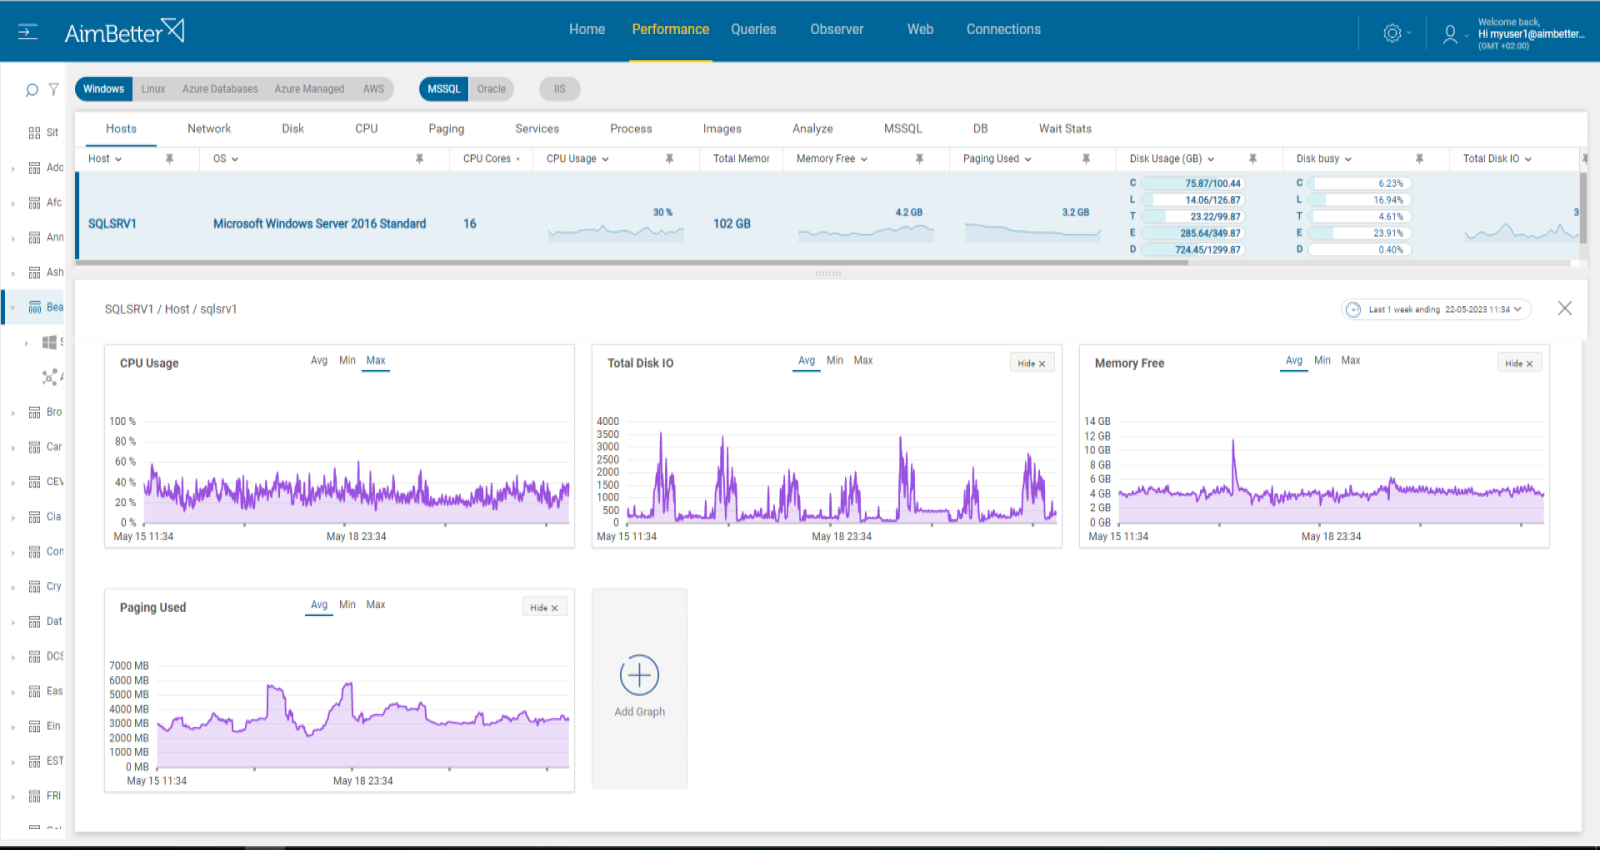
Check if CPU, memory, disk I/O, or network resources are highly utilized. Identify the source of the load and if it is recurrent.
- Check the Task Manager or Activity Monitor to identify an overload of hardware resources.
- Use OS tracking tools such as Performance Monitor to identify which processes use hardware resources. Use a network monitoring tool for network activity, and check how much traffic flows through your network and which applications or devices use the most bandwidth. Consider that most tools help pinpoint when a problem starts, which you can’t compare to old time frames.
- Investigate the system logs. For example, check the event viewer logs and look for errors related to OS components, such as CPU, Memory, or disk I/O errors. Check if these events happen next to the time when service started to be not running.
Recommended action :
If possible, distributing servers according to their primary function – application server, database server, and more- might decrease the overload.
Continuously monitor server resource utilization to identify load spikes on time.
AimBetter enables you to be proactive by identifying the real-time resource overload related to disruptive events.
3- Errors related to configuration or permission issues. Priority: Low
Application services are based on specific system settings to be activated well. Incorrect paths, ports, or connections might prevent a service from starting. This might also happen after environment changes, requiring complete settings from scratch.
In addition, if the service lacks the necessary permissions or has incorrect access rights to files, directories, or network resources, it may fail to start.
Problem identification:
Identify errors and logs of services and look for issues related to configuration or inadequate permissions.
- Look at the log of the service/s that have failed to start. Most of them log events and warnings that occur during startup. Look for any error messages that indicate configuration or permission problems.
- Check configuration files and look for any settings related to file paths, directories, ports, and access permissions.
- View the service’s permissions of files and directories.
- Check if the service is configured to run under a specific user or group and if this user has the proper access to resources or a service startup.
- Try starting the service manually and review the error message that comes along with the failure to start it if raised.
Recommended action :
Check current service configuration, access to files, and user running the service.


