Recently, one of our customers’ IT Manager found himself in the midst of a perplexing problem—CPU overload. The case illustrates how having the right tools in place to figure out what needs attention quickly and then having enough information immediately to be able to go straight to the root cause and fix it saved endless hours of non-productive investigation.
The “secret weapon” in this case is AimBetter’s RTPS platform, which pointed to the proper remedy in just a few steps.
Our customer’s once smooth-running server had started to exhibit signs of strain. The symptoms were clear: sluggish performance, frequent freezes, and an unwelcome fan chorus that seemed to be working overtime.
No stranger to the inner workings of a computer, this experienced IT Manager initially tried the usual fixes—closing unnecessary applications, running a virus scan, and rebooting the system. However, the problem persisted. The next step taken was to initiate a long investigation into recent software installations or updates, potential changes in usage patterns, and any recent encounters with error messages. He embarked on a journey of exploration and diagnostics through checking system resource usage, monitoring task managers for CPU-hungry processes, and investigating recent software changes. Despite his efforts, the root cause remained elusive.
He then engaged his team to conduct a more in-depth analysis, examining system logs, running specialized diagnostic tools, and even delving into the intricacies of hardware configurations.
Frustrated with all these fruitless efforts, this IT manager was introduced to a DBA expert team that introduced the AimBetter RTPS platform and showed how easy the investigation of this problem could be.
The investigation
With AimBetter, any IT professional can get to the root cause of CPU overload. Let’s see how easy it is:
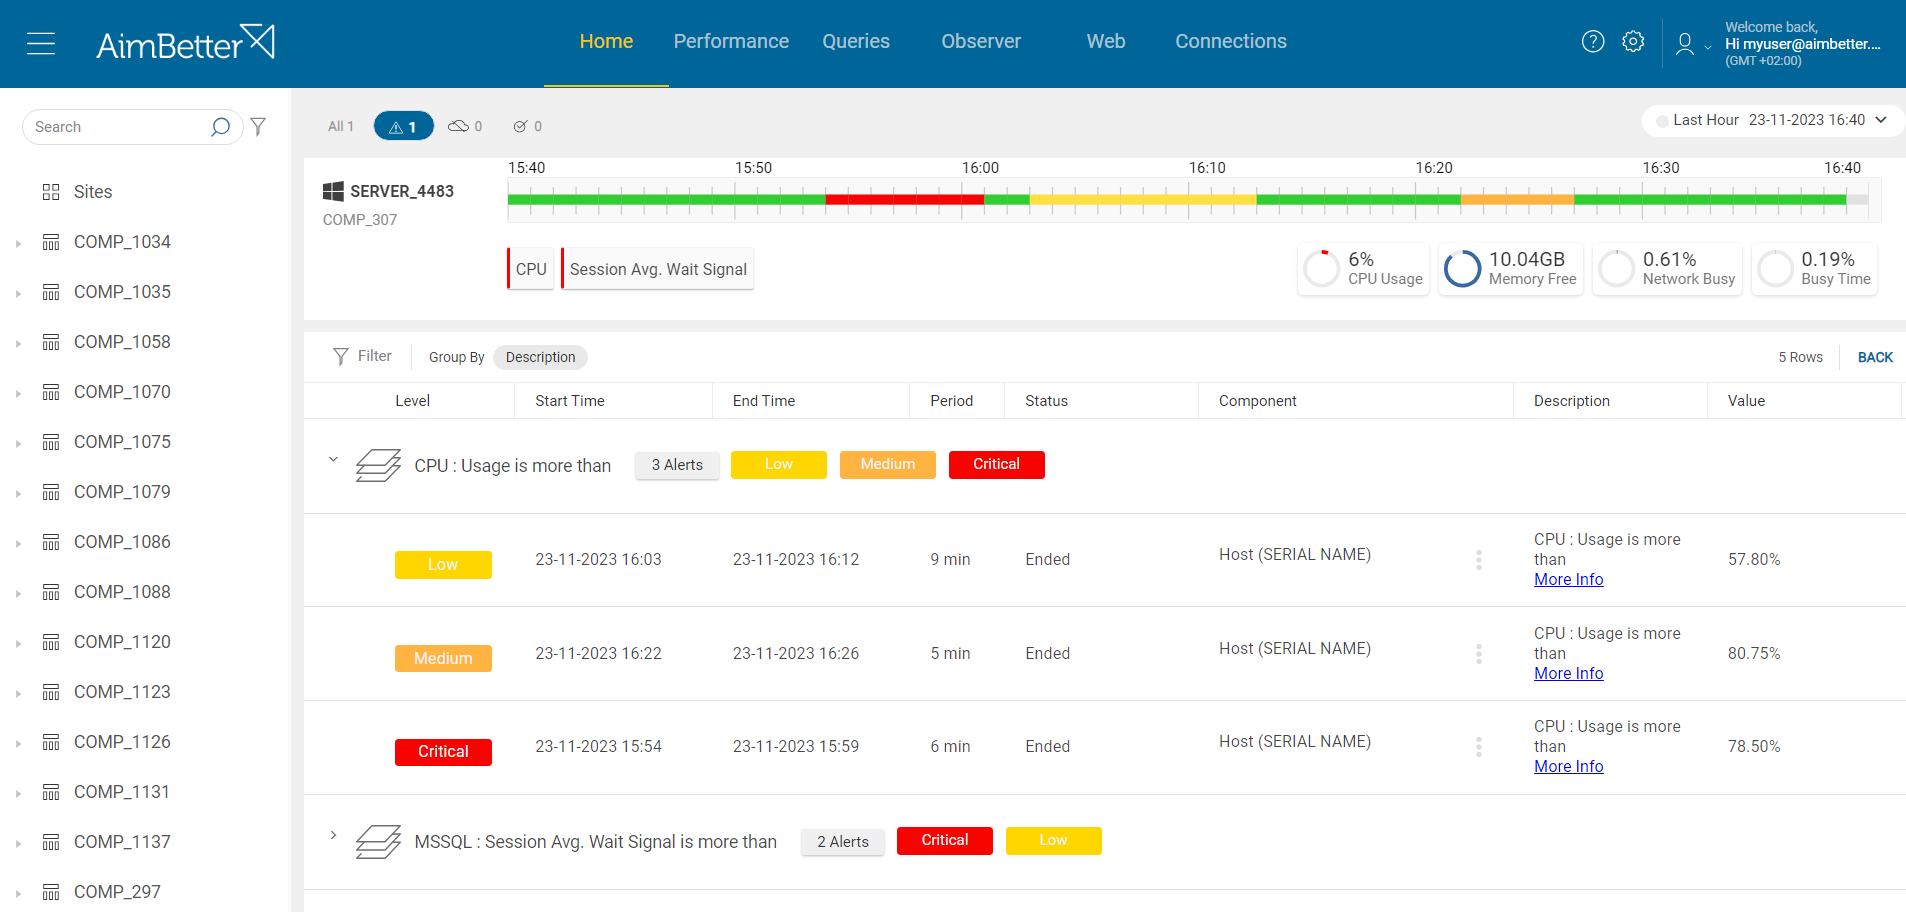
1- From the Home screen, the high CPU alert is active, indicating that this is an issue to be addressed in order to ensure the good performance of the system environment.
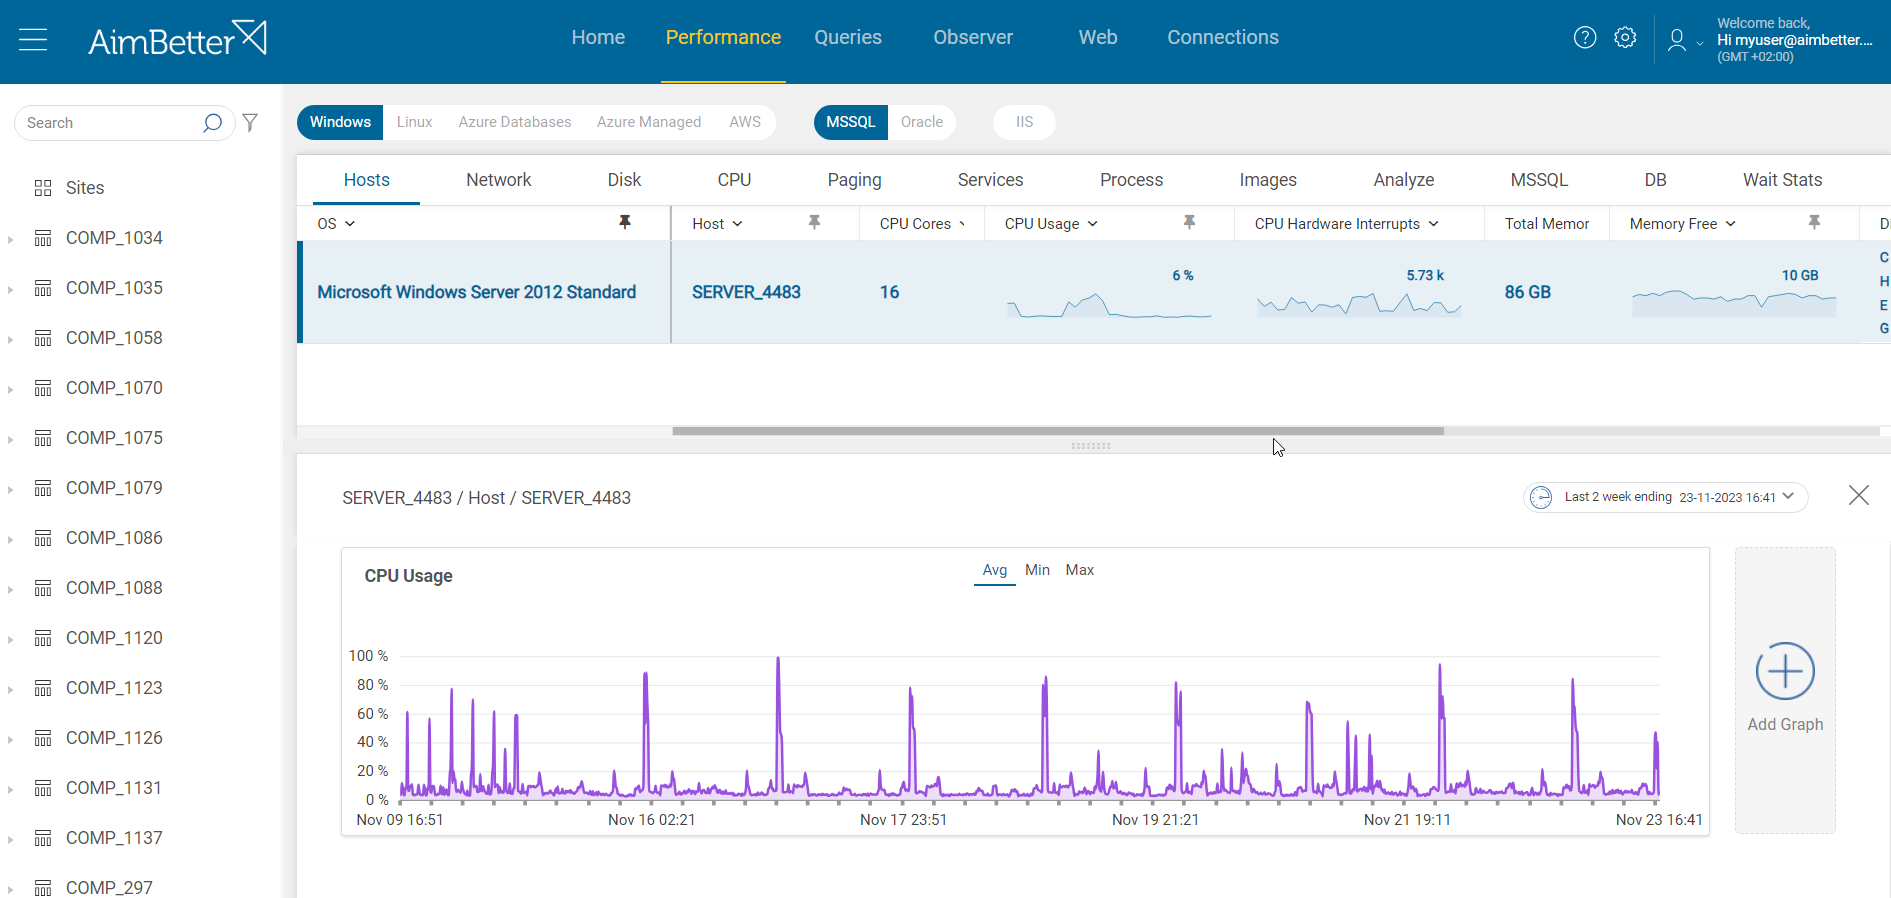
2- The next step is going to the Performance Tab to check the CPU behavior over time. Clicking on the CPU Usage graph opens a graph of it’s performance over the period selected. This period can be easily changed and a comparison with another period added.
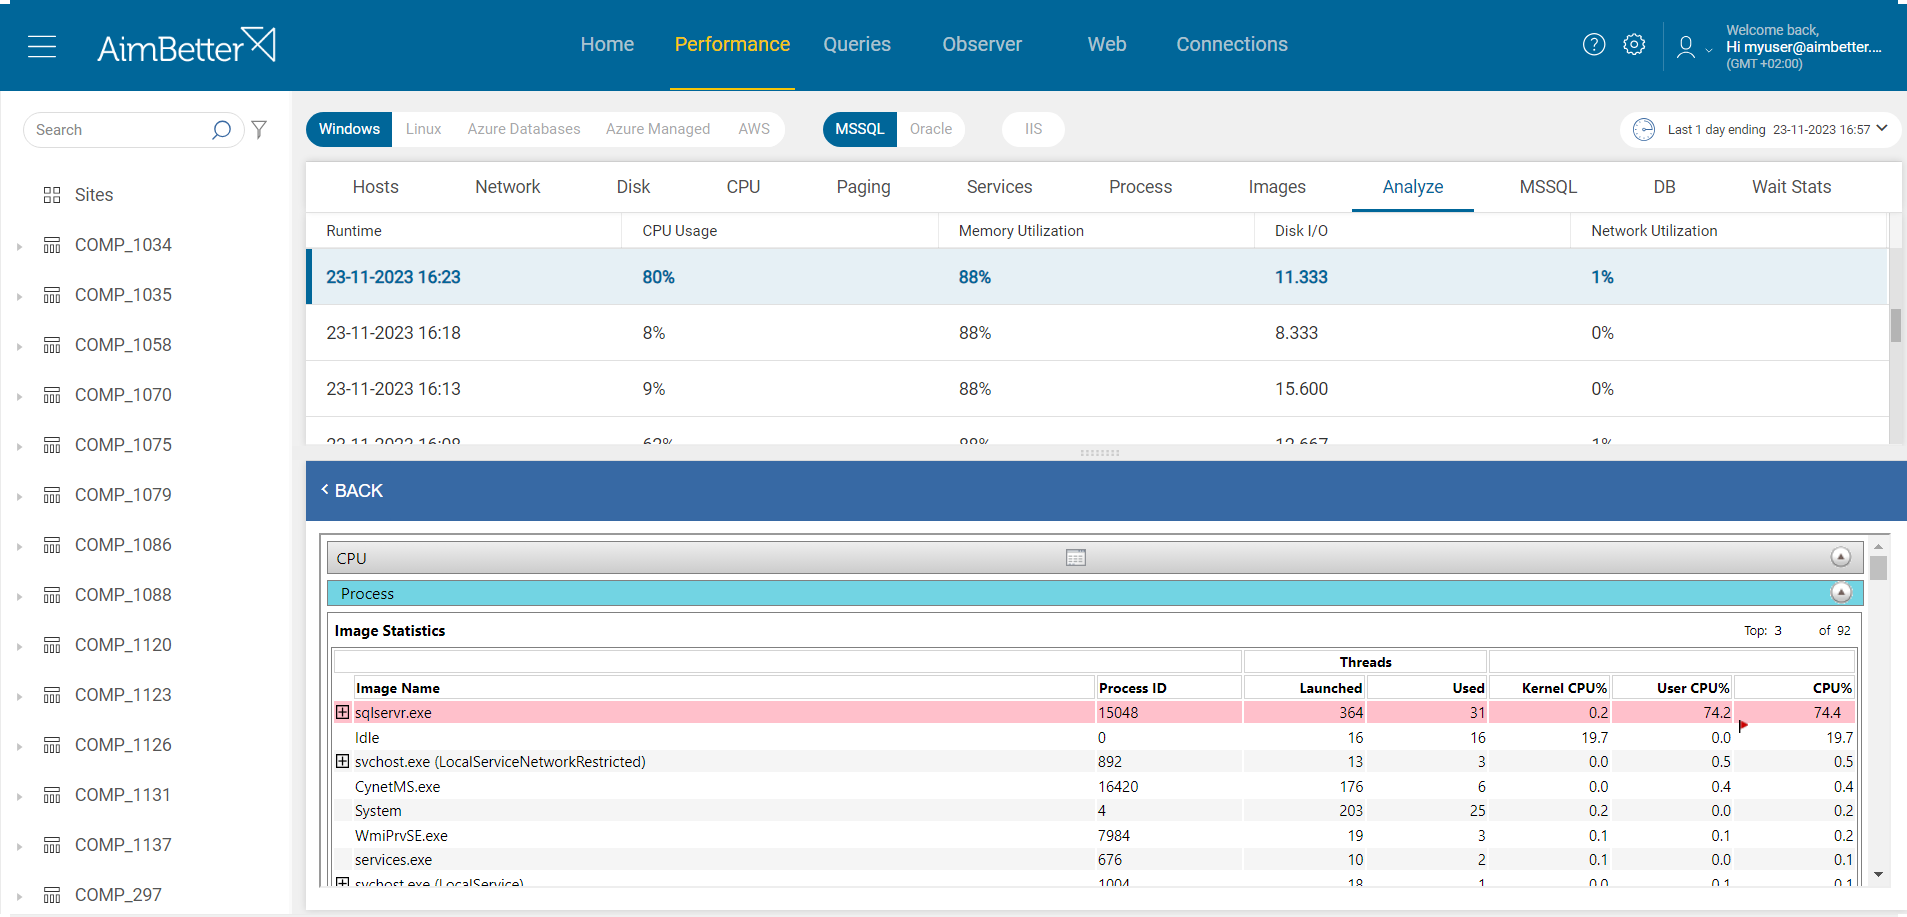
3- To understand the root cause of these picks, the following step is to proceed to the Analyze Tab, displaying the processes responsible for loading the CPU in the selected period. In this example, we got that the source is in the SQL Server.
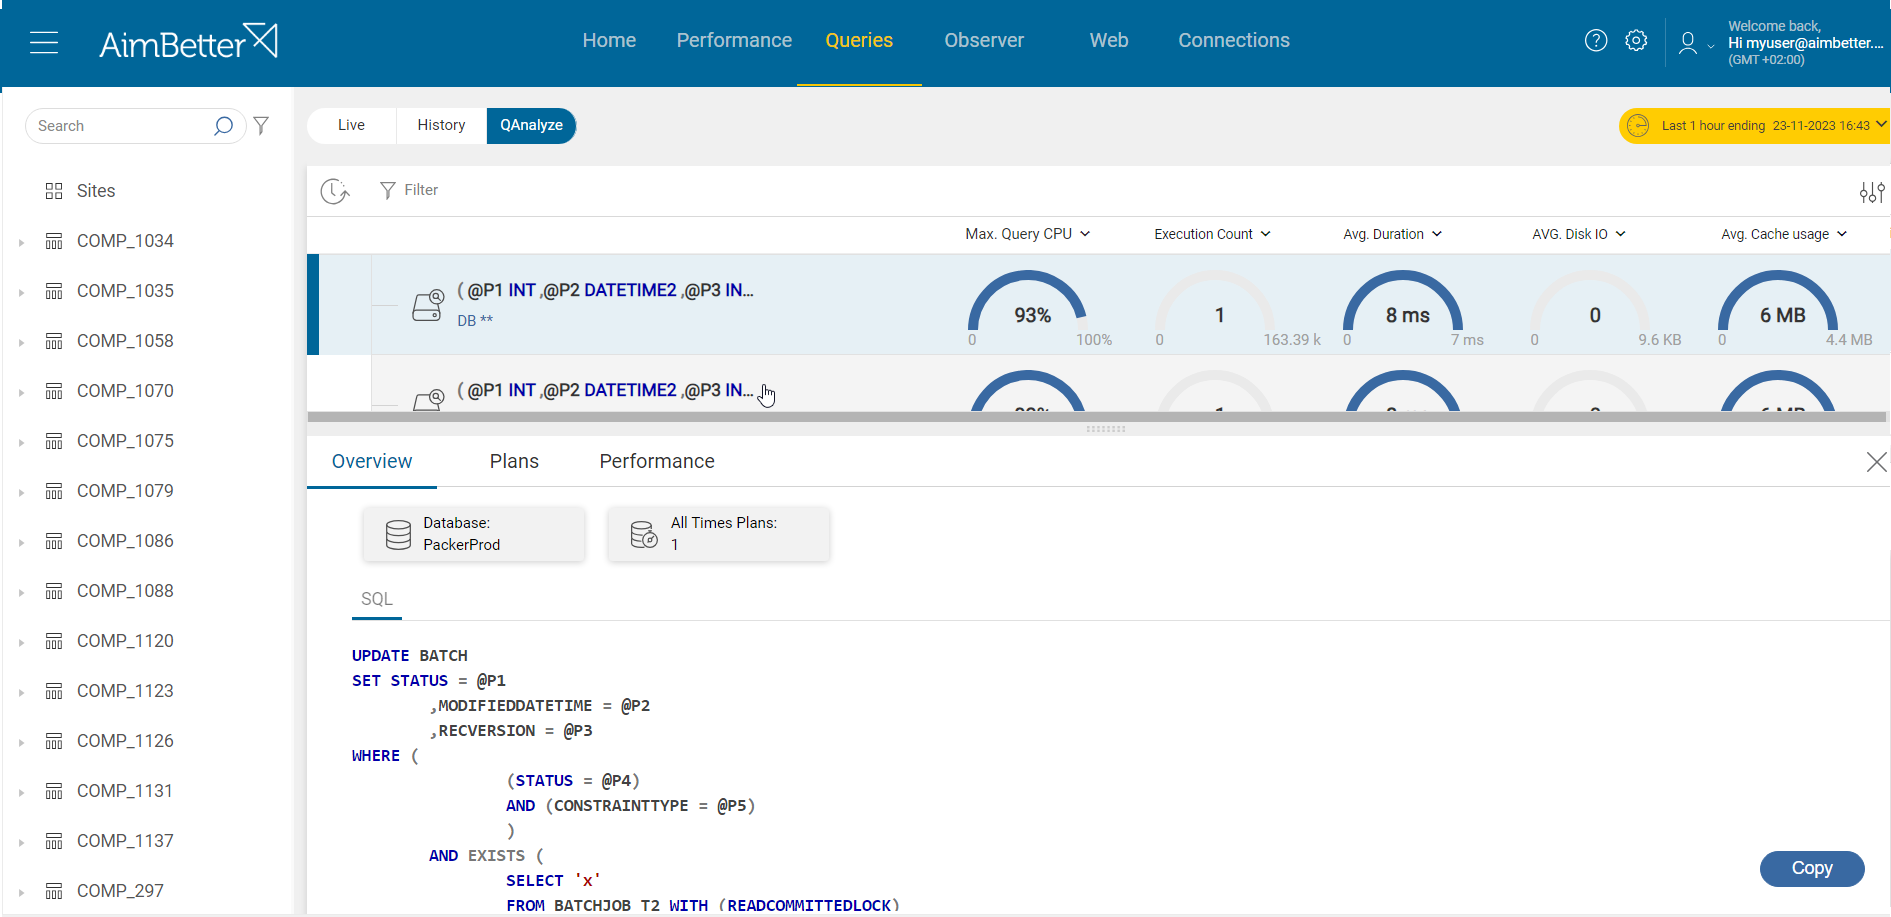
4- The following step is checking the Queries Tab, which showed that in the last hour, some specific SQL queries were the ones loading the CPU. From more than 163 thousand queries, working on the optimization of the first 3 or 4 queries based on the platform optimization recommendation would make a significant impact on the CPU.
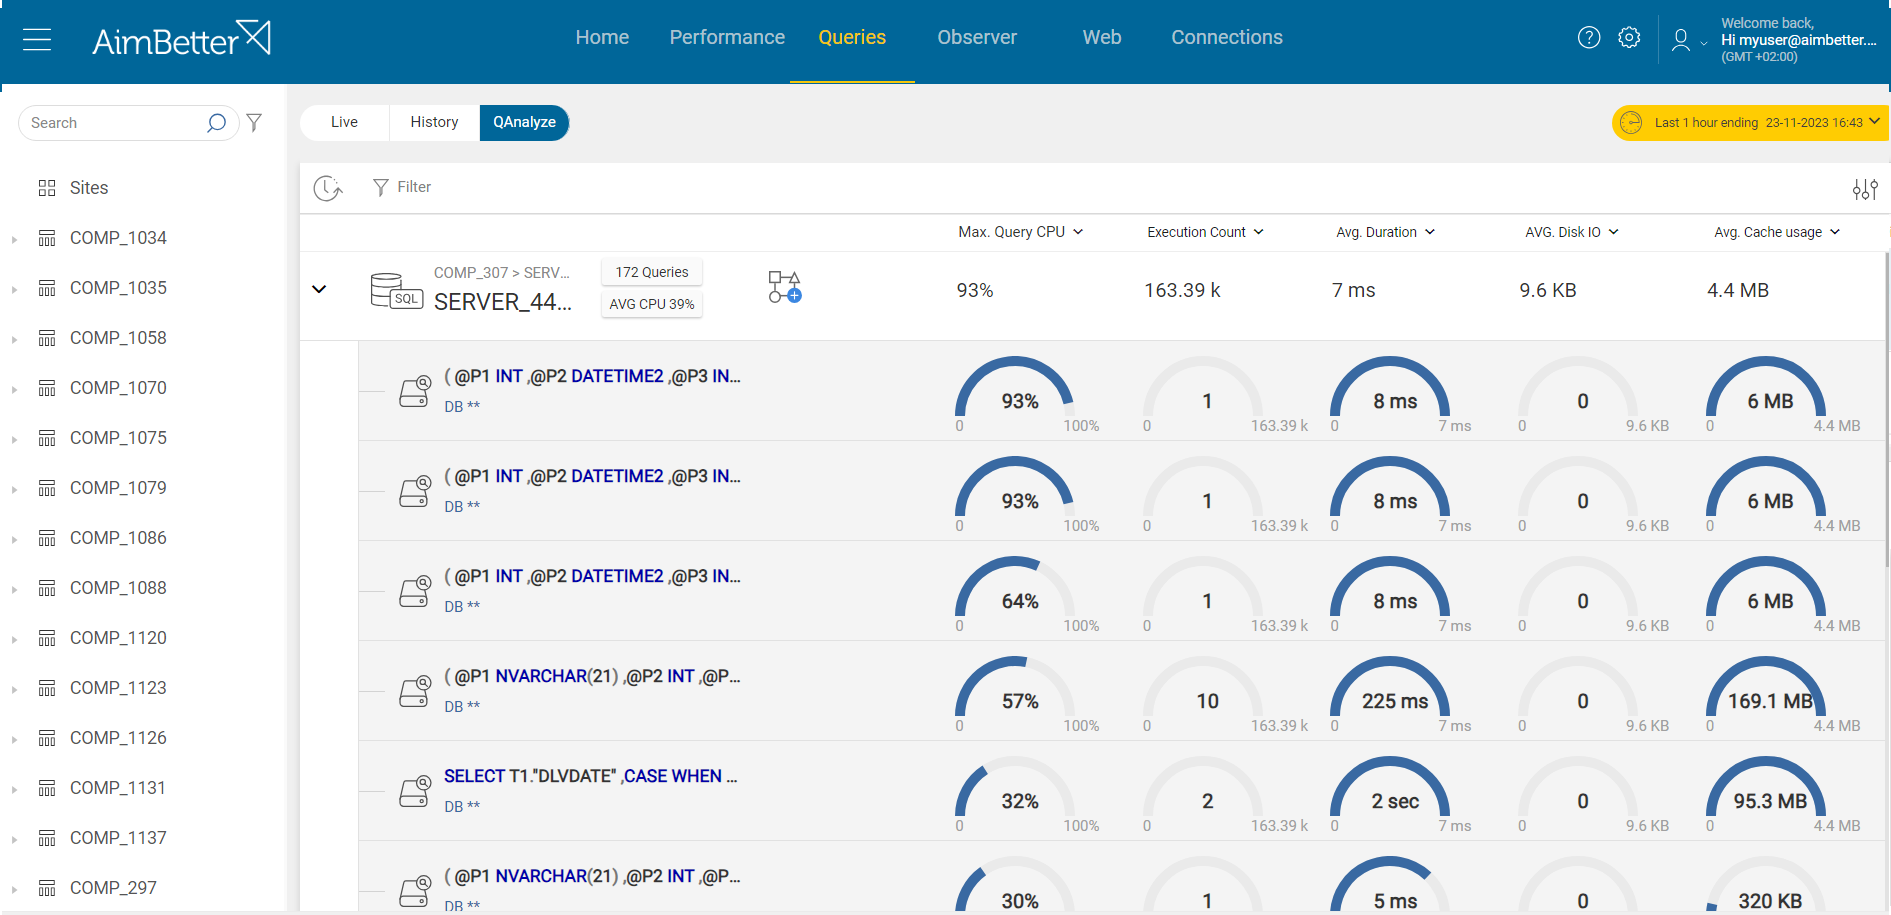
5- Clicking on these query lines, we can check the code recommendation and download the execution plan for further analysis.
That’s it! This is how the root cause was found in a few minutes and the CPU overload mystery was solved without adding resources or wasting time.