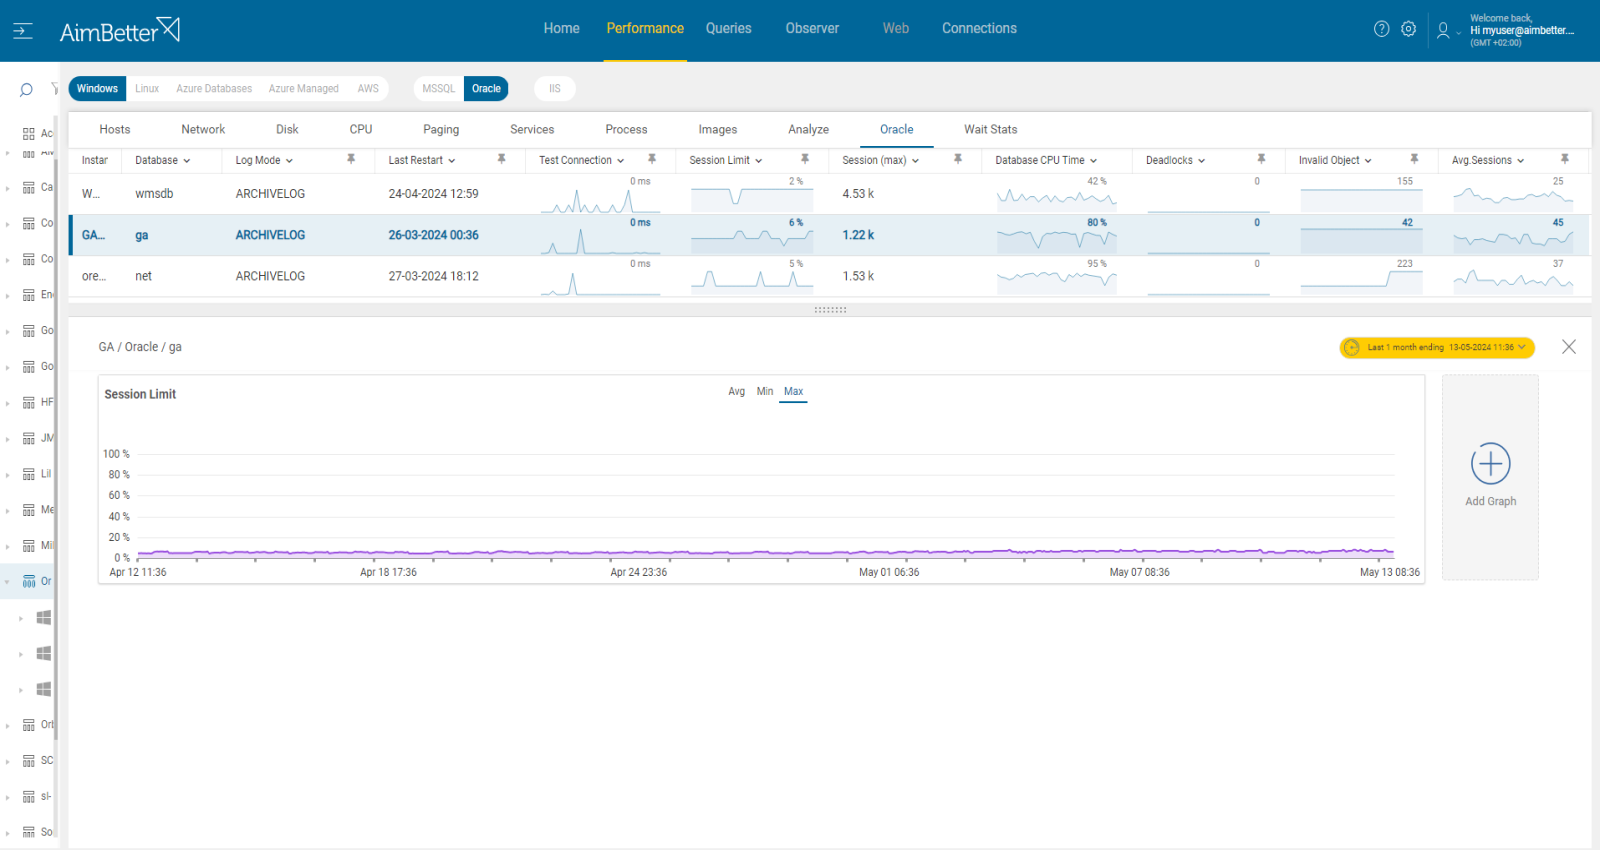
Oracle session limit refers to the maximum number of available connections allowed for a particular Oracle database instance. Each session in Oracle is a connection of a user process to the Oracle Database.
This limit helps manage resource utilization and prevent overload events by limiting the number of connections to the Oracle database. Once the limit is reached, a new connection to the Oracle Database cannot be made. This means that new processes or queries won’t be accepted. This setting should be configured by a DBA familiar with the business needs and the currently available resources. If the setting reaches the limit or is close to it – the DBA should consider changing one of the two – decreasing the number of connections at once caused by work split or increasing the session limit if the current resources can stand it.
Find out how you can save hours of work when investigating the root cause of this issue.
Symptoms:
Users complain about time-outs, new processes that can’t be done, or slow performance.
Impact: High
Slow application responses will harm user experience, negatively impacting the business flow.
Slow SQL responses will degrade the user experience, resulting in poor efficiency of your organization’s operations.
Expected behavior :
The session limit should not exceed 80% utilization. Once it reaches it or is close to it, performance will be degraded, and processes will be slow or waiting to be run.
Possible causes:
1- High user activity. Priority: High
On busy business days or peak hours, many users may access the database through applications at once. It might also happen routinely in cases of inefficient connection management, such as not properly closing connections after use.
This surge in the number of users accessing the database might fill the sessions and, therefore, bring them closer to the session limit.
Problem identification:
An increase in the number of users accessing the database, whether sudden or routine, causes higher resource consumption and slow performance.
Hands-on approach
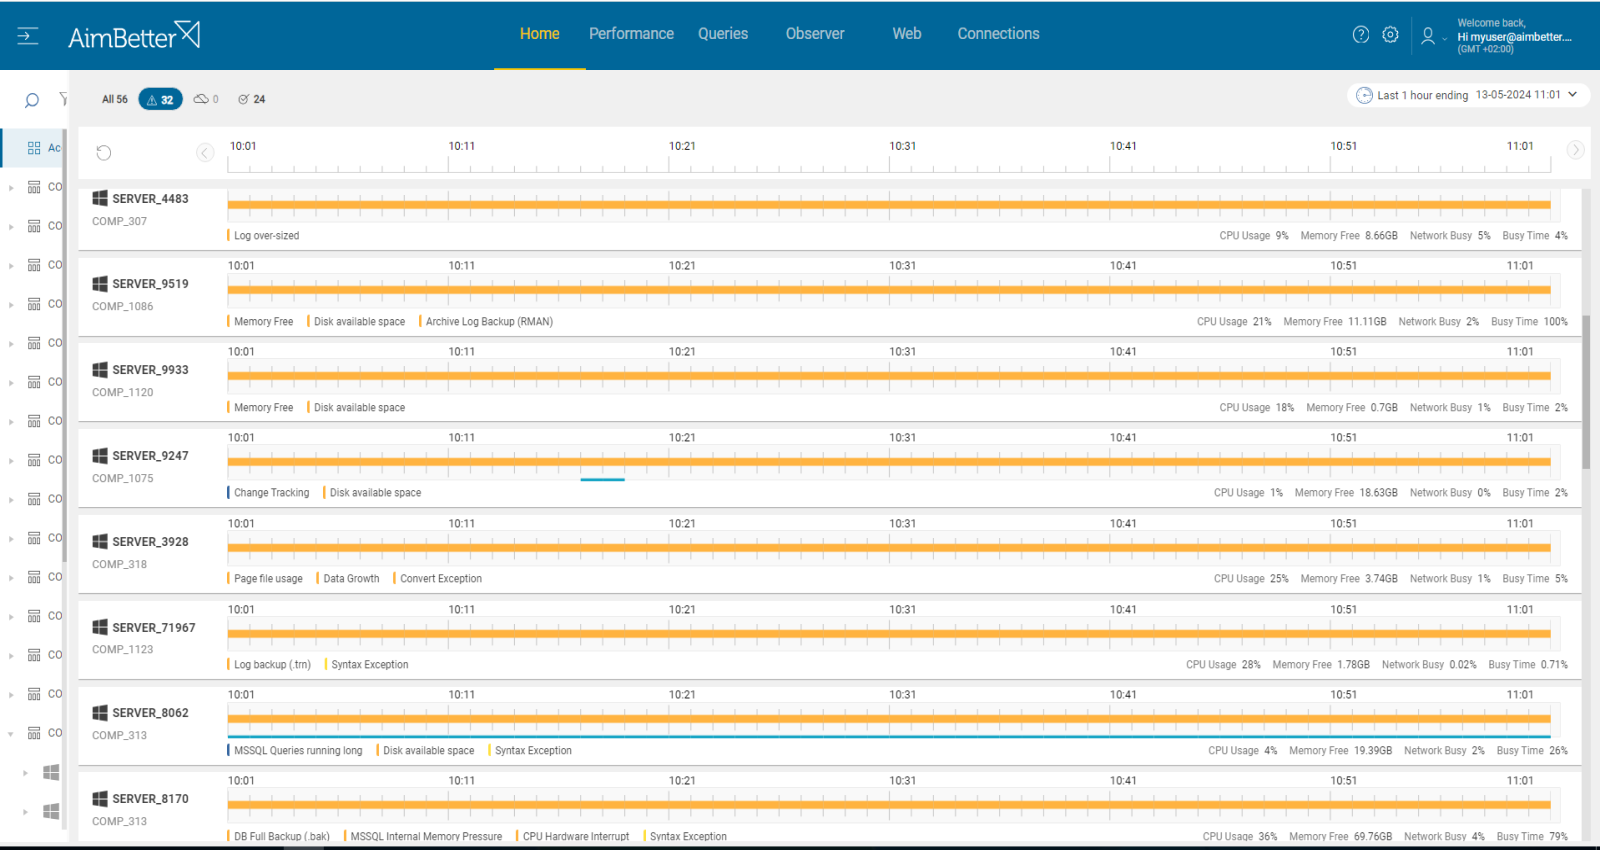
- Monitor system metrics such as CPU usage, memory usage, and disk I/O to identify spikes during peak usage hours. For Windows OS systems, you can do it with the Performance Monitor of Windows. For Linux systems, you can do it using the “htop” command available in the process viewer. Doing this manually might take time and won’t be accurate enough with limited and short-term data history.
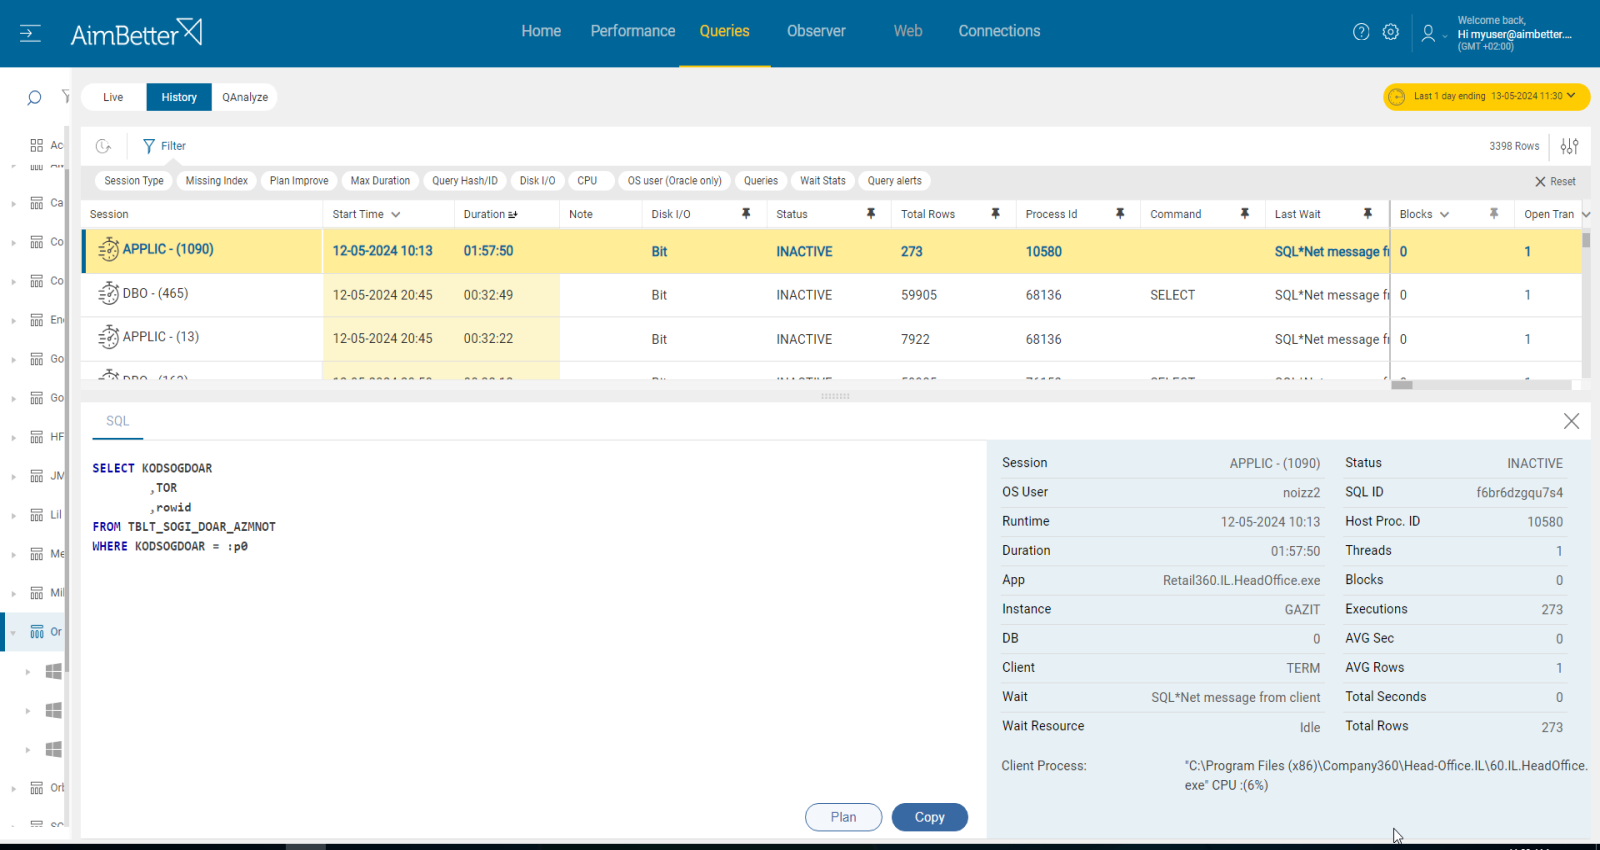
- Analyze database session data to identify any connections that are held open for longer than necessary. For that, you can use Oracle diagnostic tools such as AWR reports or V$ Views. This step should be done by a professional DBA. Using the results of the search, review the application code to ensure that database connections are properly closed after use.
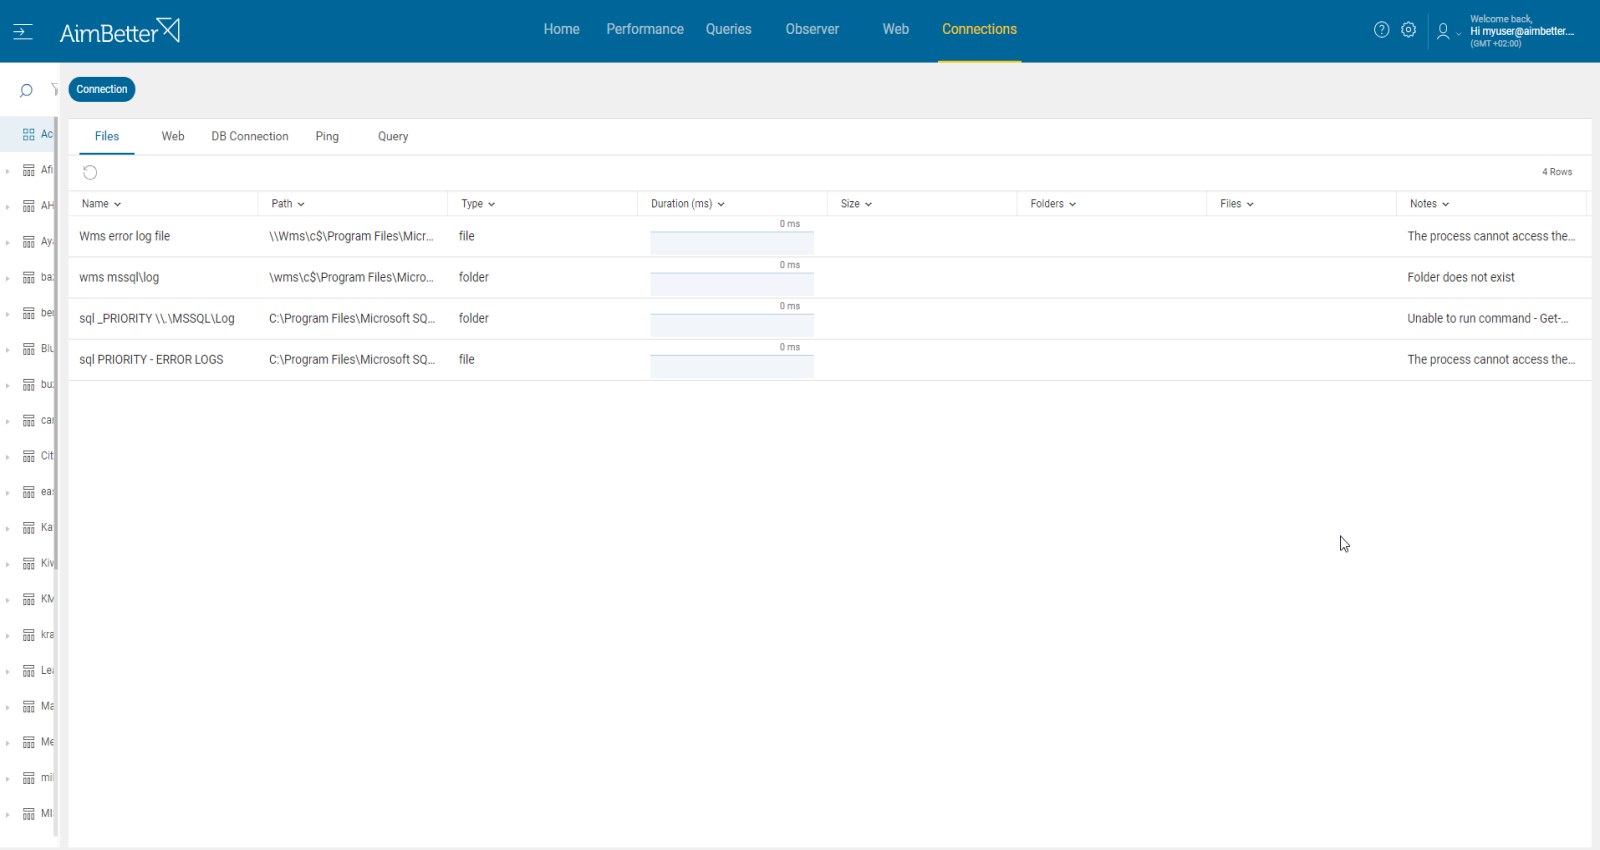
- Check application logs for any indications of increased user activity or concurrent connections. For that, you have to know where it’s located and how to search for it in the logs.
- You should track the active number of sessions over time. If you are familiar with Oracle diagnostic tools and reports, you can use them.
Recommended action :
Review the top long-running queries and tune their performance. Track this issue over time. It should be done with a DBA.
If possible, implement query timeouts to terminate idle connections and free up database resources automatically.
2- Queries are too complex. Priority: Medium
Transactions held open for extended periods of time or queries running too long might cause a major increase in users’ connection time. When queries run for too long, it might be due to several reasons: poor coding, missing indexes, unclosed connections, or maintenance tasks.
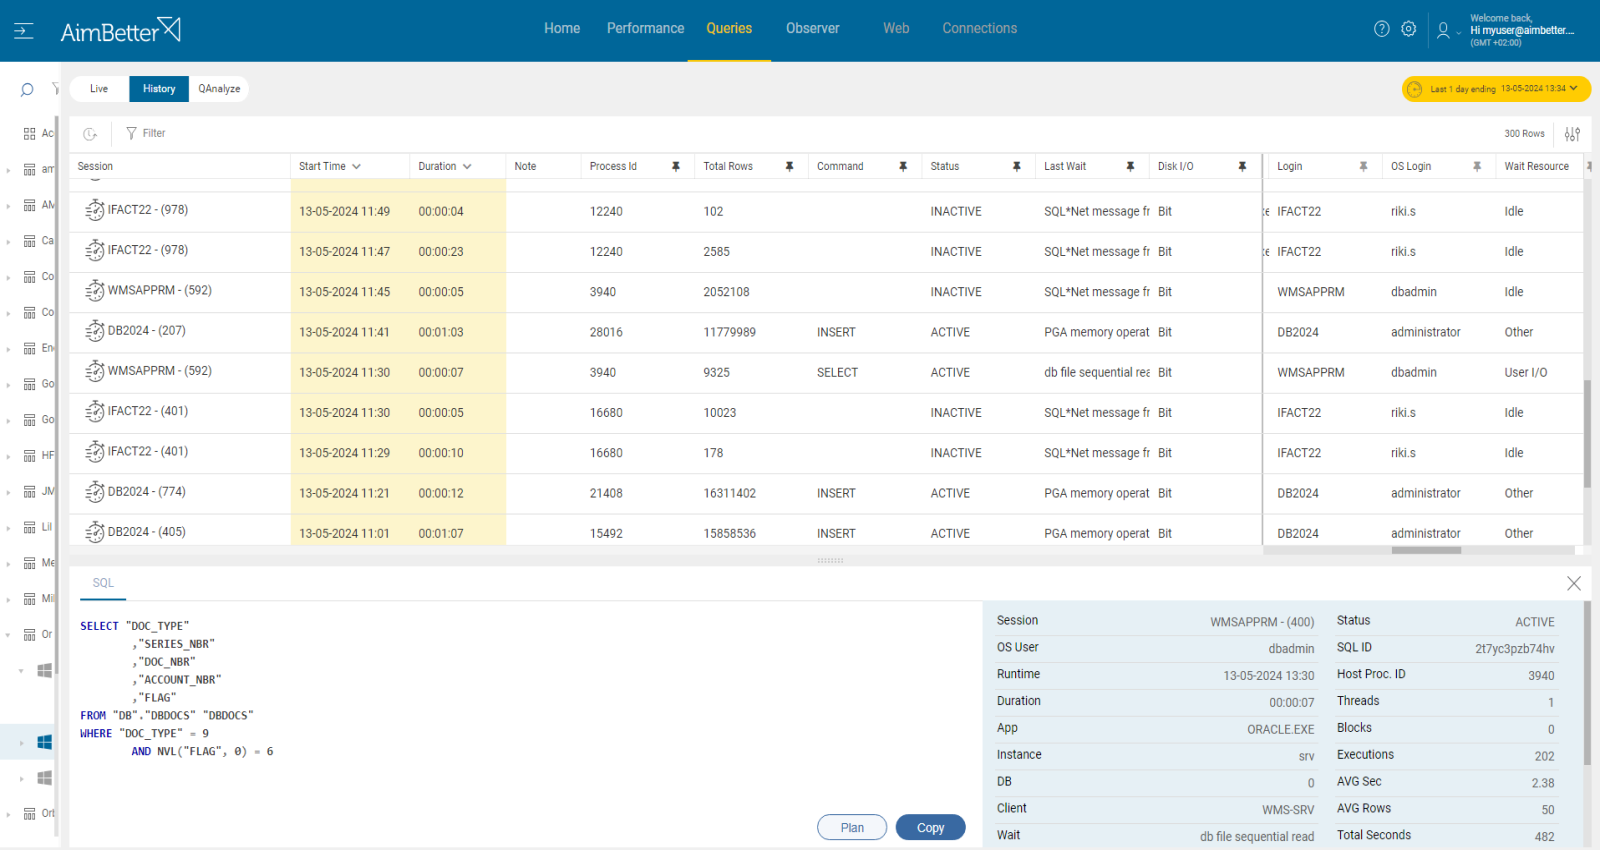
Identify queries that are running long or with open transactions and check if, in parallel, there is an increase in user connections.
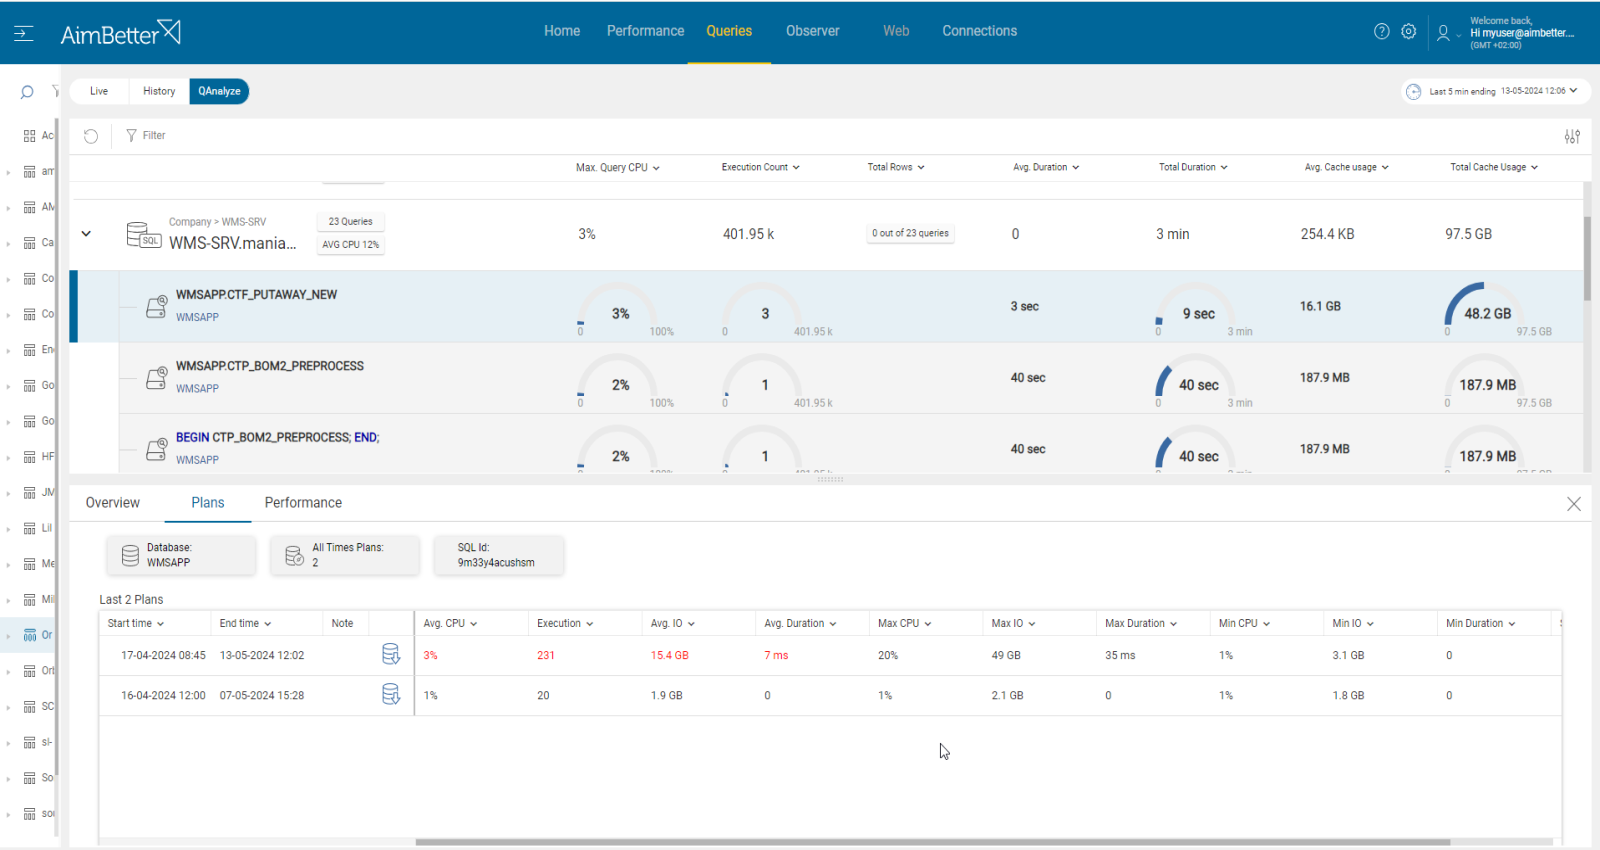
- Use Oracle’s Automatic Workload Repository (AWR) or SQL Tuning Advisor to identify and optimize poorly performing SQL queries. It might be complicated since you have to prioritize these events (by duration or resources) and make sure you have all the details needed.
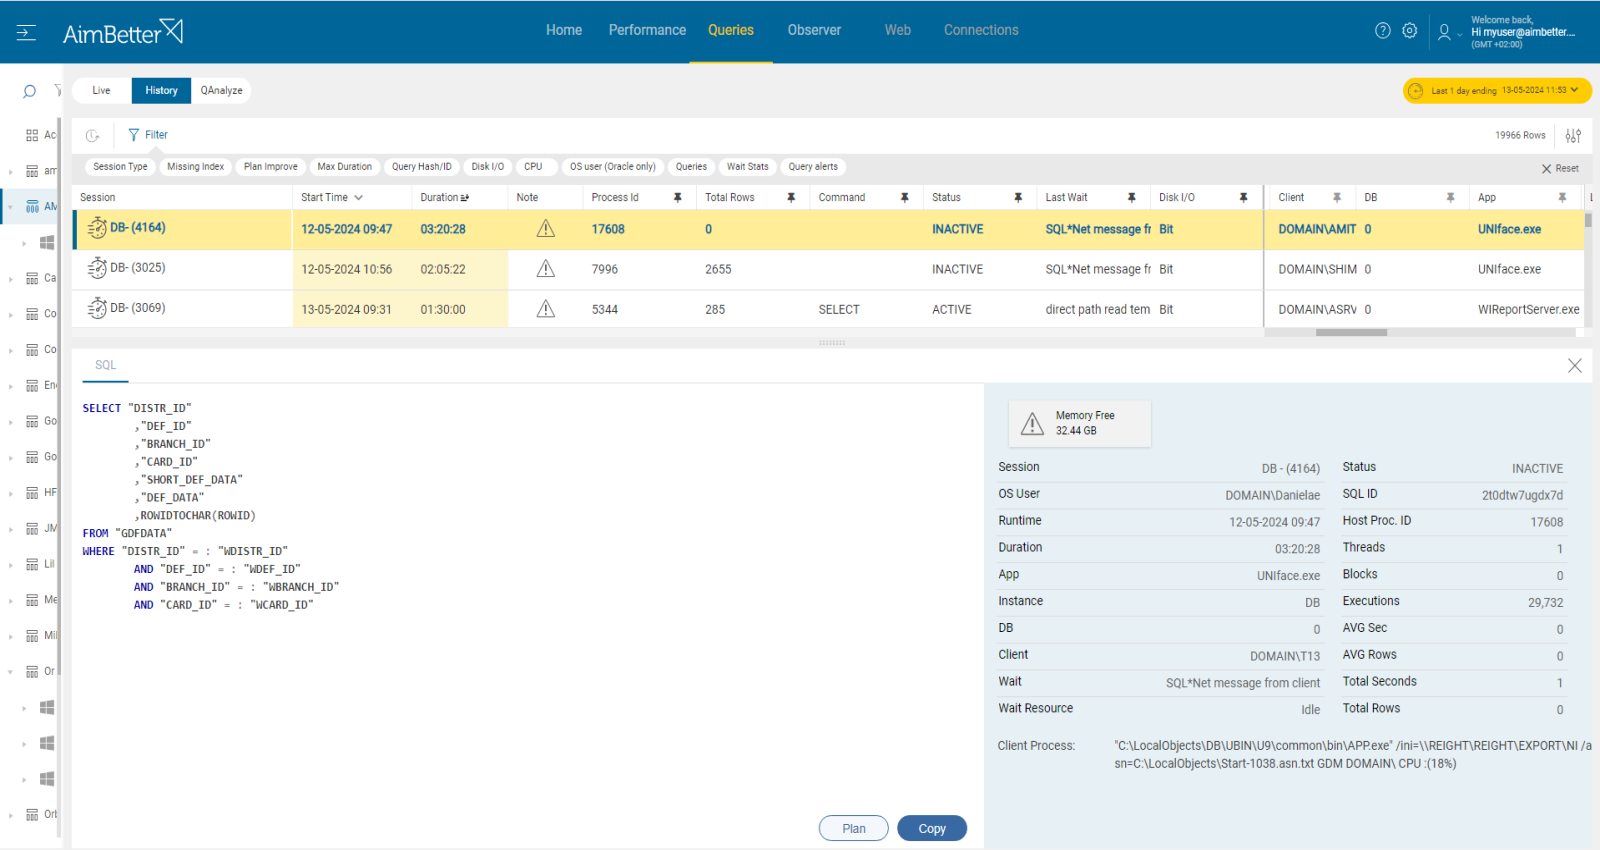
- Investigate the query code and execution plan, trying to look for missing indexes or excess subqueries. In order to get this data, you can rerun the query using the outcome queries of the Tuning Advisor. Otherwise, use the SQL ID to query the AWR views (such as DBA_HIST_SQL_PLAN) to obtain the historical execution plans for the query, for each query separately. Each of these might take time. You should know how to use a query execution plan and find problems in it in order to utilize it wisely for performance improvement.
- Depending on the situation, you might need to optimize the queries.
Recommended action :
Analyze and optimize frequently executed queries to reduce execution time and resource consumption.
Break complex queries into simpler steps to reduce their execution time and the likelihood of keeping transactions open for extended periods.
Avoid running maintenance tasks or jobs at main working hours if they can be postponed to other time periods.
3- Security Attacks. Priority: High
In rare cases, denial-of-service (DoS) attacks or malicious activities targeting the database can lead to a sudden spike in session usage. Therefore, the database might reach close to the session limit, which seems to happen “without reason.”
Before checking it, you must ensure that the cause is not non-optimal queries or higher user activity (see the previous cause analysis in this article).
Although this is a rare cause, you should keep in mind that it might happen and can mean a serious risk for your company.
Problem identification:
Look for unusual activity patterns along with a high number of sessions that do not seem to be caused by non-optimal queries or higher user activity.
- After identifying an abnormal number of active sessions, check it. Monitor the connection sources and try to identify unfamiliar connections. You can use auditing for connection-related events or the “V$SESSION” view to view active sessions. It should be done with a professional familiar with the routine flow.
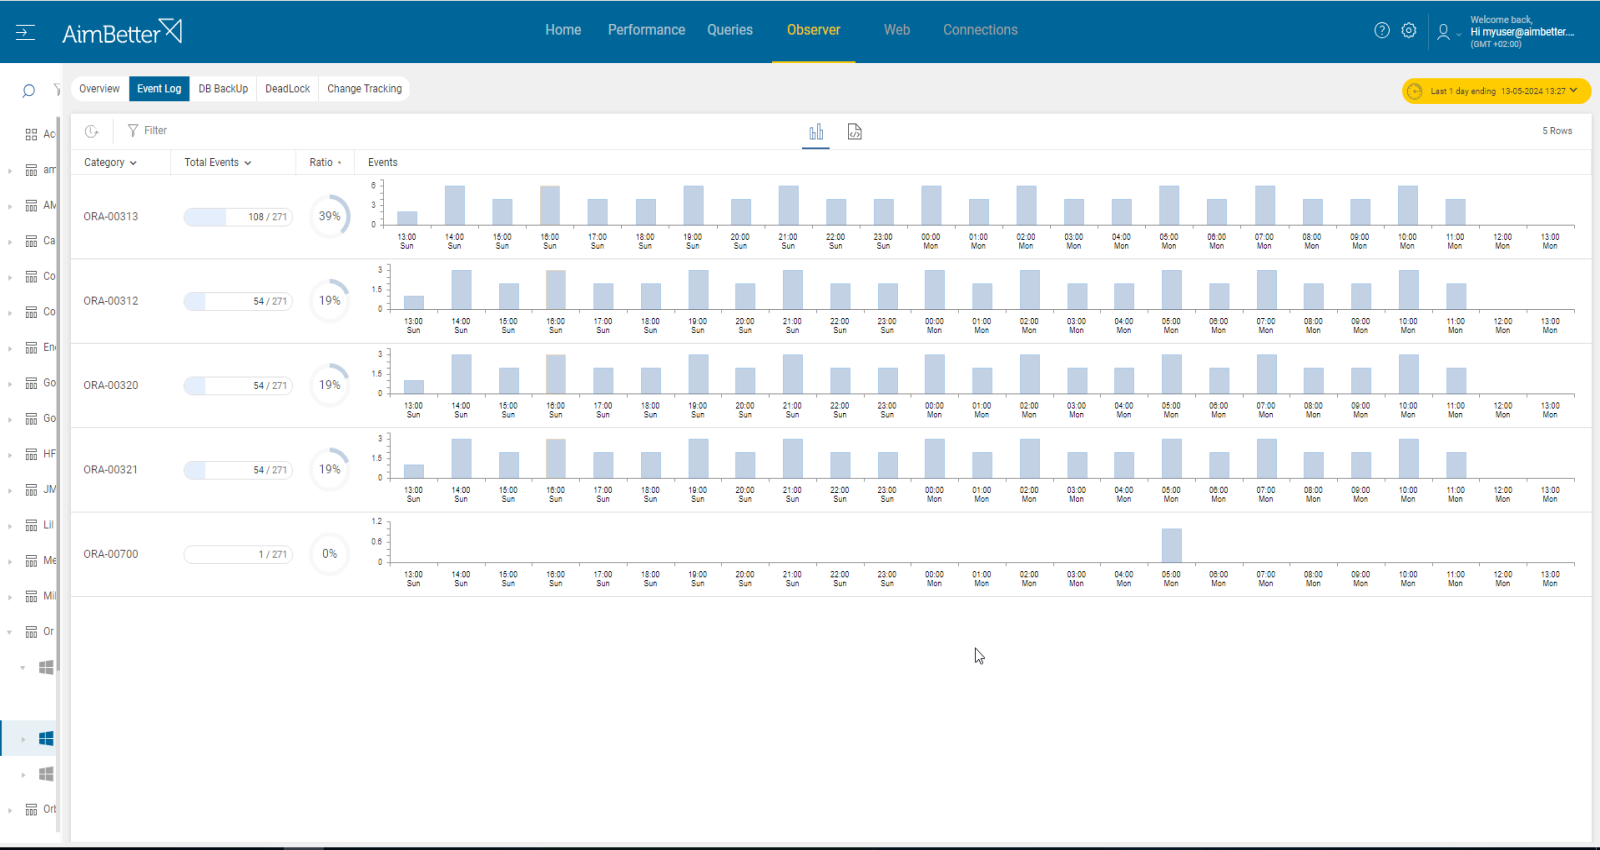
- Monitor network traffic and server logs for any signs of unusual activity or patterns indicative of a DoS attack. Review security event logs from the database, operating system, and network. Look for events of failed attempts, errors of authentication, or accessing failure.
- Regularly review audit logs for any suspicious activities or unauthorized access attempts.
- You should also check for encrypted files’ existence since attacks usually happen in several places in parallel.
Recommended action :
First, it is important to have immediate knowledge and recognition of the issue. Later, strengthen access controls—limit access to the database to authorized users and applications only. You should also configure firewall rules or network security groups. Make sure you have the most updated backups available for disaster recovery. Follow all these steps while consulting with a professional from the IT or System teams.


