An Oracle long-running query is one that takes a significant amount of time to execute, negatively impacting overall system performance.
Queries or updates that take longer than expected to execute can be caused by a variety of reasons. It may be related to performance problems related to the network or the computer where the Oracle Database is running or can also be caused by problems with the physical database design.
There are several common reasons for long-running queries and updates:
- Slow network communication
- Insufficient memory in the Oracle Database host or not enough memory available for the Oracle Server
- Lack of useful statistics, data striping, or useful partitioning
- Lack of useful indexes
- Lack of useful indexed view
Find out how you can save hours of work when investigating the root cause of this issue.
Symptoms :
Queries are running longer than expected.
Impact: High
Slow Oracle responses will degrade the user experience, resulting in poor efficiency in your organization’s operations. In addition, they might cause queries to be blocked or not completed due to timeout.
Expected behavior :
There are no standard metrics for the length of Oracle Query execution. To establish the best benchmarks, queries should take about the same time to complete when testing and when running in production (assuming the same volume of data is processed).
In addition, it depends on business flow needs and if regular execution time can be improved or not, depending on the specific code and transactions at the same query.
Possible causes of long-running queries:
1- Queries are waiting for data that depends on locked resources. Priority: High
When multiple transactions are contending for resources, blocking situations can occur, causing delays in query execution.
Blocking happens when another transaction has locked the table source and prevented this transaction from being committed since the table is already in use.
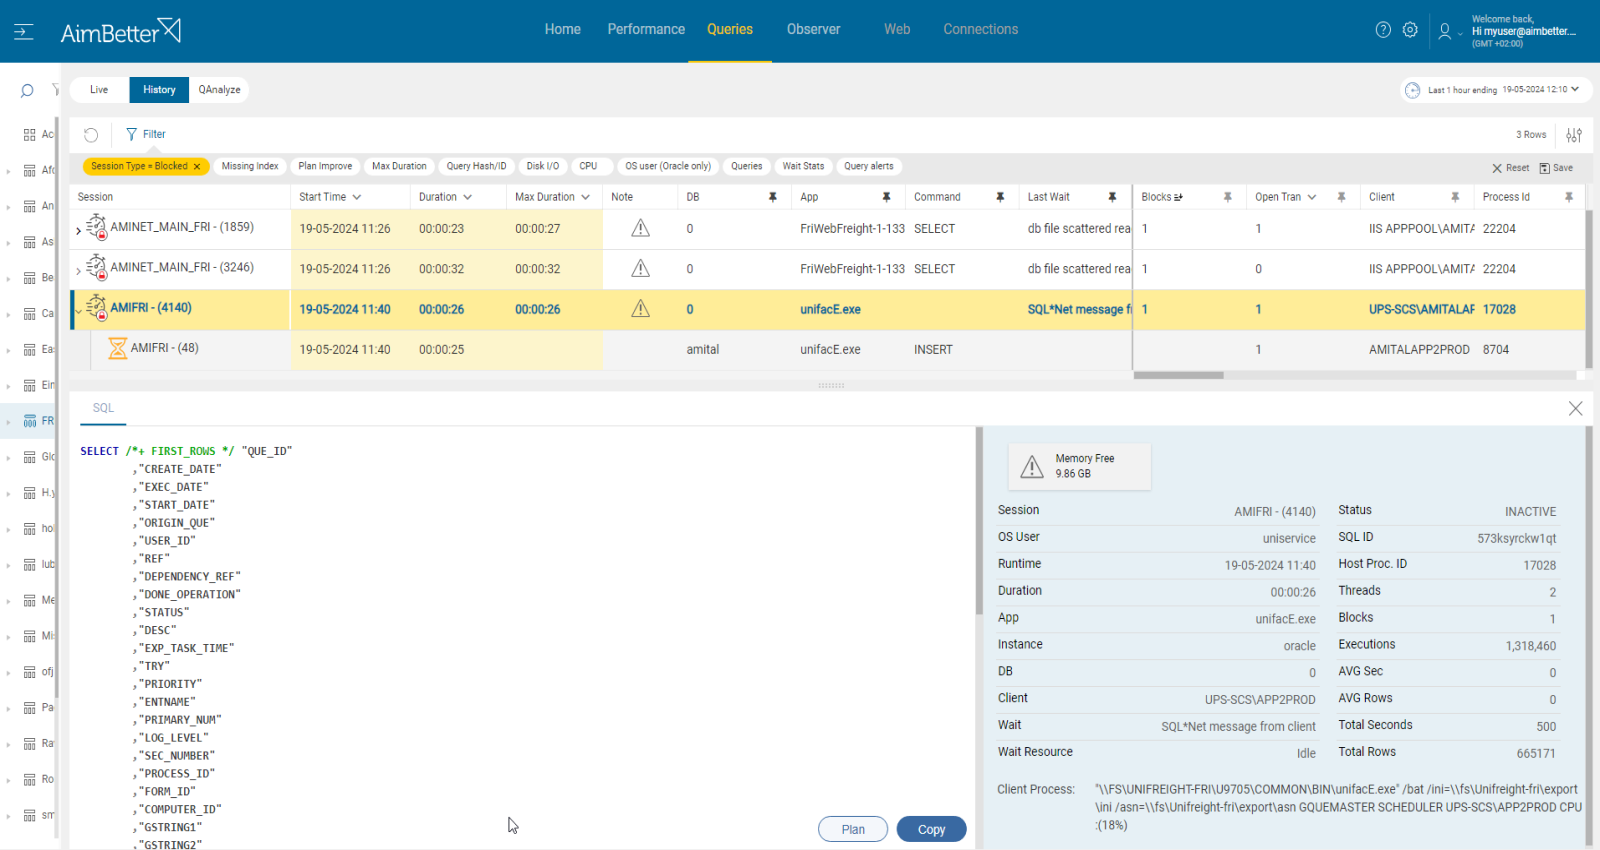
Problem identification:
You should identify the blocking queries currently and check if their resource is the same as the query that is running long.
- Use tracking tools, such as AWR(Automatic Workload Repository) or SQL Trace, to identify blocking queries currently. This task might be complicated since you have to make sure that the table in these queries is the same as the query that is running long. You should search for data related to session ID, duration, wait type, and the code of the affected queries.
- By comparing the blocking query to the affected queries, you can determine if the blocking query is causing delays or long execution times for the affected queries. Make sure which of the affected queries you want to check by checking the application, execution start time, login, and more.
- Take into account that multiple layers of blocking or complex dependencies can exist. Therefore, you might aim for a wider insight by analyzing the transaction isolation levels, settings, and overall database workload.
Recommended action :
To resolve blocking, you may need to adjust the query design and execution plan, optimize indexing, tune queries, ensure that transactions are committed, and change settings if required. Reprioritize processes according to needs.
2- Overloaded or wrongly set hardware resources Priority: High
Overloaded server resources such as CPU, memory, disk I/O, or network can slow down query execution. It might happen due to a specific application or many processes running simultaneously. These processes might be external operations such as anti-virus scans, backups, and restores from networked data stores.
Other cases might be that the resource settings do not fit the requirements of the instance operation—for example, there are not enough cores or disks are set improperly.
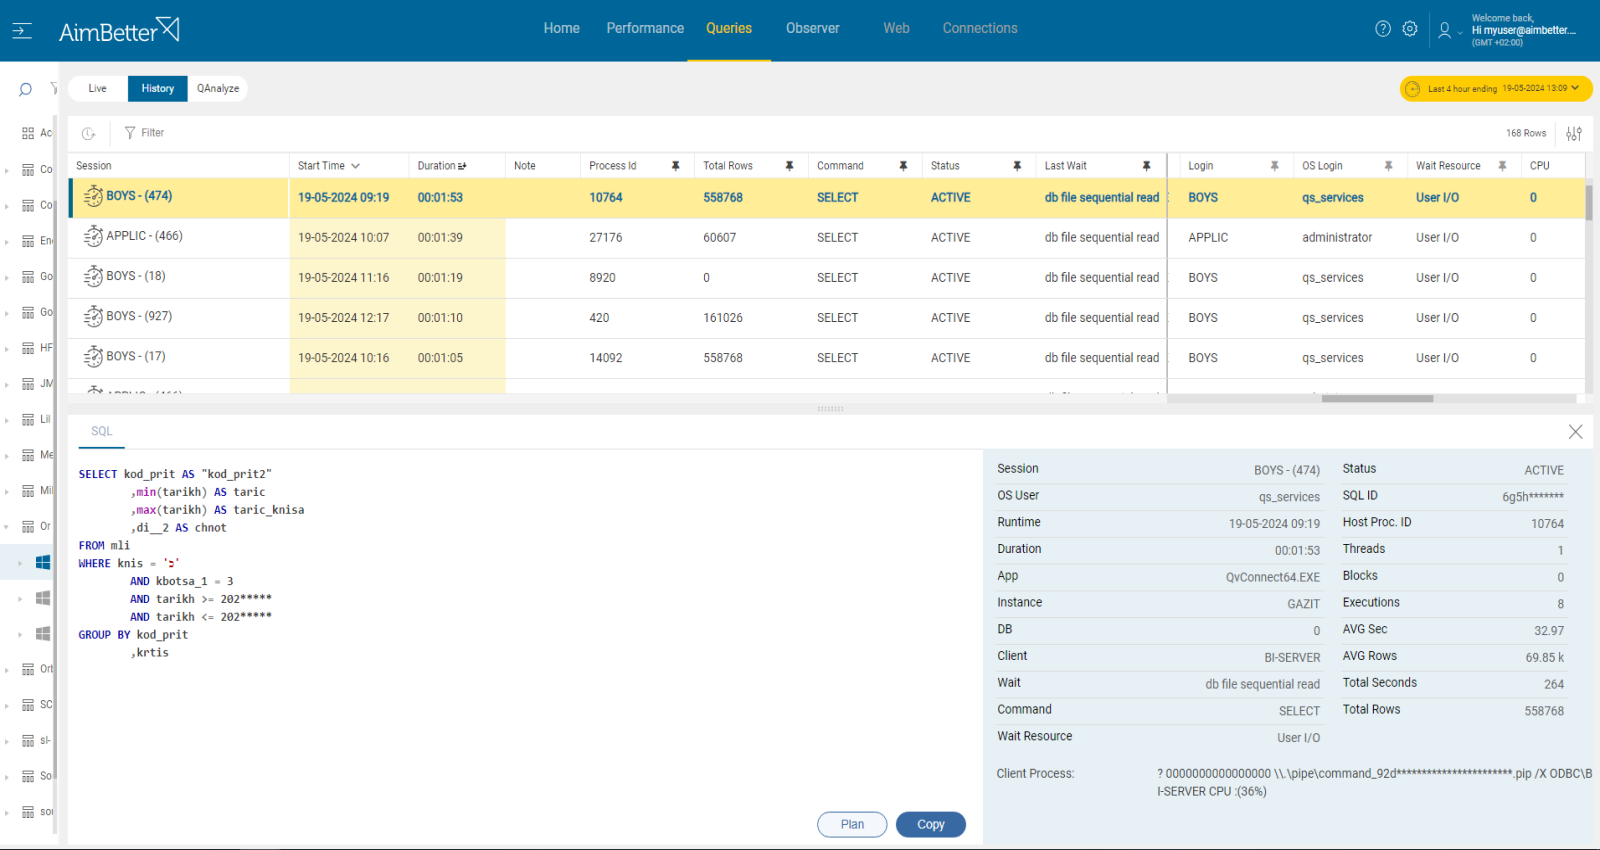
Problem identification:
Check if CPU, memory, disk I/O, or network resources are highly utilized. Identify the source of the load and if it is recurrent. Try to reschedule heavy tasks to a time of low user demand.
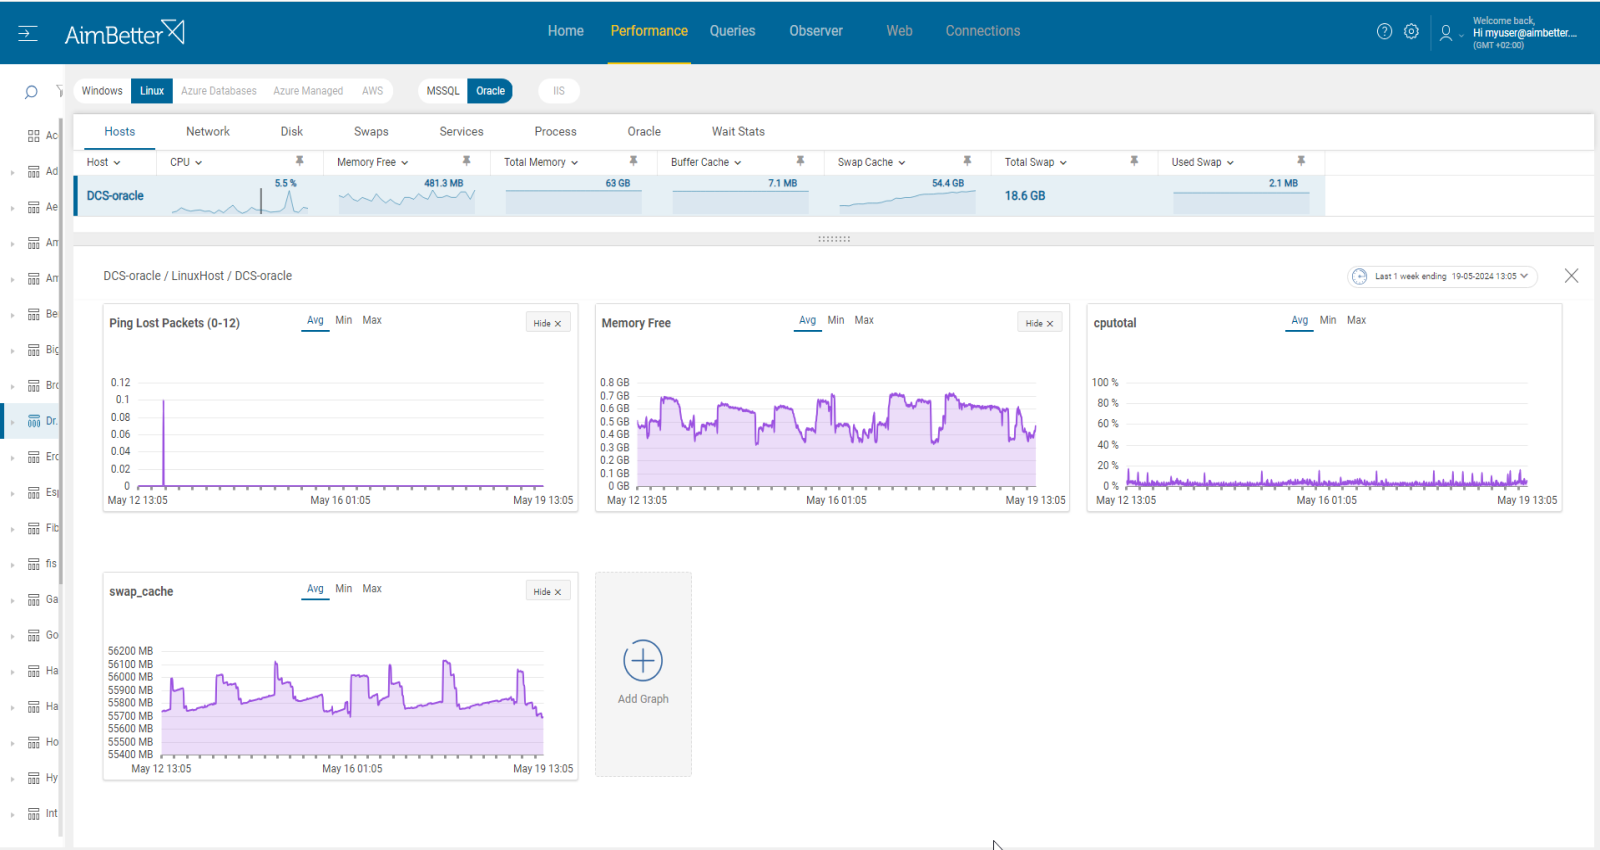
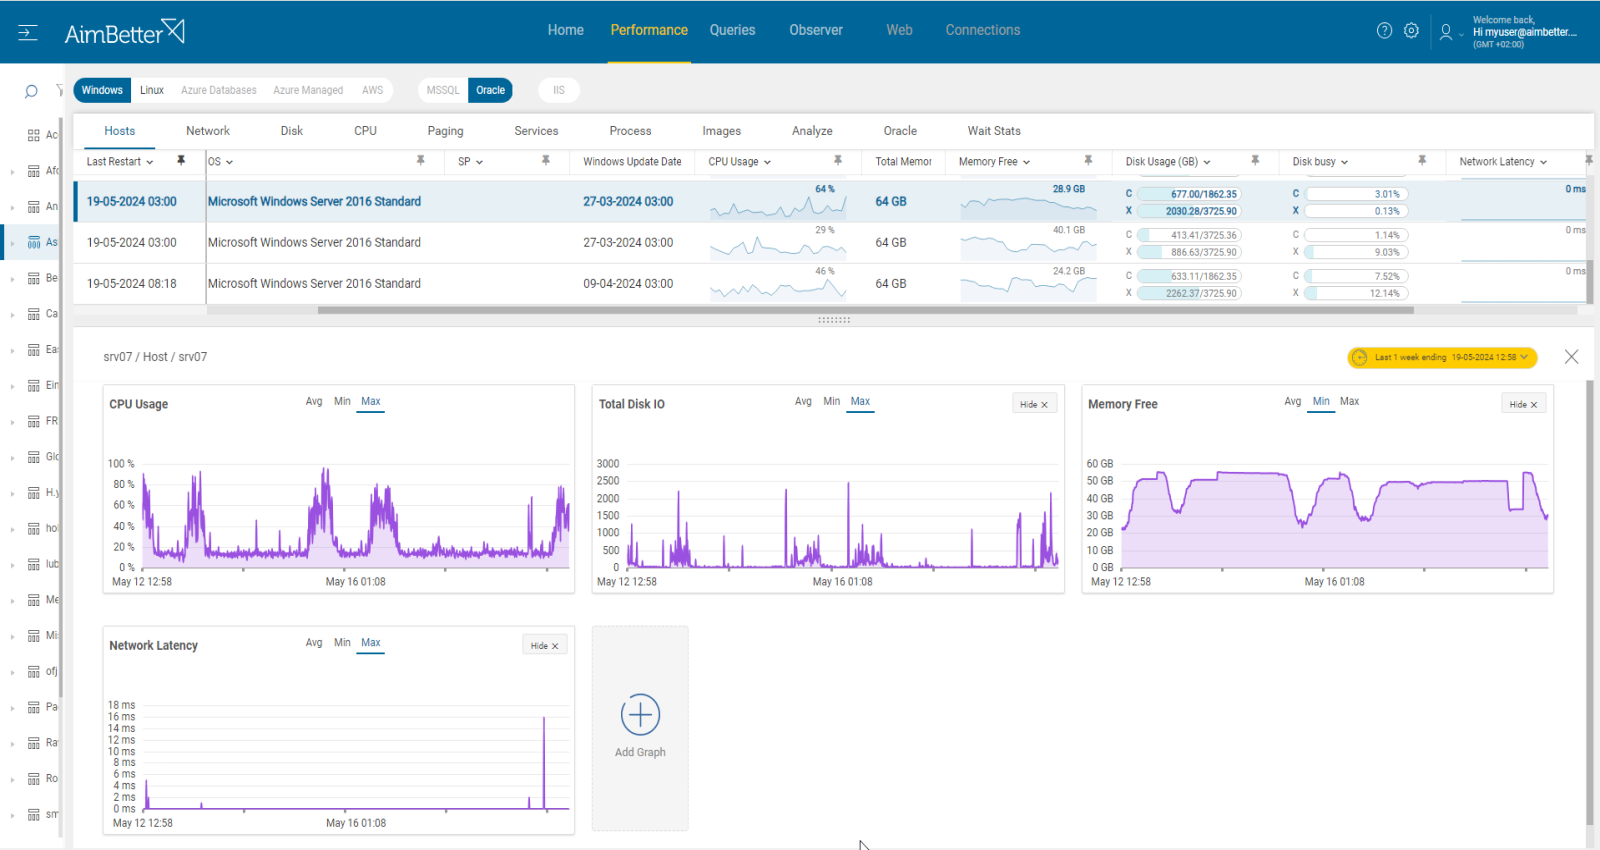
- First, you have to identify the overload. For Windows OS, you can check the Task Manager to identify an overload of hardware resources. For Linux, you can check with the commands “top” for CPU, “free” for Memory, “iostat” for Disk I/O, “vmstat” for Virtual Memory statistics, and “nload” Network.
- Use OS tracking tools such as Performance Monitor of Windows OS to identify which processes use hardware resources. For network activity, use a network monitoring tool to check how much traffic flows through your network and which applications or devices use the most bandwidth. Take into account that most tools help pinpoint when a problem starts, with which you can’t compare to old time frames.
- Check whether the long-running query wait time is for a specific hardware resource and which hardware resource is more utilized than others while the query is running. For that, you should use tracing tools such as SQL Trace or AWR reports. This step might be completed and take time; the result probably won’t be precise while checking only online statuses.
Recommended action :
Cancel unnecessary programs that cause high hardware utilization. When possible, reschedule non-essential activity (e.g., virus scans, backup, etc.) to hours of lowest SQL demand.
Consider upgrading hardware if possible.
3- Inefficient query design or indexing Priority: Medium
Queries not properly optimized with inefficient query execution plans can lead to poor performance, inefficient data access, and increased resource usage. This can include missing or outdated statistics, inappropriate use of joins or subqueries, unnecessary sorting or grouping, or inefficient use of functions
Execution plans provide valuable insights into how the queries are being processed and help to identify areas where inefficiencies exist.
Problem identification:
Identify which queries are running long and whether resource usage has increased. Check the indexing and query execution plan.
- Track the database server activity: Identify which statements have a high execution time and consume the most resources. For Oracle, you can use the built-in AWR together with SQL Trace, which can include data from top SQL statements, execution plans, wait events, and resource consumption. This mission requires a skilled DBA.
- Identify whether the query is a stored procedure or a job that is running for a specific time schedule, or a single user that is running it from a specific application.
- Investigate the query code and execution plan, looking for missing indexes or excess subqueries. To get this data, you can use Oracle tools like EXPLAIN PLAN for execution plan data or SQL Access Advisor and DBA_ADVISOR for missing index recommendations.
- Examine index usage and fragmentation: Evaluate the usage and fragmentation of indexes in the database. Unused or fragmented indexes can impact query performance.
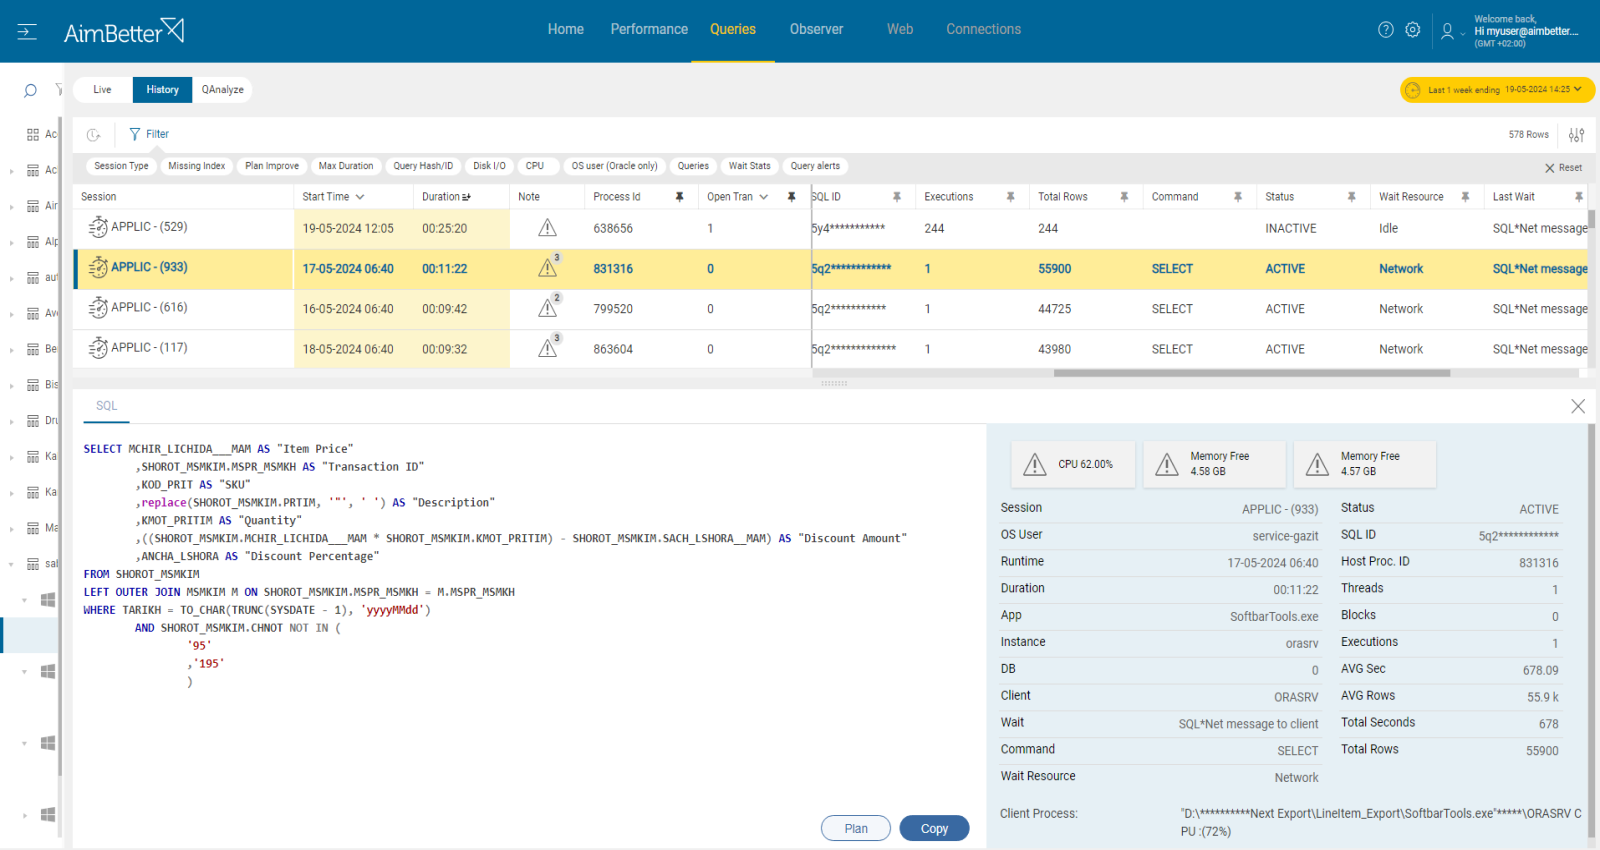
All running queries can be viewed from a single screen.
You can filter and sort the queries by execution time or resource utilization or even search for a specific query text.
The query execution plan and missing indexes are available immediately, even when the queries run live, including notes showing improvement recommendations.
Recommended action :
Check the bottlenecks of the long-running queries and optimize accordingly. Before making these changes, consult with a DBA who understands the data model.
Investigate the query’s execution plan and look for heavy tasks and loads of data.
Make sure you are using proper indexes, add or delete indexes if possible and needed.
Break complex queries into more simple steps, and make sure to use proper filtering, WHERE clauses, and JOIN operations.
4- Inefficient server and database design Priority: Medium
You should follow this step after checking the query’s design and server resources.
Inadequate database design, either by not properly normalizing or denormalizing the database schema, can result in inefficient queries. In addition, you have to ensure that the instance’s current design fits the business flow and application requirements.
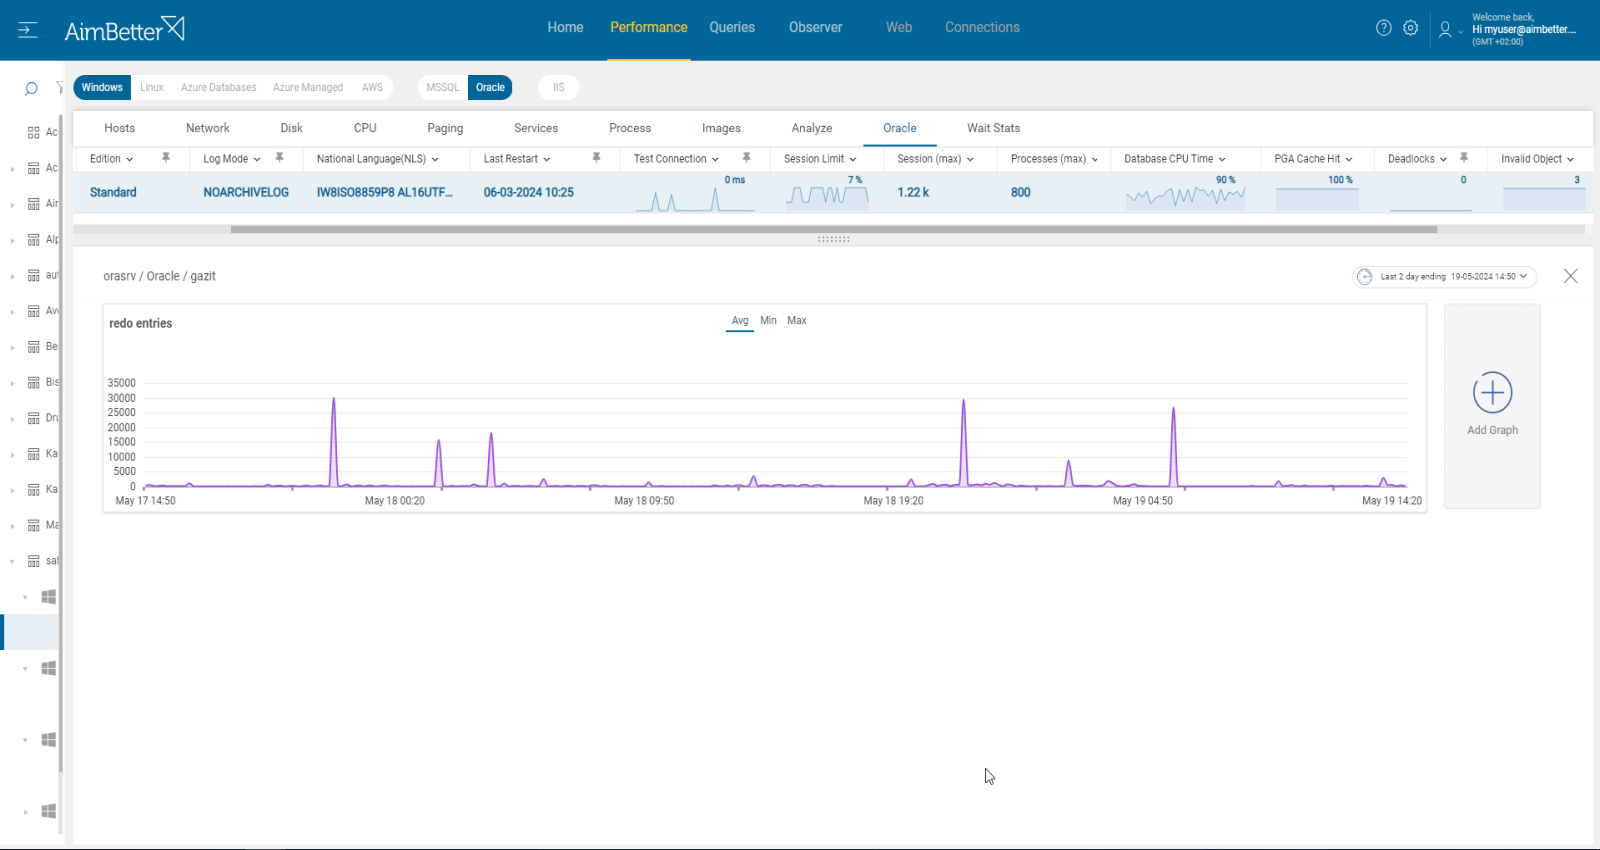
Problem identification:
Analyze the query’s performance, looking for queries that consistently take longer to execute and identifying which instance and databases they originate from. Once you are sure the reason is not an inefficient query execution plan or lack of sufficient resources, you should check instance and database settings.
- Identify which Oracle statements are having high execution time , for that, you can use the built-in AWR together with SQL Trace. Identify the database and instance from which the query is running.
- Check the database settings, such as data file settings, backup type, tablespaces, redo and undo configurations, and more. This must be done with a professional DBA who knows the structure of the instance.
- Check the instance settings, such as SGA, PGA, and memory settings. Remember to evaluate statistics and daily tasks to improve the databases’ functionality. As for server settings, make sure that the infrastructure fits the best mode of working.
Recommended action :
If needed, change the settings of the database, instance, or host. You should work with a professional and track these changes with proper monitoring tools.
Ensure that the server is appropriately sized and configured based on the workload demands.


