This alert means that network traffic is taking longer times to complete. The alert displays when the average network latency exceeds the threshold you have set. Network latency depends on the speed of the transmission and is affected by the delays in the transmission by devices along the way (e.g., routers and modems). Low latency indicates high network efficiency. Network latency has a strong correlation with network jitter. If traffic has to move over a shared network using remote storage, it could cause substantial increases in traffic, resulting in network latency, causing jitter.
In the case of data storage on networked devices, it is necessary to take the following into account: SQL Server typically has a high demand for disk I/O activity. If insufficient data resides in a buffer pool cache to satisfy queries, the system has to pull data from the disk. Further, since the data in databases is constantly changing, these updates need to be written to disk. Another process that can consume a lot of I/O is the TempDB database which is a temporary working area for SQL Server to organize data drawn from tables. This database also resides on disk and could be changing and growing. If this traffic has to move over a shared network using remote storage, it could cause substantial increases in traffic, resulting in network latency which could lead to jitter.
Find out how you can save hours of work when investigating the root cause of this issue.
Symptoms:
Network traffic slowing – user responses are slow and some data may be lost.
Impact: Medium
Slow SQL responses will degrade the user experience, resulting in poor efficiency of your organization’s operations. Specifically, network latency can also lead to data loss and corruption as well as network jitter.
Expected behavior :
There is no standard metric for network latency. Many aspects of the environment will affect network latency.
Reliable connections consistently report back the same network latency over and over again. Using AimBetter’s algorithm, the alert displays when the average network latency deviates more than the threshold level permitted.
Possible causes of network latency
1- High network traffic – system Priority: Medium
Unusual levels of network load may be coming from external operations moving data around the network (backups, restores, etc from networked data stores)
Problem identification
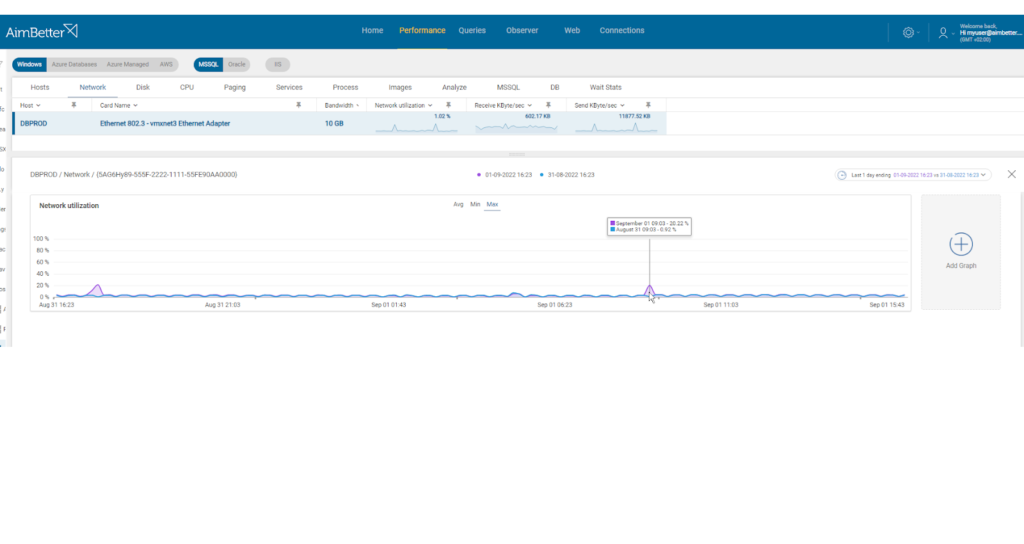
You should use a network traffic monitoring tool to track the amount of traffic on your network. This tool will allow you to track abnormal network traffic and identify its source.
In order to identify high network traffic caused by external operations, you can take the following steps:
- Using a network monitoring tool, you should check how much traffic flows through your network and which applications or devices use the most bandwidth. Take into account that most monitoring tools help pinpoint when a problem starts, with which you can’t compare time frames.
- Review your network logs to see if there are any unusual patterns or events that correspond to the spike in network traffic. This task might take hours of work.
- Once identify the source of the high traffic, you should contact the external resource organization. See if they can lower the traffic amount.
Recommended action :
Identify the source of the load (using built-in OS tools such as PerfMon), and if it is recurrent, try to reschedule to a time of low user demand. Where possible, concentrate non-SQL Server related activities onto a separate network. Also, schedule high-volume activities to time frames of lowest user demand.
2- SQL queries with high disk I/O requiring data traffic to storage Priority: Medium
This problem is specifically relevant to environments with networked storage.
Problem identification
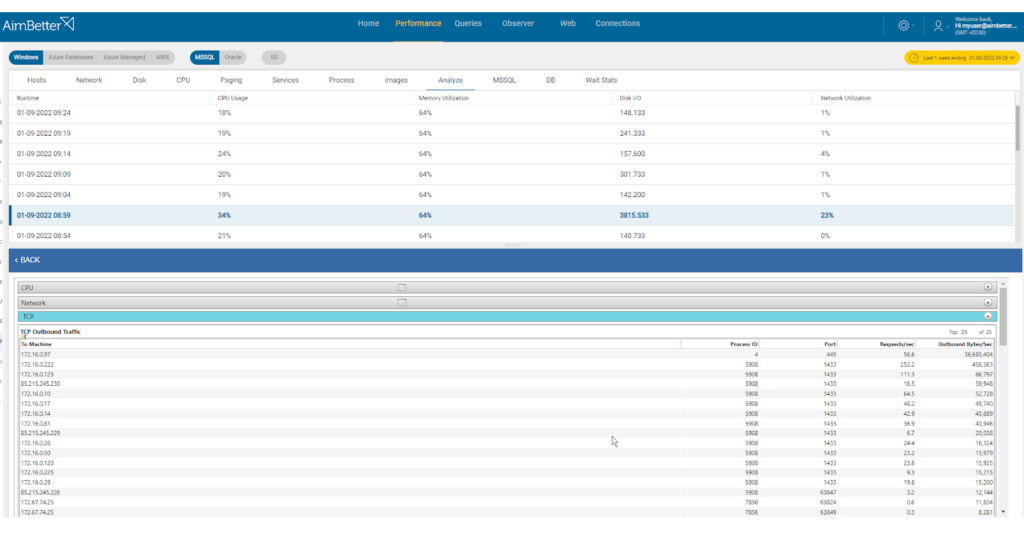
Look for the queries which require data traffic to storage and consume high disk I/O while comparing it to network utilization.
- Identify the SQL Queries which consume high disk I/O by using profiling tools. For SQL Server, you need to enter the SQL Server Management Studio and activate a trace. For Oracle, use Oracle’s Automatic Workload Repository (AWR). This step may be complicated and take hours (or days) of work, and you can’t guarantee precise results when checking online statuses with no historical events.
- Look for queries that perform large table scans or joins or those that use a large amount of temporary storage.
- Use network monitoring tools to analyze the data traffic to storage while these queries are executed.
- Look for a way to optimize the queries performance. This might involve adding missing indexes or changing queries execution plans. This mission might be complicated, requiring a highly skilled DBA that can view a complete SQL query plan that might be long and complicated.
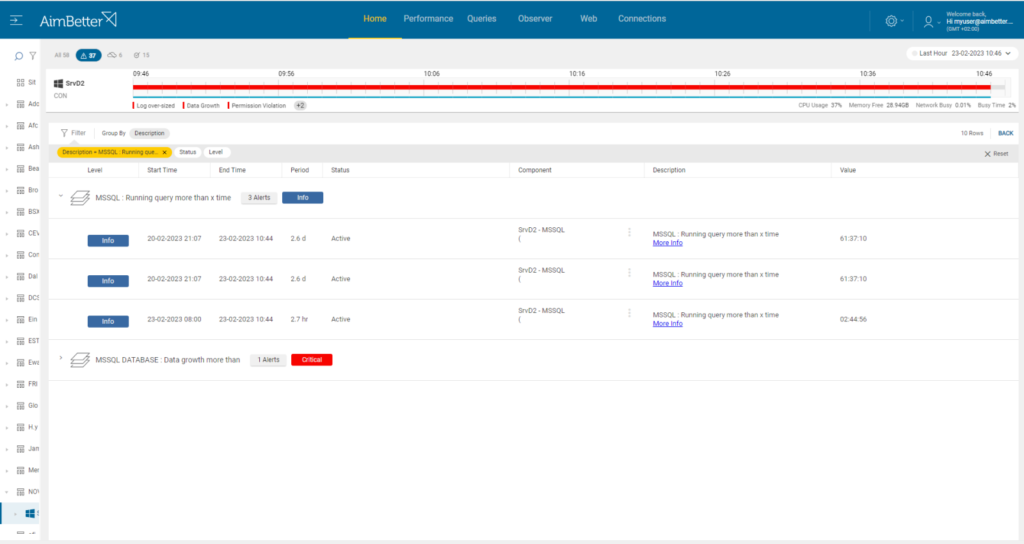
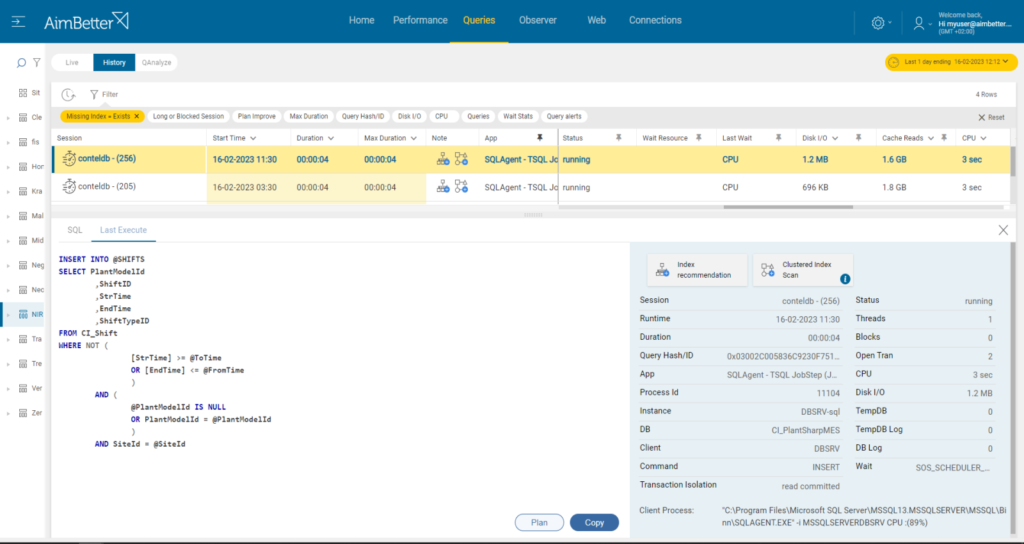
You’ll be immediately notified if there are long-running queries by our solution!
Along with the network utilization alert, you are able to see queries on a selected time frame easily when using our dashboard.
Simply check our recommendation for missing indexes or plan improvements and save hours of work looking for the source cause of this issue.
Recommended action :
Log storage disks should be physically linked to the server or over a separate network if possible. To minimize traffic otherwise, see our recommendations regarding page file optimization here.
3- Network errors or inefficient network structure Priority: Medium
Faulty or inadequate hardware components, such as routers, controllers, etc., with low bandwidth capabilities, can significantly slow down traffic.
Problem identification
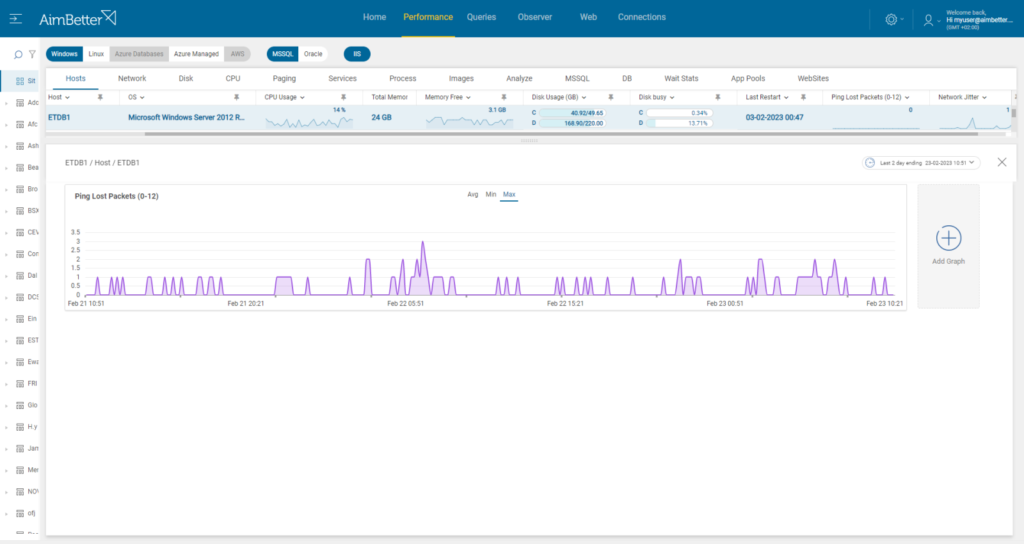
Use a network performance monitoring tool to measure network latency, throughput, and packet loss and check for errors and hardware.
- Identify where and when the network performance is poor while using a network monitoring tool. In addition, look for times when there’s network packet loss. This task might be hard to follow.
- Check for errors. This might take time.
- Analyze network abnormalities, and check for network hardware and settings. Ensure that your network devices are configured for optimal performance and correct function.
Recommended action :
Investigate all hardware components with your Network Management team.
See our recommendations regarding network levels here.


