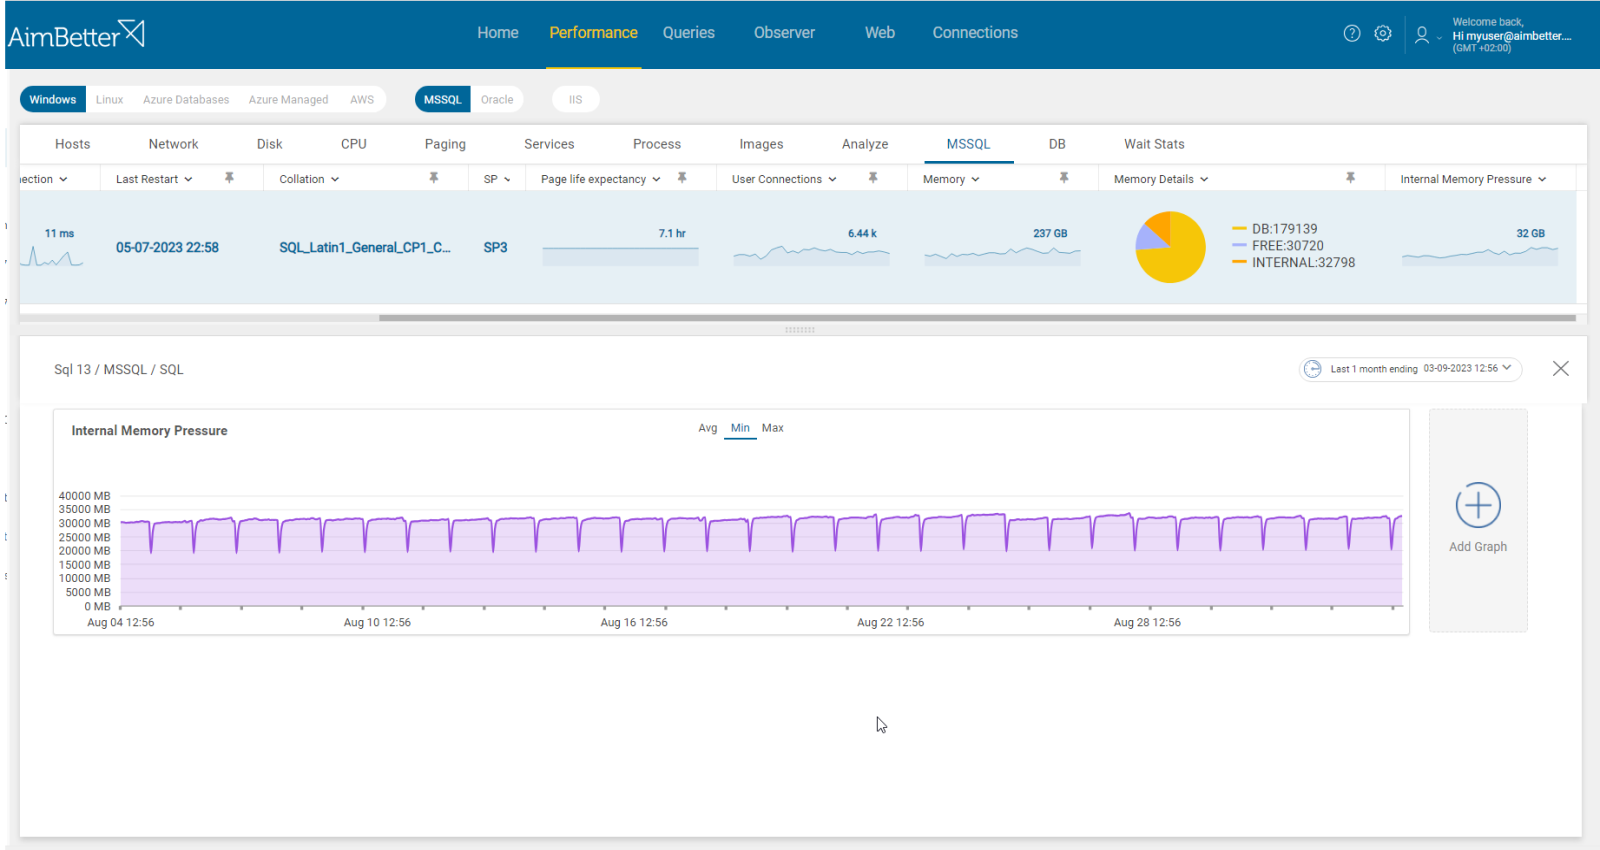
SQL Internal memory pressure is an SQL Memory metric that measures memory used by the SQL Server itself.
Extensive I/Os are pulled in from the disk by running SQL queries, and SQL Server has to load that into the buffer cache so the request will be processed. When too many of these queries are sent to SQL Server, it has to start removing data from the cache to make room for newer data. The Page life expectancy performance counter indicates that pages must be flushed out to free space for the new ones coming in. This is a crucial indicator of memory pressure.
Internal memory also reflects hardware configuration for SQL Server, CPU, and I/O. Memory pressure may indicate a vast range of different (and combined) problems, such as:
- missing indexes
- badly designed tables
- an actual shortage of memory on the server for the designated workload
- other applications running on the system
- unexpected numbers of users logging onto the server
- and more.
At the same time, an SQL Server that has been running smoothly on an over-allocation of memory may have been hiding some of these and other issues, so changes in load alone may be the trigger and should be an important factor to rule out before undertaking further investment on additional RAM.
Find out how you can save hours of work when investigating the root cause of this issue.
Symptoms :
Resources consumption is higher, and queries are running longer.
Impact: Medium
Memory is one of the most critical resources concerning SQL Server performance. This metric represents the degree to which the SQL server is short of memory and unable to perform optimally.
Therefore, it is an indication of degradation in server performance. Users might experience slowness when doing regular operations.
Usually, this issue doesn’t stand by itself.
Expected behavior :
There is no standard metric for memory pressure. You should set your thresholds relative to the actual allocated memory for SQL after reviewing past behavior.
Once the internal memory consumes more than 20% of the max SQL memory, its effect on performance should be checked. If it affects the server’s performance, this problem should be addressed accordingly. You should check for extra I/Os utilization, higher compiler ratio, longer queries (with waits), higher CPU activity, and more.
Possible causes:
1- Inefficient Queries, including full-text search and large data sets. Priority: High
Searching for specific strings within large text fields stored in the database might cause extensive I/Os, which affects memory pressure as well. This kind of query usually also has an extensive results set. While executing the queries, intermediate data has to be stored during processing, and this is usually stored in memory.
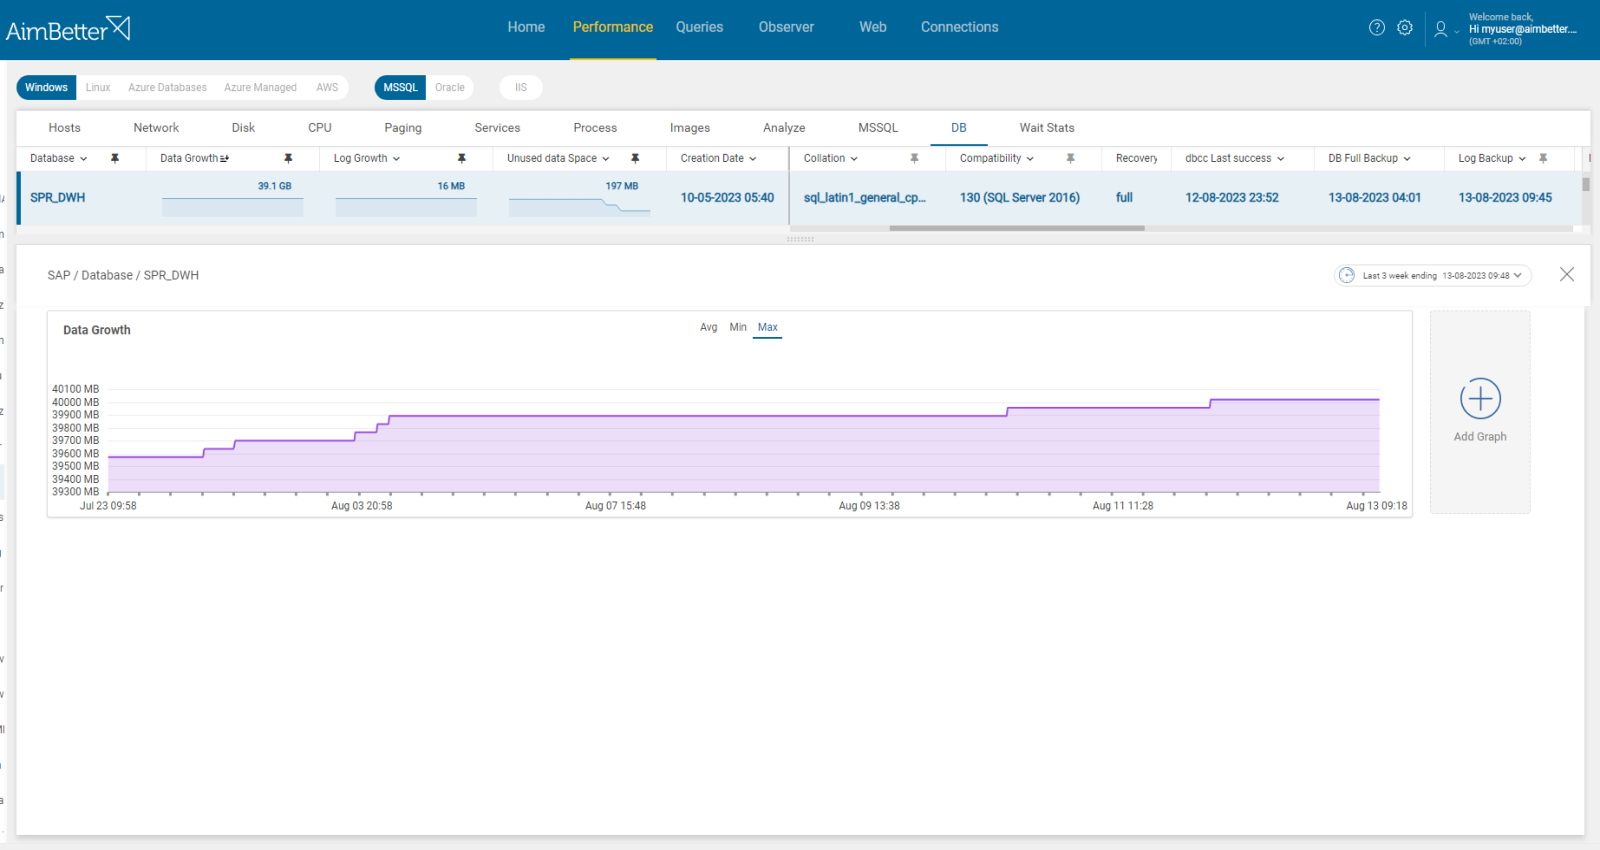
A side effect of this issue is extensive database data file growth, which can affect memory pressure.
Problem identification:
Identify queries with missing indexes, extensive I/O usage, and full-text search.
- Use the Performance Monitor to identify memory pressure in SQL Server. You can also use dynamic system views to look for memory pressure notifications.
- Using tracking tools, identify queries with high disk I/O, with wait types related to internal memory pressure. It might be because of high execution time or non-optimal query plans. You can use SQL Server profiler. This step might take time, and there is no guarantee of accurate results since you check only current issues without historical events.
- Out of the problematic queries, identify which have missing indexes. You can use Database Engine Tuning Advisor or other tools.
- Another option, also for live environments, is querying system views to identify active queries with high I/O activities.
- Monitor the database’s size, checking if it has grown or not. For that, you can implement a script written by a DBA. You should also track disk usage using the performance monitor.
- Investigate the execution plans of I/O-intensive queries. Look for operations that involve full-text search and whether part of the databases involved were found to have overgrown.
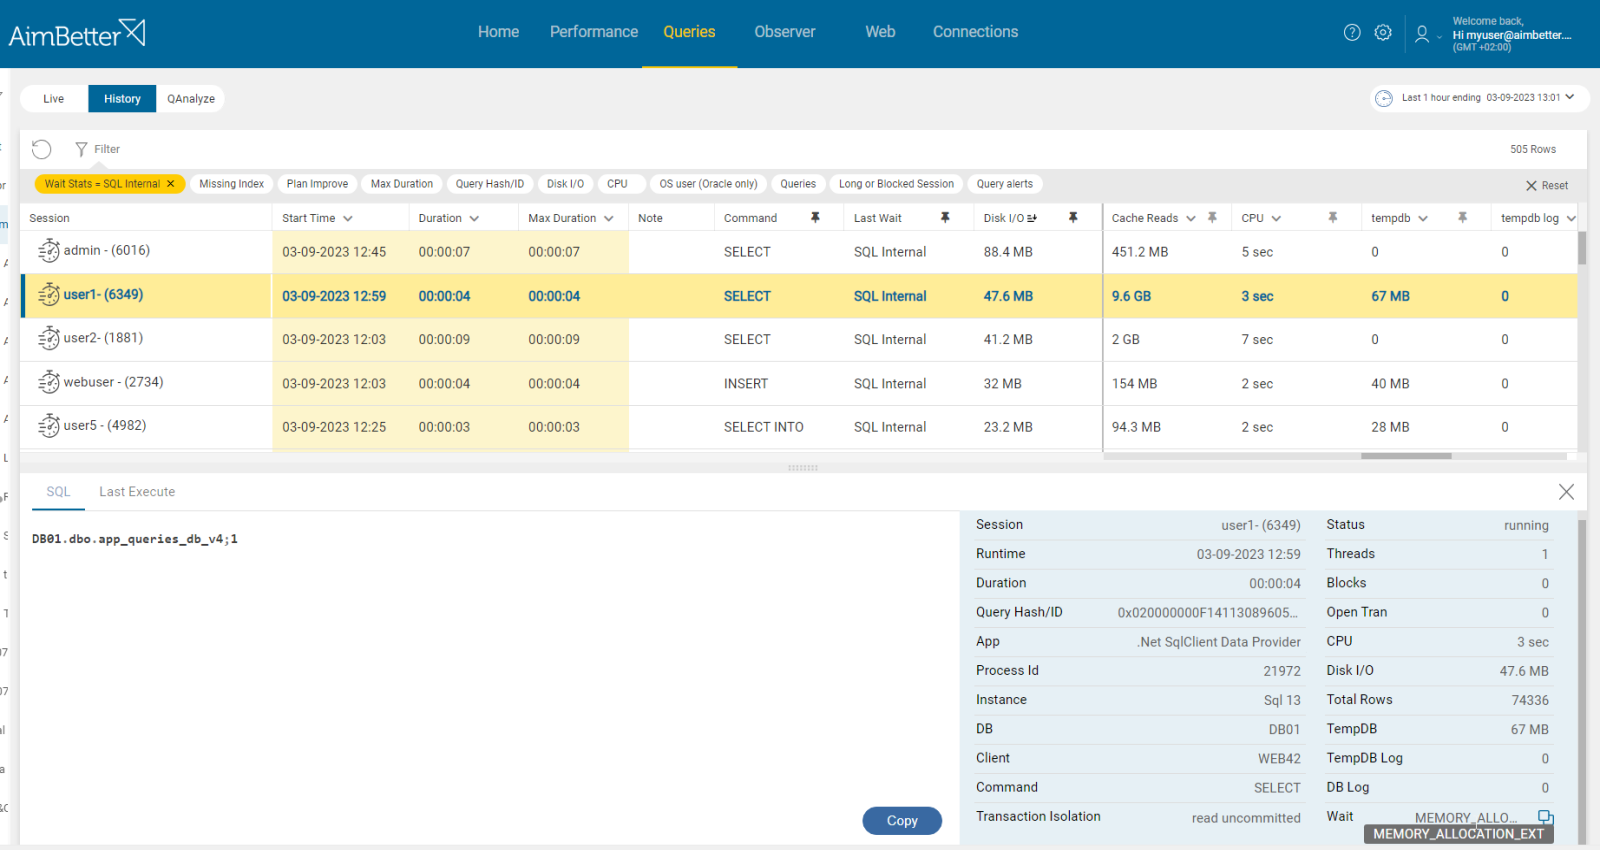
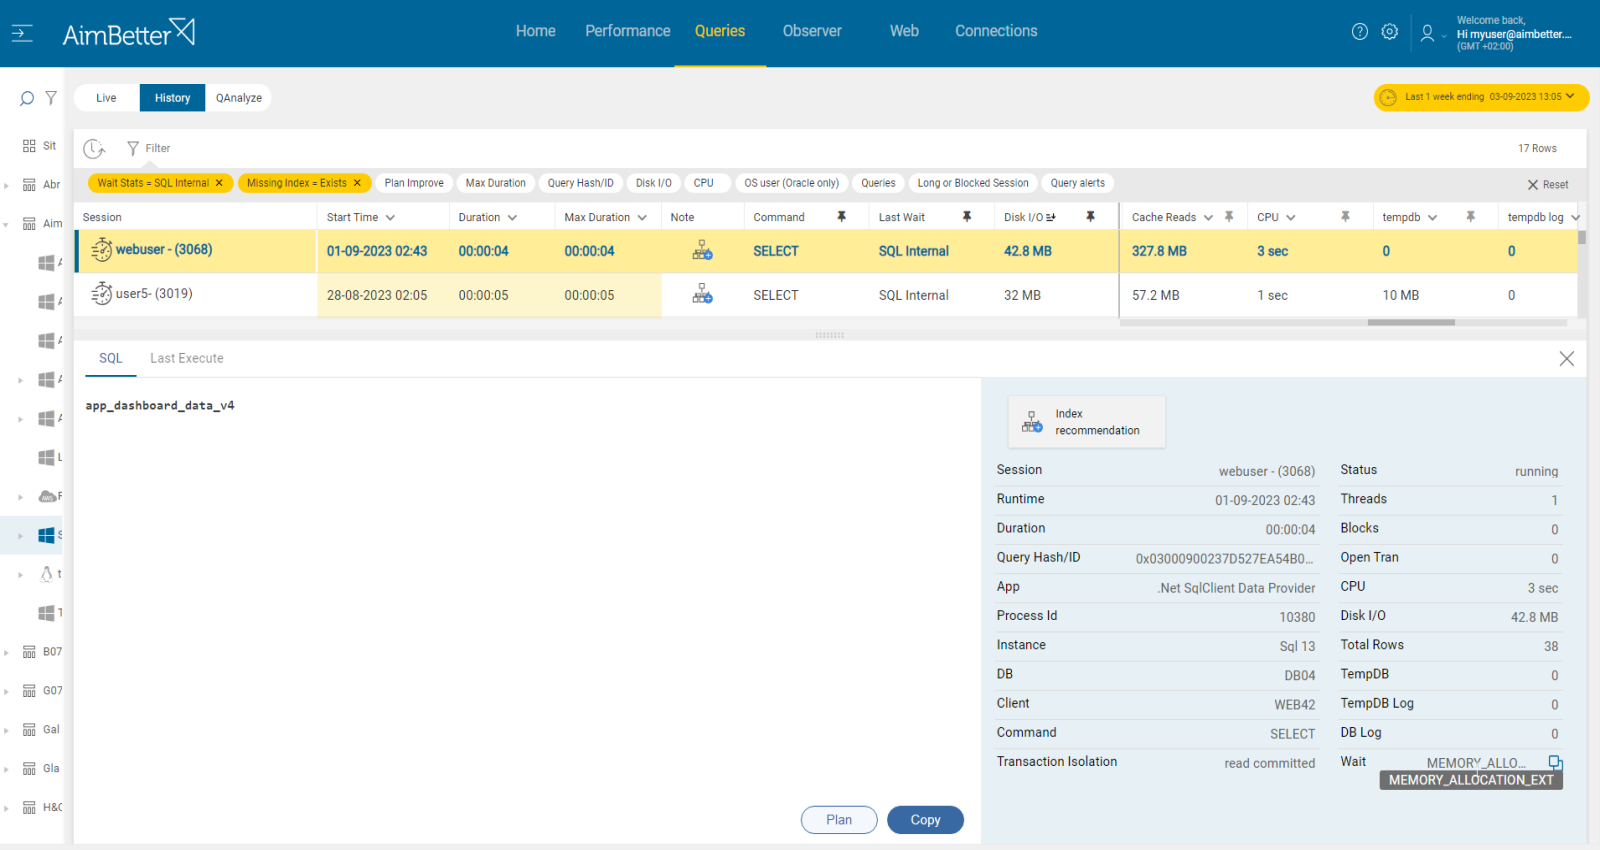
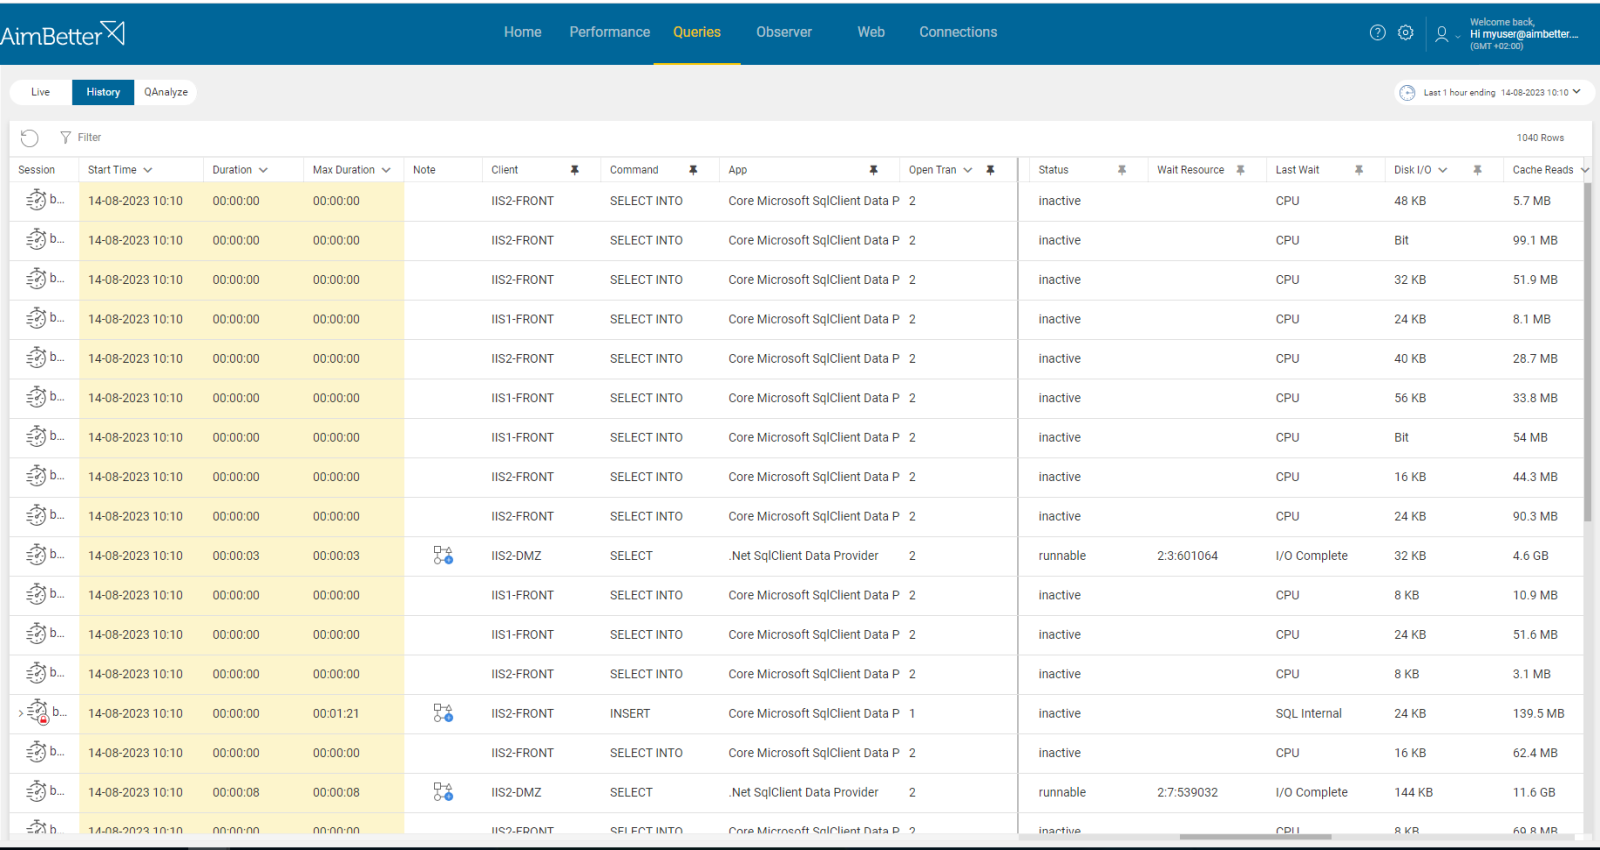
The content of queries is available in the AimBetter platform, including query codes, details, and notes about missing indexes and wait types.
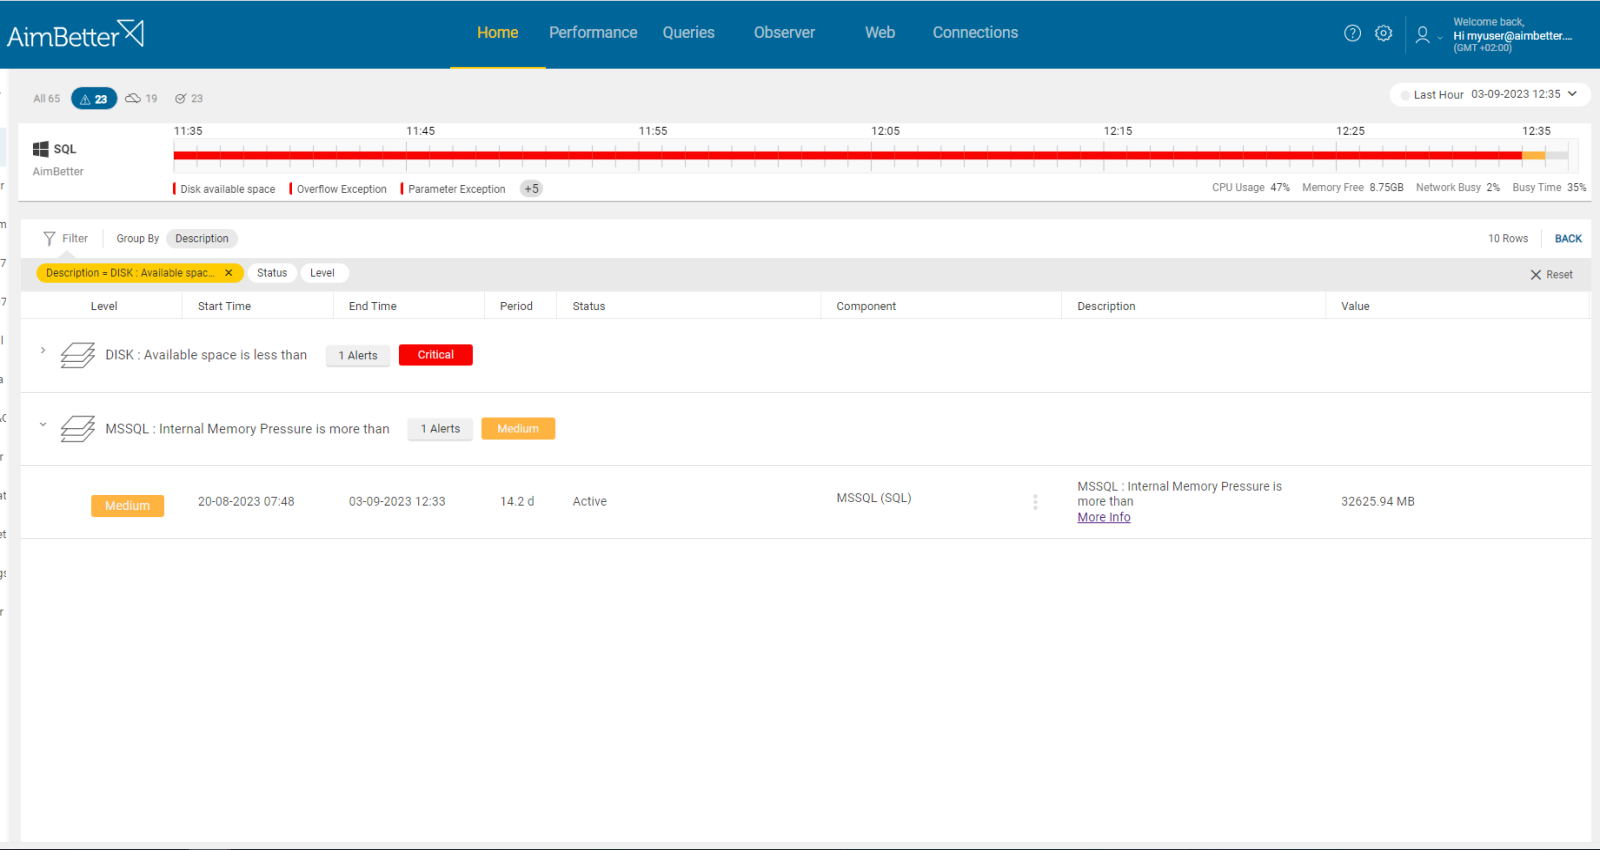
If there is an issue with SQL internal memory pressure, you will receive an alert about it. Gradual or rapid changes in performance are easy to track with its user-friendly interface.
Recommended action :
Implement appropriate indexes or changes in the query’s code in accordance with the query’s execution plan in order to reduce the execution time of queries and, by that, reduce memory requirements as well.
Make sure to monitor SQL Server’s memory usage and performance regularly to identify such issues.
2- External Memory Pressure (physical or virtual). Priority: Medium
Many processes tend to consume much memory, whether they are active or not.
As for Physical memory (RAM) running low, it causes the system to trim working sets of currently running processes, which may result in an overall slowdown. SQL may reduce the commit target of the buffer pool and start clearing internal caches often.
As for virtual memory, running low on space in the system page file(s) may cause the system to fail memory allocations, as it is unable to page out currently allocated memory. This condition may result in the whole system responding very slowly or even bringing it to a halt.
Problem identification:
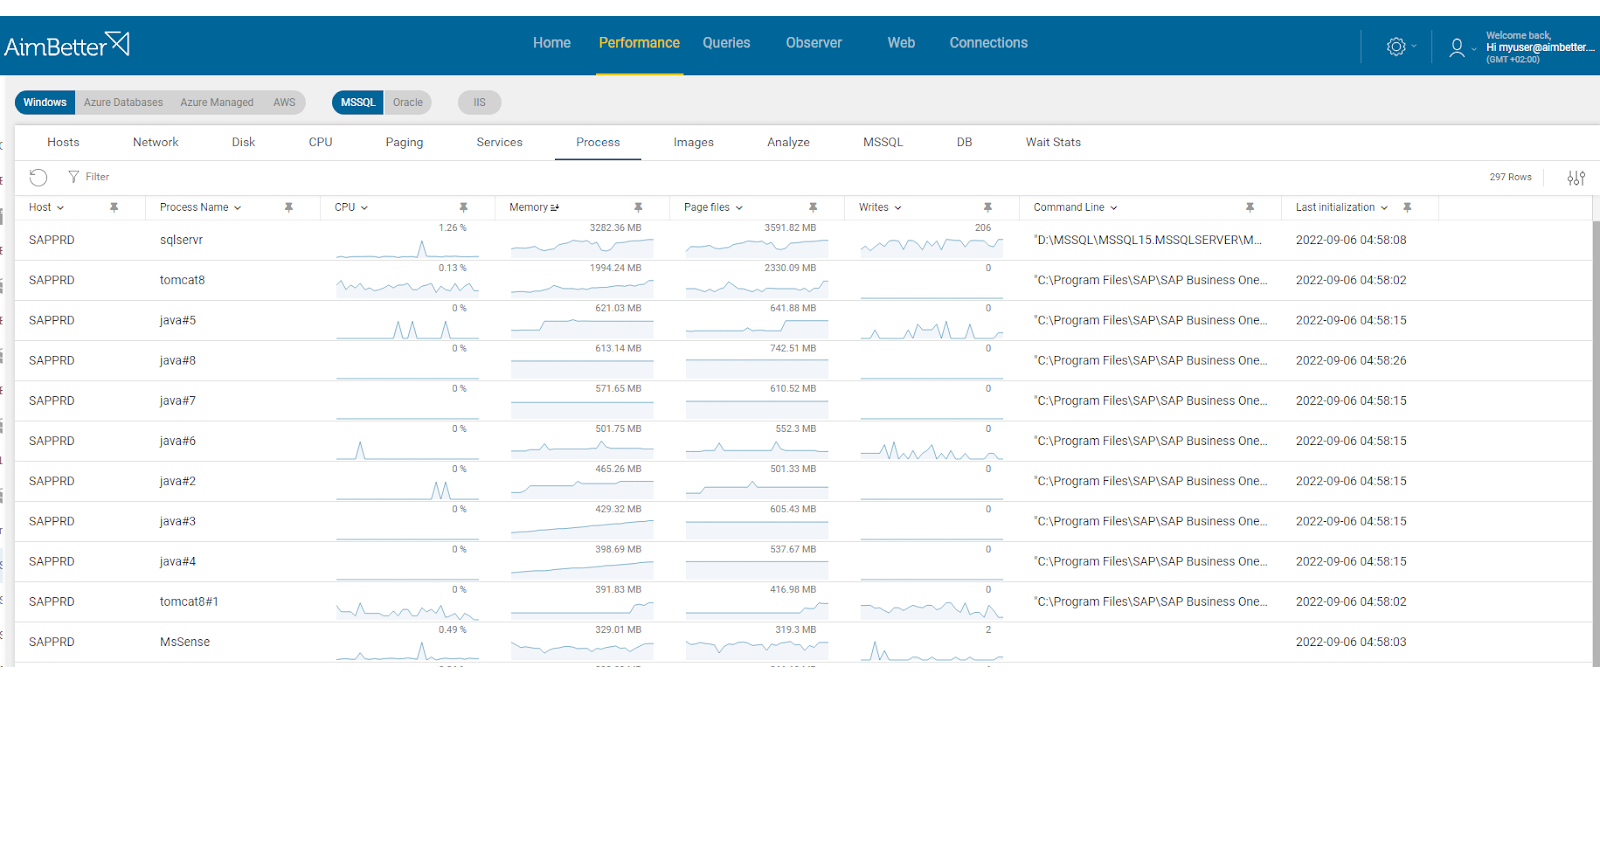
In the database server, identify system processes – not SQL – or applications that contribute to higher consumption of both virtual or physical memory in parallel to internal memory pressure in the SQL Server.
- Use the Performance Monitor in order to identify memory pressure in SQL Server. You are also able to use dynamic system views to look for memory pressure notifications.
- Use the Task Manager and resource monitor to check which applications use more memory and which have more page files. While doing it, also look for background processes. You should consider closing applications that you are not using currently. It might be hard to track, and you can’t guarantee a precise result since you depend on live data without any history.
- Consider upgrading your RAM to improve performance. This is an expensive solution and must be the last choice after verifying the real need for it.
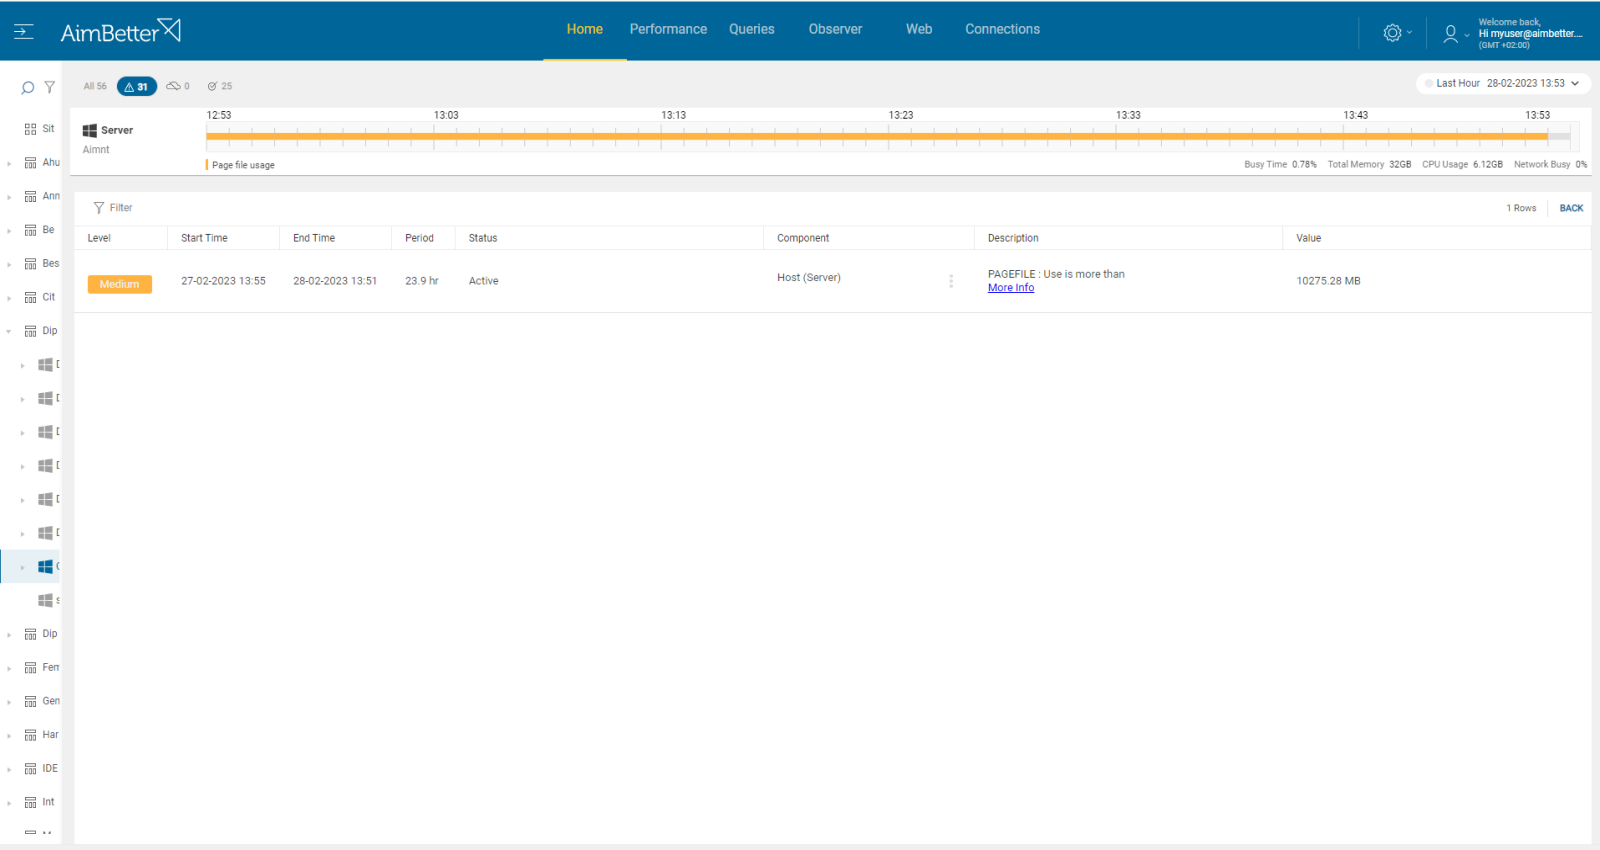
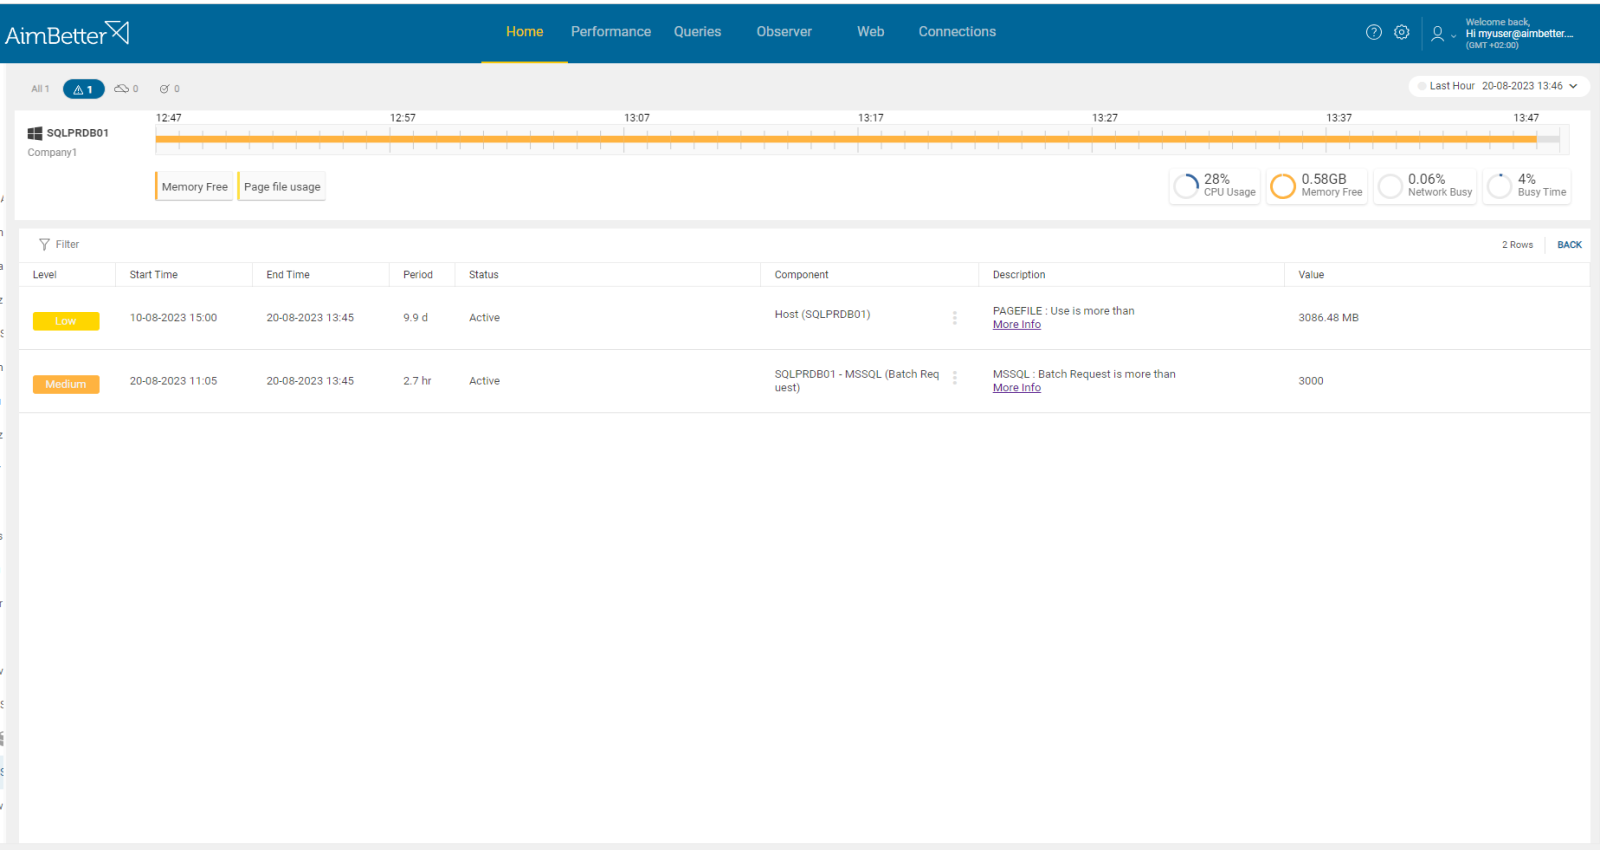
AimBetter immediately notifies you about high page file usage or low free memory available on your server in parallel to the internal memory pressure alert.
By providing specific alerts for processes’ consumption separately and enabling tracking for a long time period, you can easily identify the source of external memory pressure.
Recommended action :
Close unnecessary applications that are not actively used at the moment and consume much page file or RAM memory.
Make sure to adjust the memory configuration according to business needs and look for possible adjustments.
Allocate the page file path to a different disk and increase the allocated memory to the paging file.
Make sure to monitor this issue regularly in order to ensure optimal performance.
If possible, isolate SQL Server from other memory-intensive applications or services.
3- SQL Server Memory Allocation is not optimal. Priority: High
If the SQL Server’s maximum allocated RAM memory is not enough, it may struggle to process requests and cause internal memory pressure.
This issue will involve the degradation of the buffer pool and page life expectancy values.
It means that SQL Server struggles to manage the data effectively.
Problem identification:
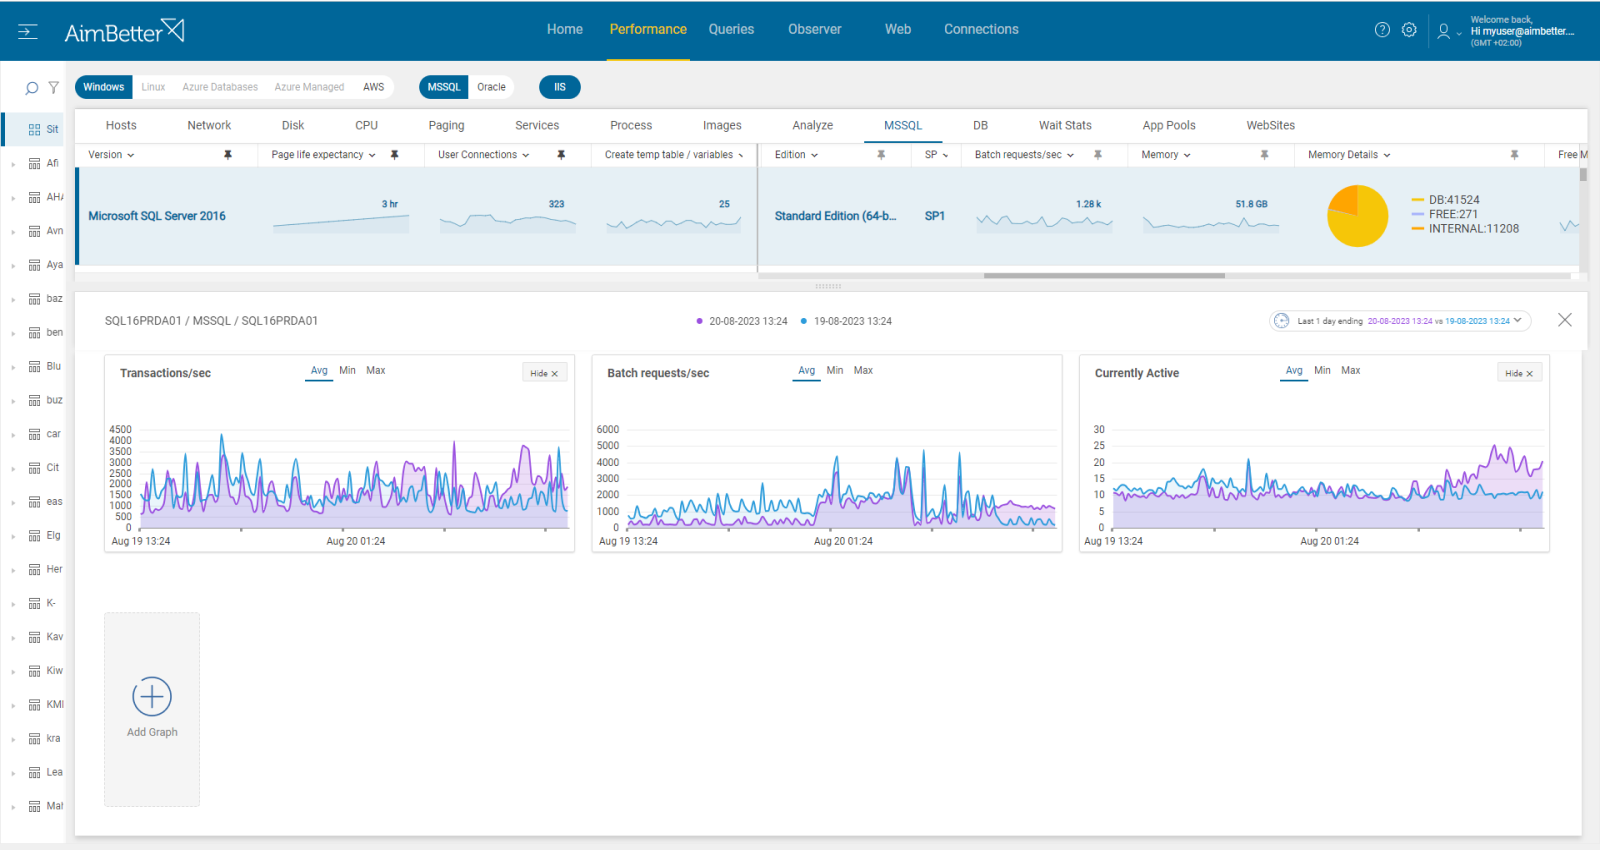
A sudden increase in resource consumption or higher query activity is causing SQL internal memory pressure, for which the current SQL memory allocation may not be enough. The current SQL Server’s memory allocation is probably unable to meet the workload’s demands.
- Review current page life expectancy and buffer cache hit ratio. If these values are low, this might be a sign of insufficient memory allocated to the SQL Server. You can read more in related articles: Page Life Expectancy and Cache Hit Ratio.
- Review the target server memory counter via the Performance Monitor of SQL Server. In cases when the database engine won’t reach this target, it might indicate insufficient RAM memory.
- Review the SQL Server error logs and Windows event logs for memory-related warnings or errors.
Recommended action :
Adjust the SQL Server’s memory settings (e.g., max server memory) to allocate the appropriate amount of memory needed for the current activity while considering the overall host server activity, not related to the SQL, to decide the optimal distribution of memory.
4- High user activity, including remaining open connections. Priority: High
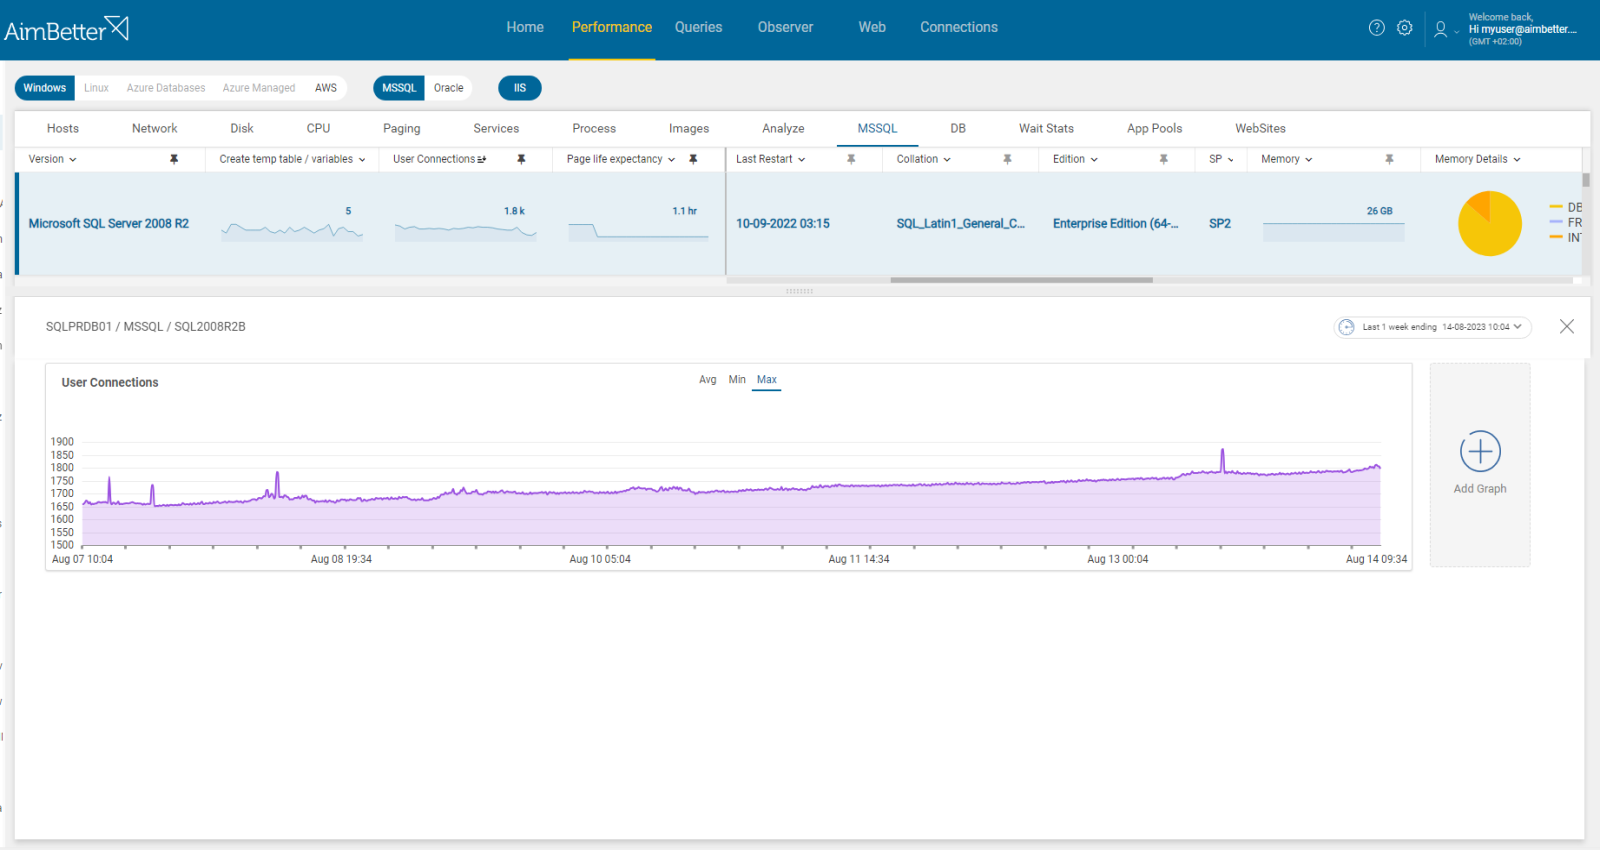
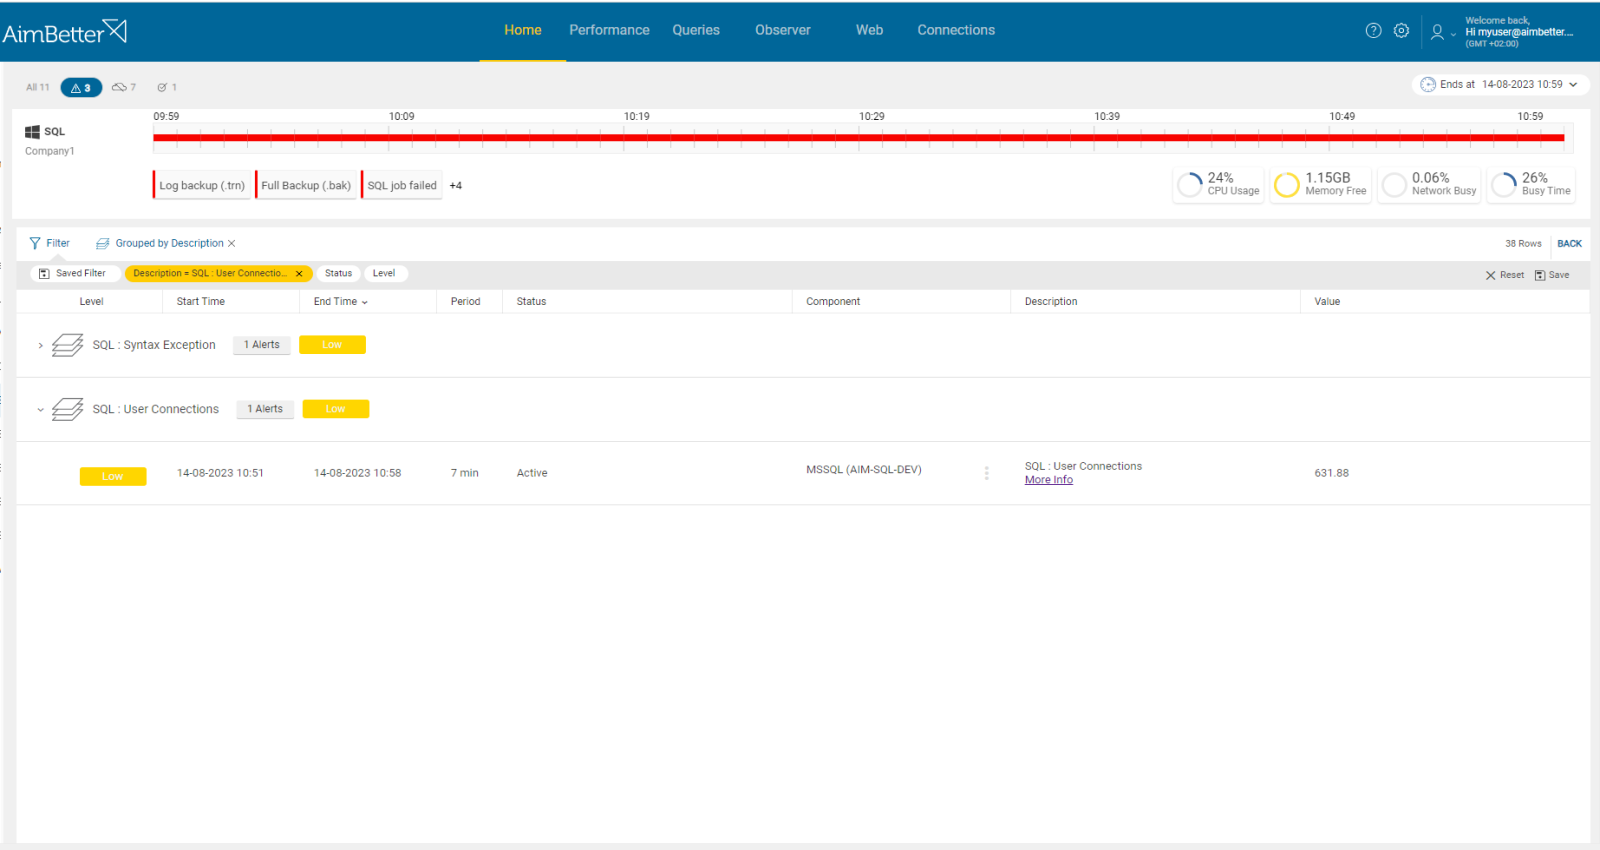
A large number of user connections or sessions can increase memory pressure, especially when the connections remain open and are not closed properly when finishing the execution of operations.
Problem identification:
Check for increased user connections number and check both the application and the login name identified in the sessions.
- Connect to the SQL Server Management Studio (SSMS) and navigate to the Activity Monitor. This provides online information about user connections, yet without historical data to compare with in order to decide what the source of the increased activity is.
- Query SQL Engine system views to identify repeated patterns of many connections originating from the same user or application. However, also here, you don’t have historical data, and you should monitor this issue manually.
- Check the application’s logs for any unusual activity or errors related to connections. For that, you have to know where it’s located and how to search for it in the logs. You can check for SQL Server logs as well.
- You should track this issue in order to characterize the routine behavior of connections in your environment.
Recommended action :
The root cause should be diagnosed accurately in order to solve this issue permanently.
For immediate handling, close unnecessary connections that are currently open.
Following this, analyze if the application’s connections are being properly managed and closed, set appropriate timeouts for idle connections, and consult with the application team on whether to limit the number of connections established by a single user.
Anytime you take action, you should monitor this issue and review if there is a significant change in memory pressure.
5- Lack of Database Maintenance.. Priority: Medium
Each database engine should have regular maintenance tasks scheduled. These tasks are essential for optimal performance of the SQL Server.
Tasks such as index maintenance, dbcc integrity checks, updated statistics, and more are crucial for the database’s adequate activity.
Problem identification:
Check if there are maintenance issues in your database environment.
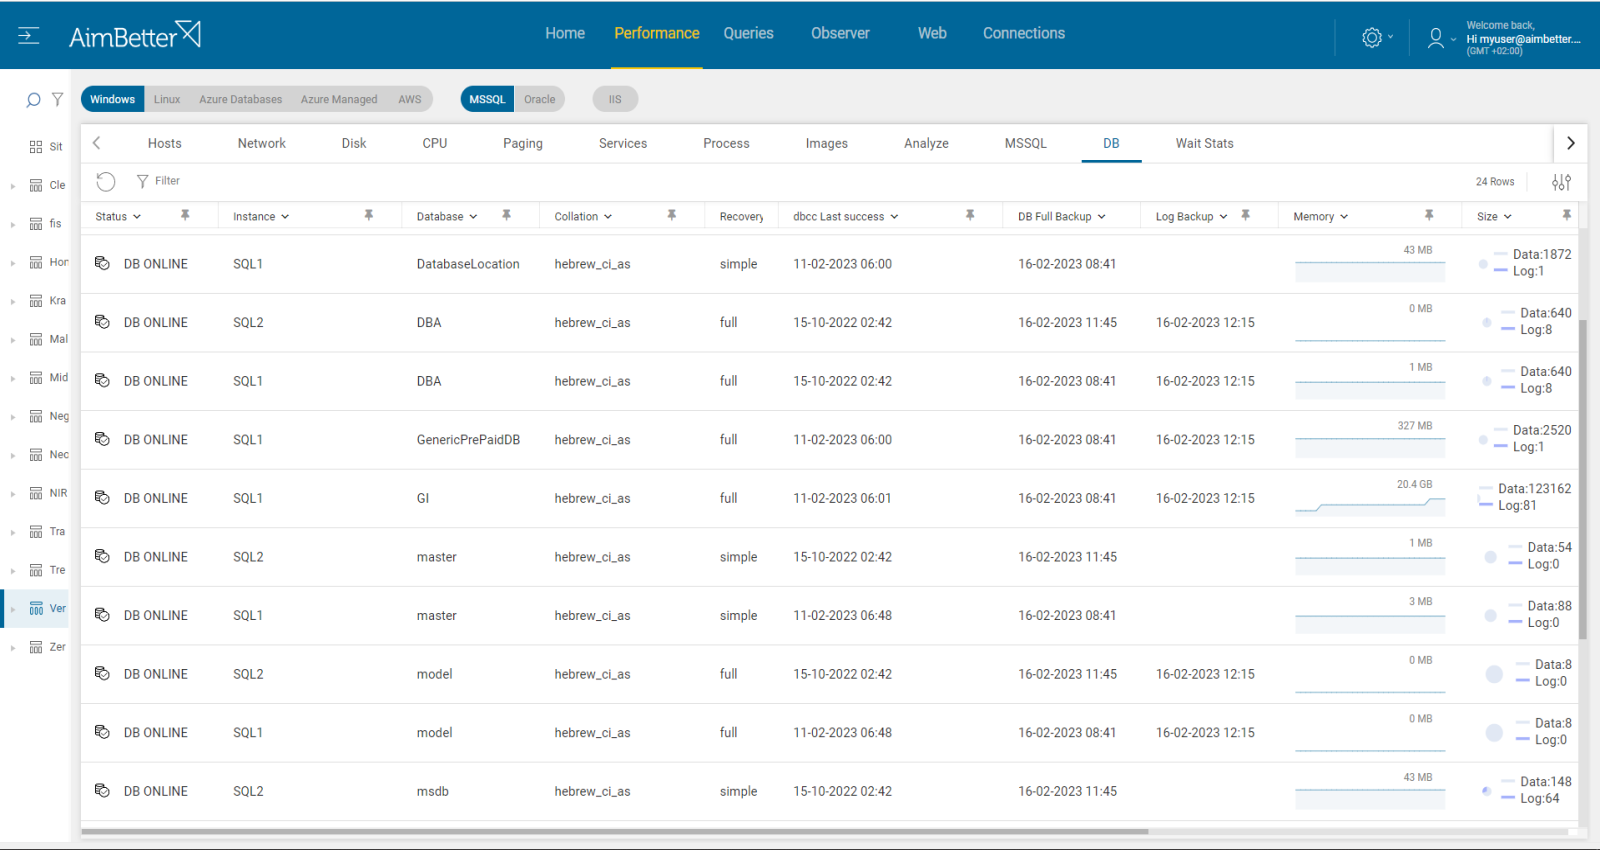
- Check the Backup policy and whether it is being regularly followed
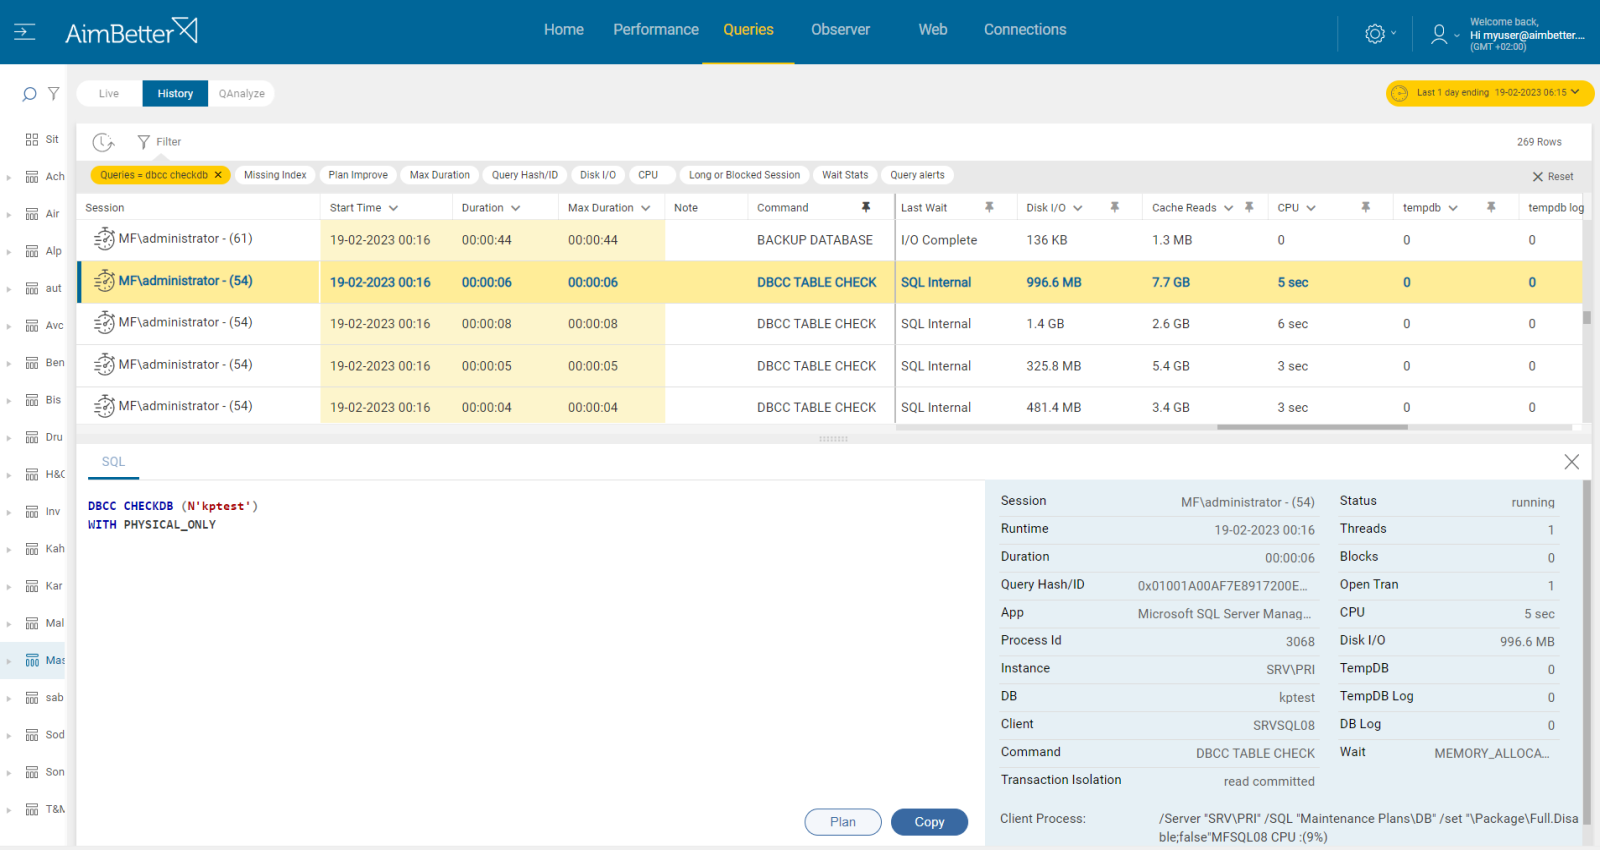
- Check in the SQL Server Management Studio, if there’s a daily DBCC CHECKDB scheduled. This can be done manually for each database or through a script.
- Check if there is a maintenance plan, including jobs involving DBCC CHECKDB commands, rebuild index tasks, and statistics update tasks.
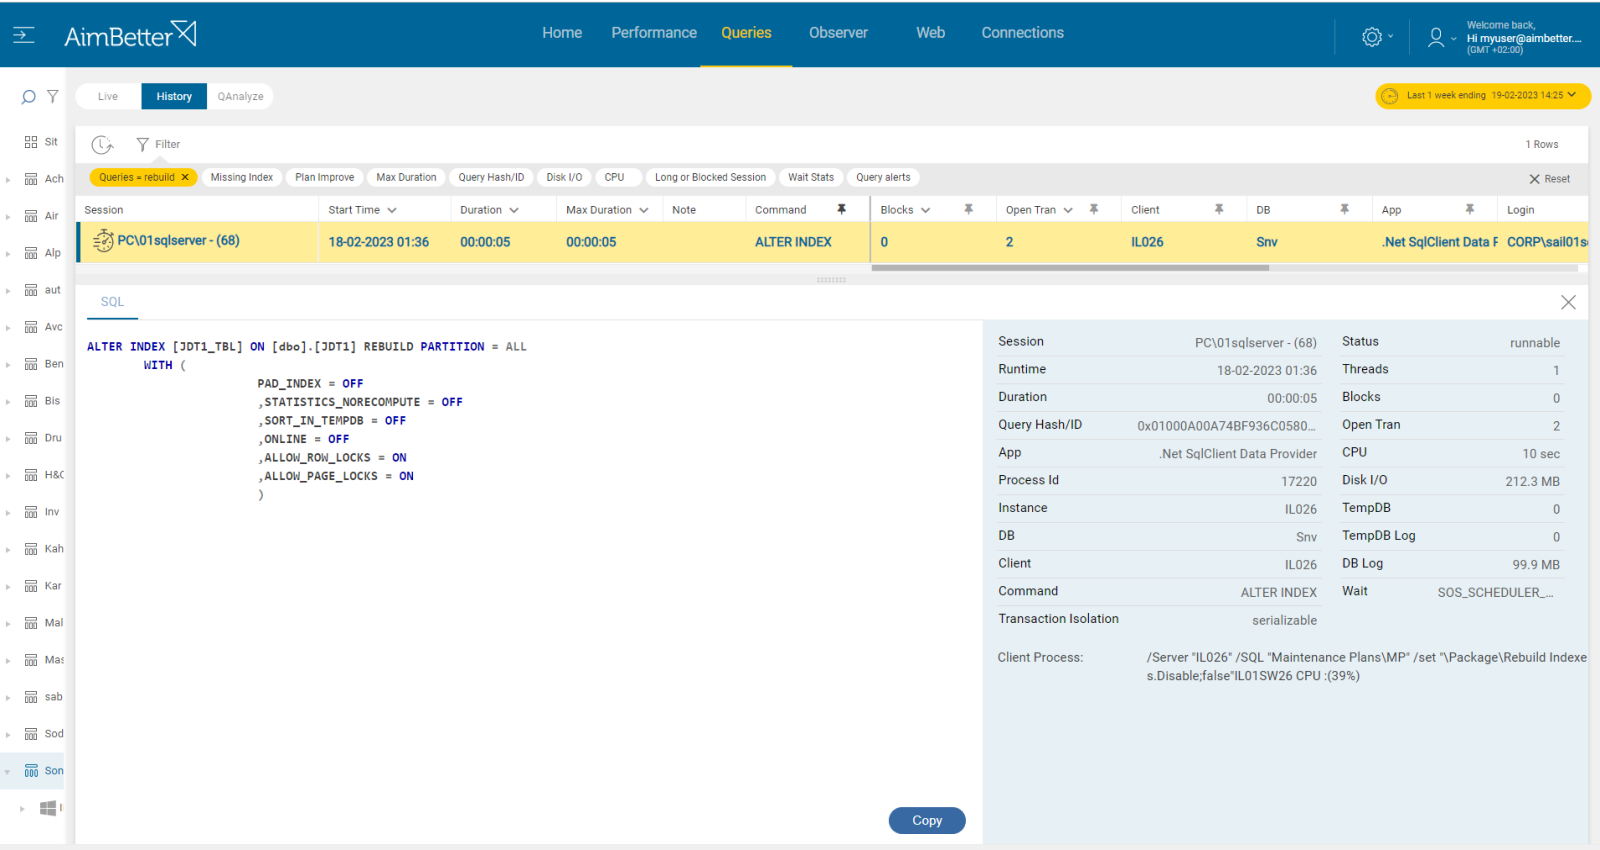
Recommended action :
We suggest implementing maintenance tasks for each active database in your SQL Server instance. You should do it with the intervention of a DBA and track the server performance after it’s done.


