A CPU core is a single processing unit within a complete CPU (Central Processing Unit). Modern CPUs typically have multiple cores, each of which can work on separate tasks simultaneously, enhancing performance.
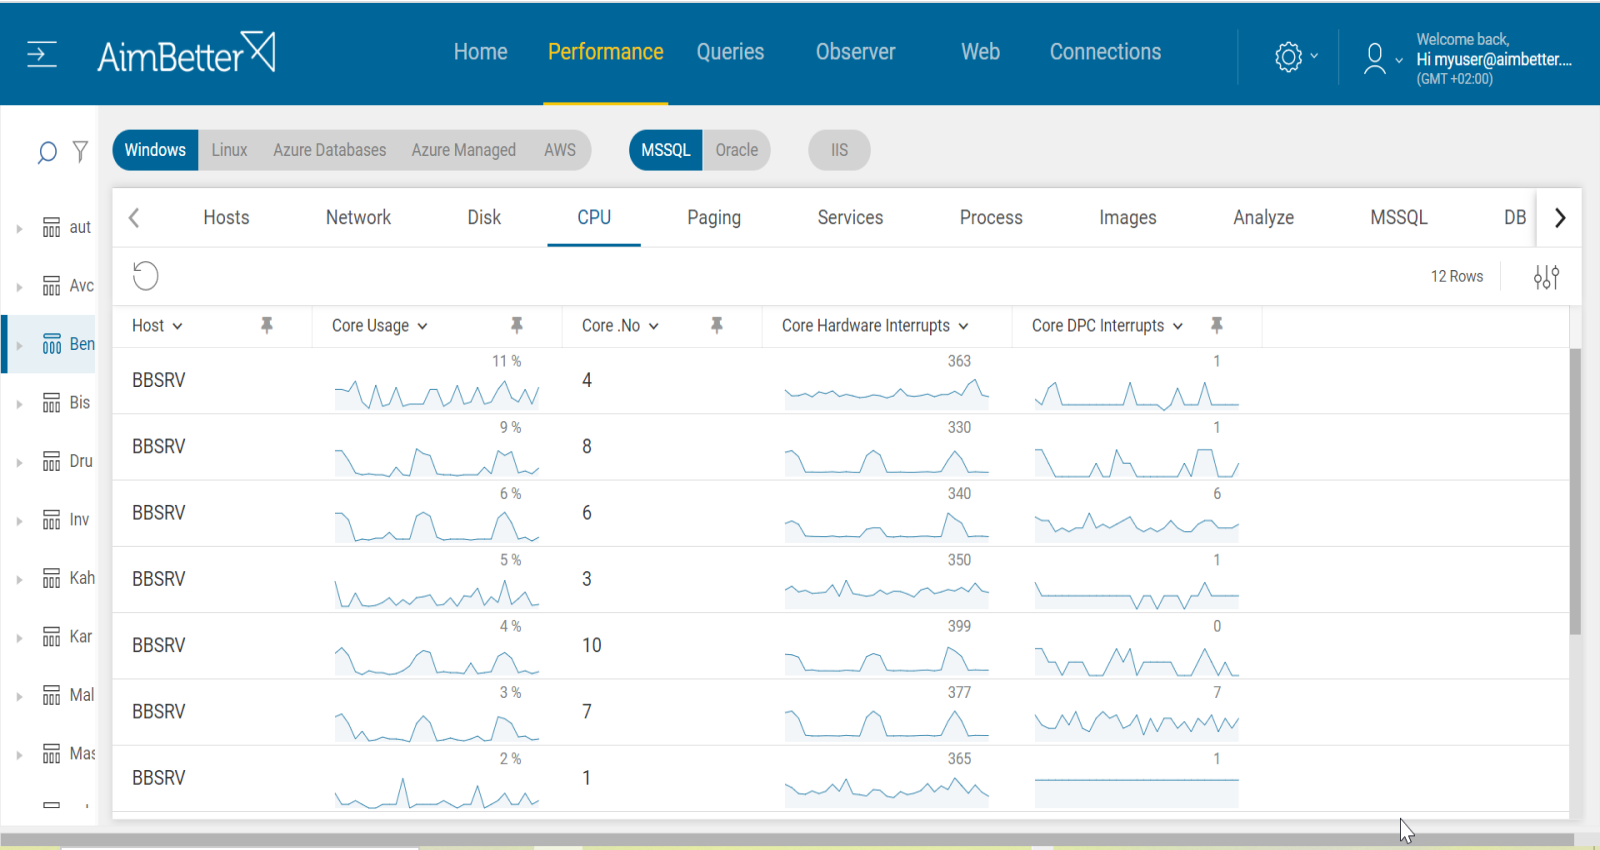
Distribution of workload over available server cores is handled by the kernel of the Operating System, and this can result in some cores running fully loaded while others are nearly idle. Sometimes, system performance reports may show that the total CPU load is low while individual cores are, in fact, running at or near 100%. This alert reports on individual cores that cross the threshold.
It works together with the HOST: CPU CORES UTILIZATION alert, which reports average utilization across all cores, by reporting utilization per individual core.
Find out how you can save hours of work when investigating the root cause of this issue.
Symptoms
Some applications are running slower, and database activity degrades. User experience will possibly be worse than usual.
Impact: medium
When calculating the possible impact, one should take into account that the effect of single-core utilization depends on application and system settings. Some applications are designed to run on a single core, meaning they only use one CPU core. However, some are designed to run with all cores together, not affecting single-core utilization.
Expected Behaviour
A single core utilization should not be 30% more than the rest of the cores. In addition, single core utilization should not pass 70%.
The best performance would be that core usage will be divided by the same value for all cores. Therefore, total CPU Usage will represent the total utilization of all cores together. This behavior is necessary for database environments, such as SQL Server, since SQL utilizes all cores possible in the server for the best performance and faster execution times of queries. For that, cores’ utilization should be divided evenly.
Possible causes
1- Single-core applications Priority: High
Some applications are set to run on a single core, therefore when the activity of the application is higher, one core is overloaded. In addition, some old-designed applications do not support multiple cores, causing the utilization of individual cores only.
Problem identification:
Identify which applications are running on a single core and if one of the cores is overloaded.
1. Open the task manager, switch to the “Details” tab, and look for the “CPU” column. Try to look for an event when CPU usage for a particular application is always at 100%. It’s possibly a single-core application. Take into account that this task would need to be done several times and requires tracking.
2. Run a server report using a performance monitor. Take into account that you should do it multiple times.
3. Check with the IT team if some applications are single-core utilizing.
4. Check the application’s documentation to see if it mentions anything about its ability to take advantage of multiple CPU cores.
Once there is an issue with a single core utilization, Aimbetter raises an alert about it.
Our solution makes the investigation process easy and quick.
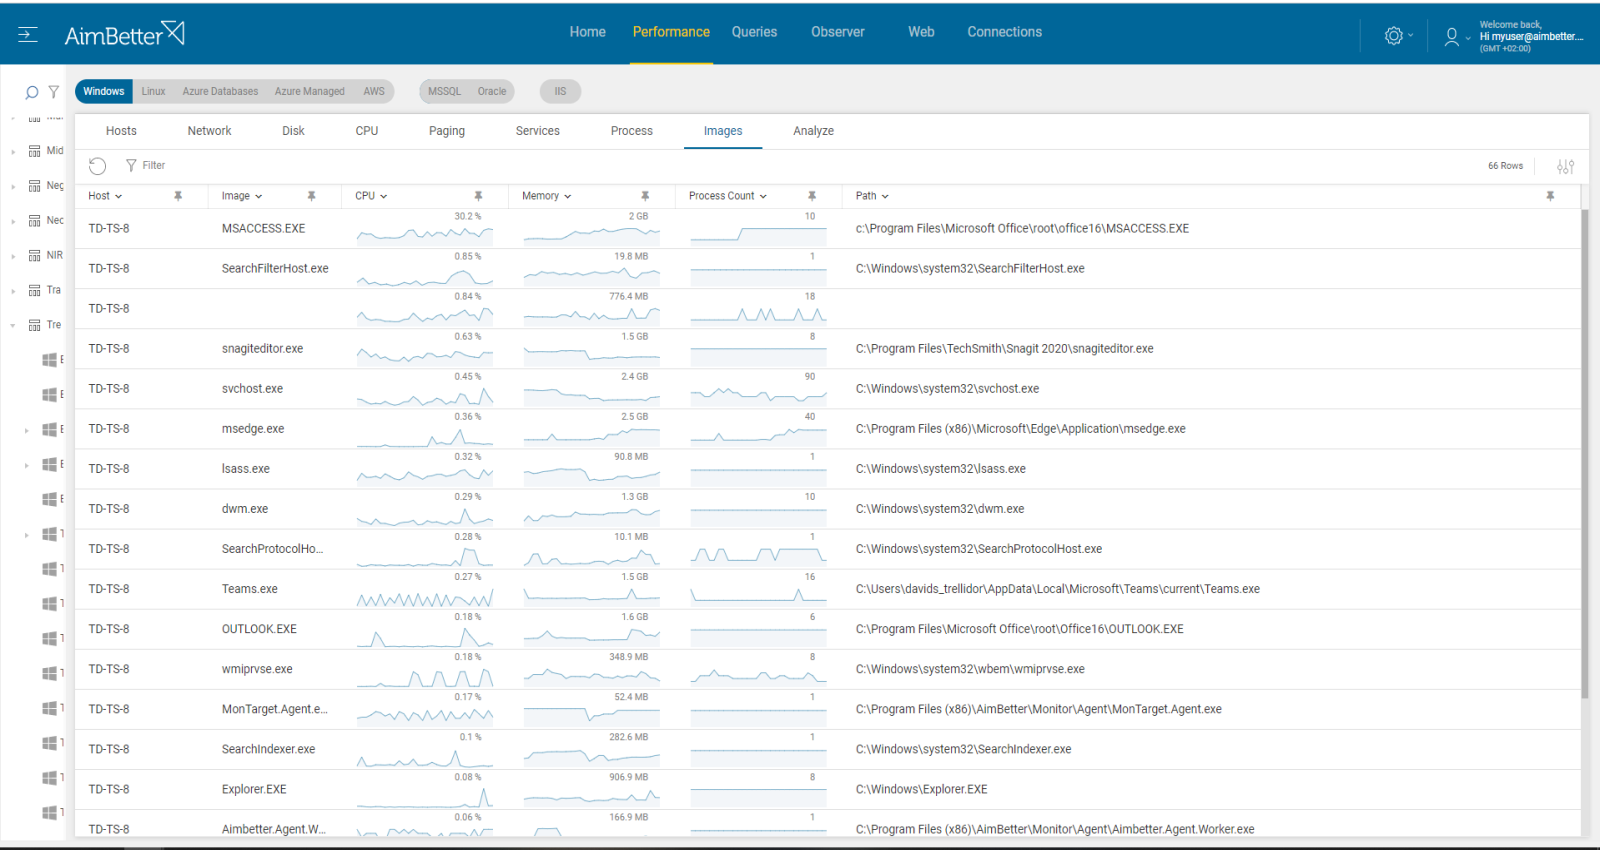
In addition, specific alerts track over time on a single process or image utilization. You may also simply check the graph’s history and track the CPU utilization by processes over time.
Recommended action:
The best solution for single-core applications would be managing a separate environment for the application performance. Another solution is reducing the application performance when possible. Otherwise, consider adding cores.
Take into account that the follow-up should be done for the server’s total performance and outcomes and not only for the single core performance.
2- Long System tasks Priority: High
When multiple applications or processes are running simultaneously and require access to the same core, system tasks might run longer. This can cause the CPU to use only one core while the other cores are not busy.
CPU loads might occur once many users are using the same application on the same machine, which happens regularly in Terminal servers. Otherwise, unusual levels of CPU load activities may be coming from external operations (anti-virus scans, backups, restores, etc.) from networked data stores. Probably part of the application will require using only an individual core.
Problem identification:
Identify the source of the load and if it’s happening only with a single core. If it is recurrent, try to reschedule to a time of low user demand.
If you are experiencing high CPU usage on a system and you have ruled out database-related issues, there are several steps you can take to identify the cause:
- Check the Task Manager or Activity Monitor: use built-in OS tools such as Performance Monitor to identify which processes are using the single CPU resources. You can’t guarantee precise results when checking the online status with no historical events.
- Identify the process causing high Core usage and then determine the cause of it. You can use a process explorer tool like Process Explorer for Windows or Htop for Linux.
- Look for unnecessary startup programs: Some programs may start automatically and run in the background, consuming CPU resources. You should disable it. It might take time to identify it.
- Make sure your software and drivers are up-to-date.
Recommended action :
Cancel unnecessary programs that cause high Core utilization or change their execution to a time when work demand is lower. Otherwise, look for the cause that suddenly the Core utilization of a specific program has risen.
3- Hardware issues or thermal problems Priority: Low
Hardware issues might be caused due to damaged CPU. Sometimes the number of cores to utilize is limited once the Operational System limits the use of CPU Cores due to high CPU temperature. Another reason might be bad power management settings.
Problem identification:
Check the issue manually with the System team, or look for errors and logs related to these problems.
1. Do a manual check with the system guy in order to identify faulty hardware.
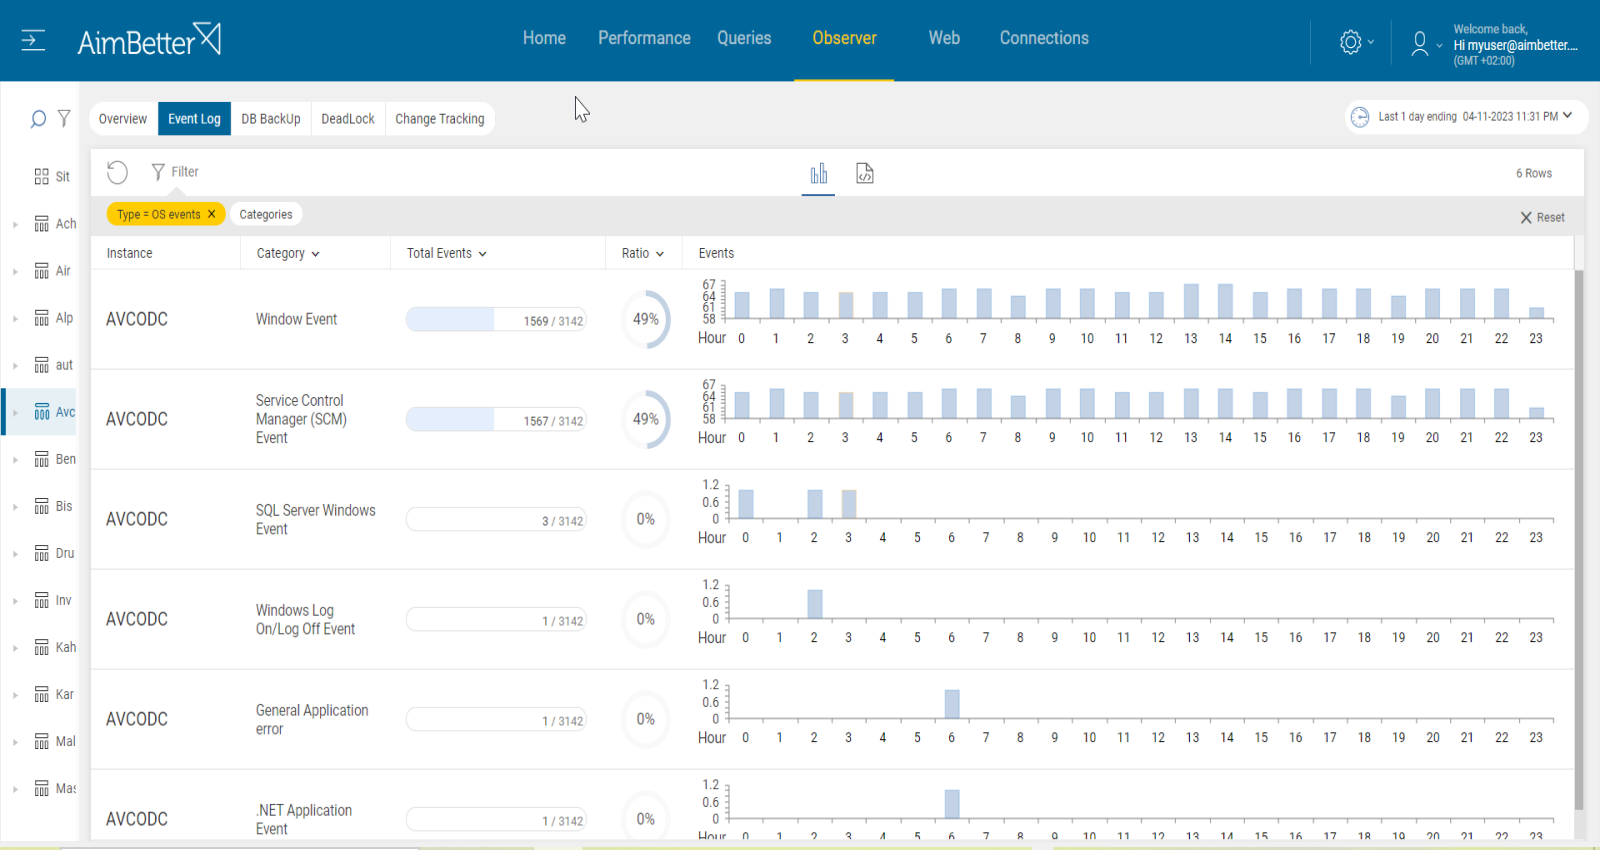
2. Look for errors in the system logs. You should use the event viewer or log file under C drive system files. This search might take time and requires a bit of knowledge of tracking system logs.
Recommended action :
Replace the faulty cores with new ones.
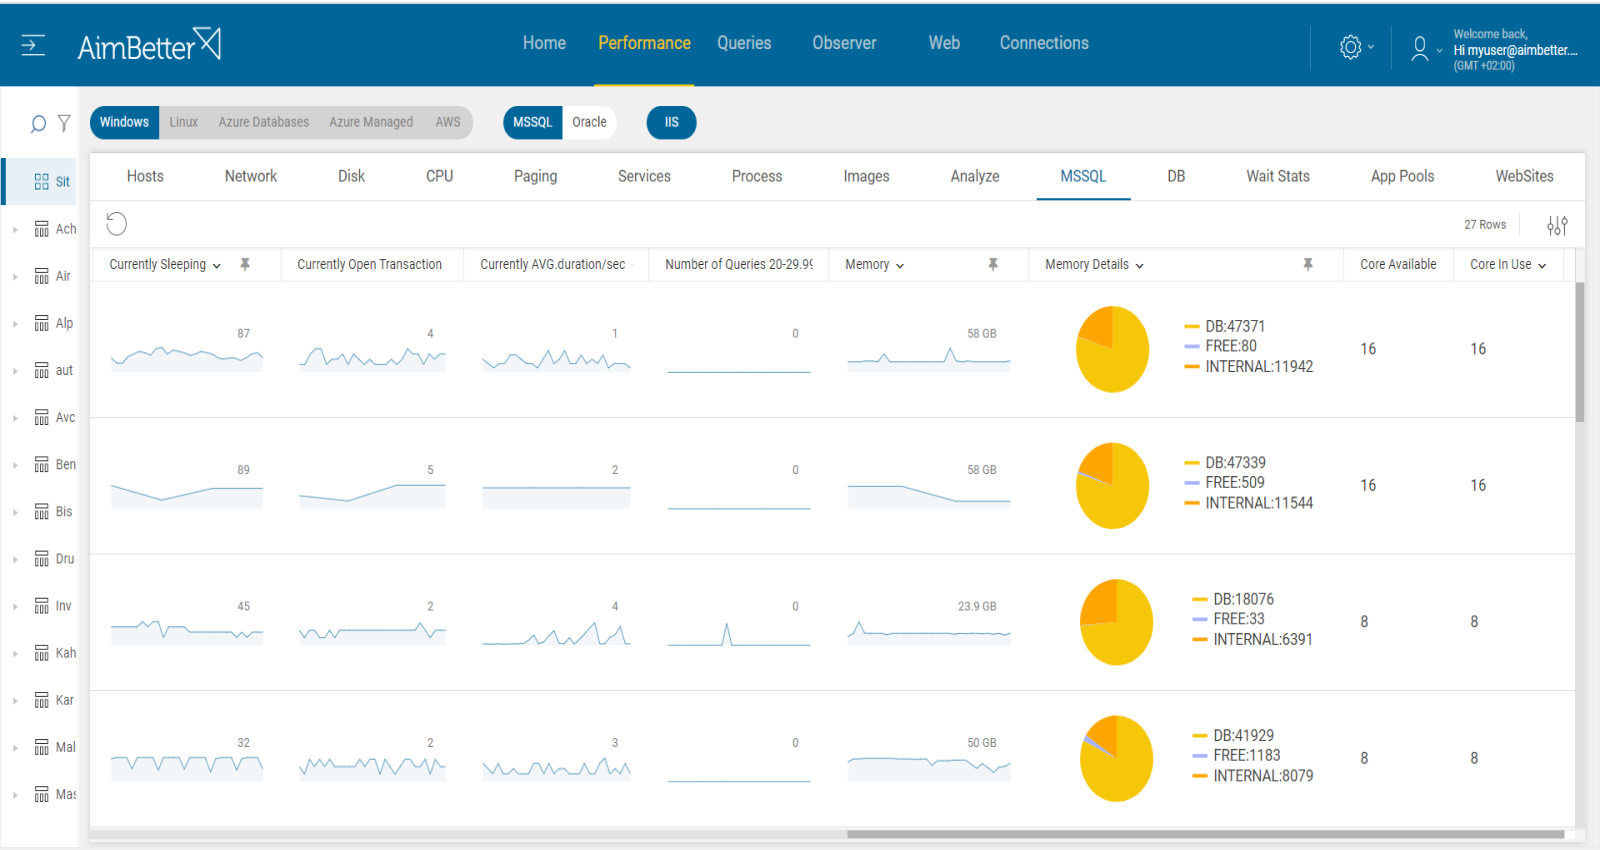
4- SQL activity does not utilize cores evenly Priority: Medium
When the division between cores is not optimal, there are more cores than those that SQL utilizes. The SQL server work does not split evenly between all the existing cores on the server. When this happens, it might cause higher utilization of an individual core.
SQL Server is designed to take advantage of multiple CPU cores by using a feature called parallelism. Parallelism allows SQL Server to split a single query or operation into multiple smaller tasks that can be executed simultaneously across multiple CPU cores.
Problem identification:
Check the database server settings while monitoring the query’s performance.
1. Track the activity monitor of the SQL Server Management Studio. Look for the CPU utilization of processes and follow cores used for the execution of processes. This might be complicated and time-consuming.
2. Run a script checking the status of the current number of tasks running and average CPU utilization with the count of active cores. This task requires a skilled DBA.
3. Follow up active sessions with a script. Try to execute it several times at different times in a day.
Recommended action :
Analyze queries’ performance and general OS resource consumption. Bottlenecks might cause this issue.
Try changing the current workload by changing queries’ current code, partitioning queries, and changing column store indexes.
Consider changing the current settings of the instance. It’s possible for SQL Server to change default settings once there is a workload. Change it to distribute between the least busy CPU cores on workload events.
Consider upgrading, if possible, upgrade to a newer instance version.


