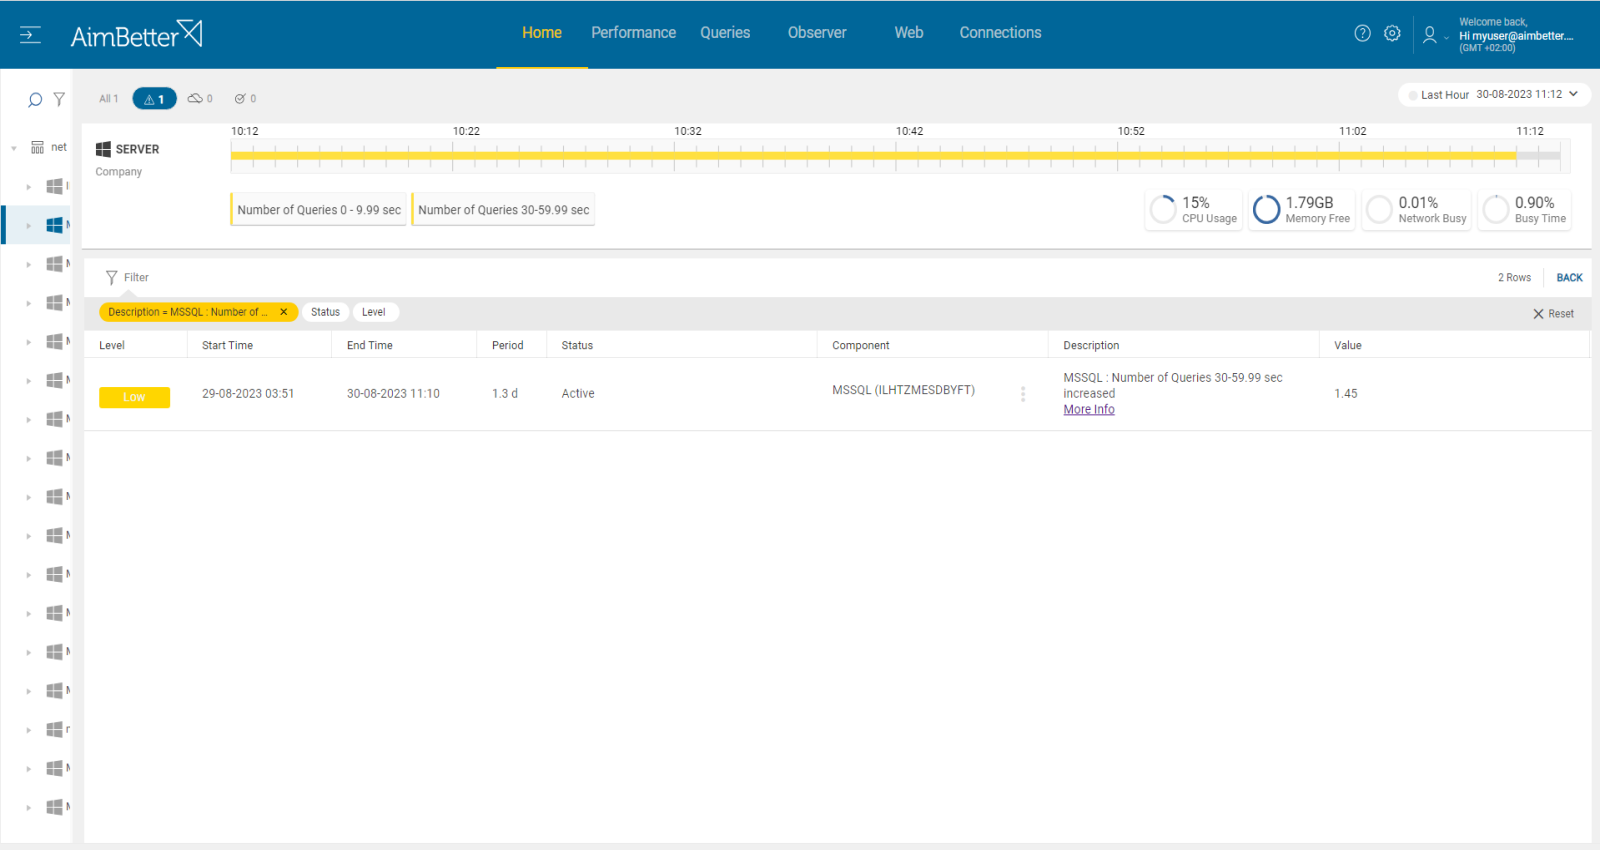
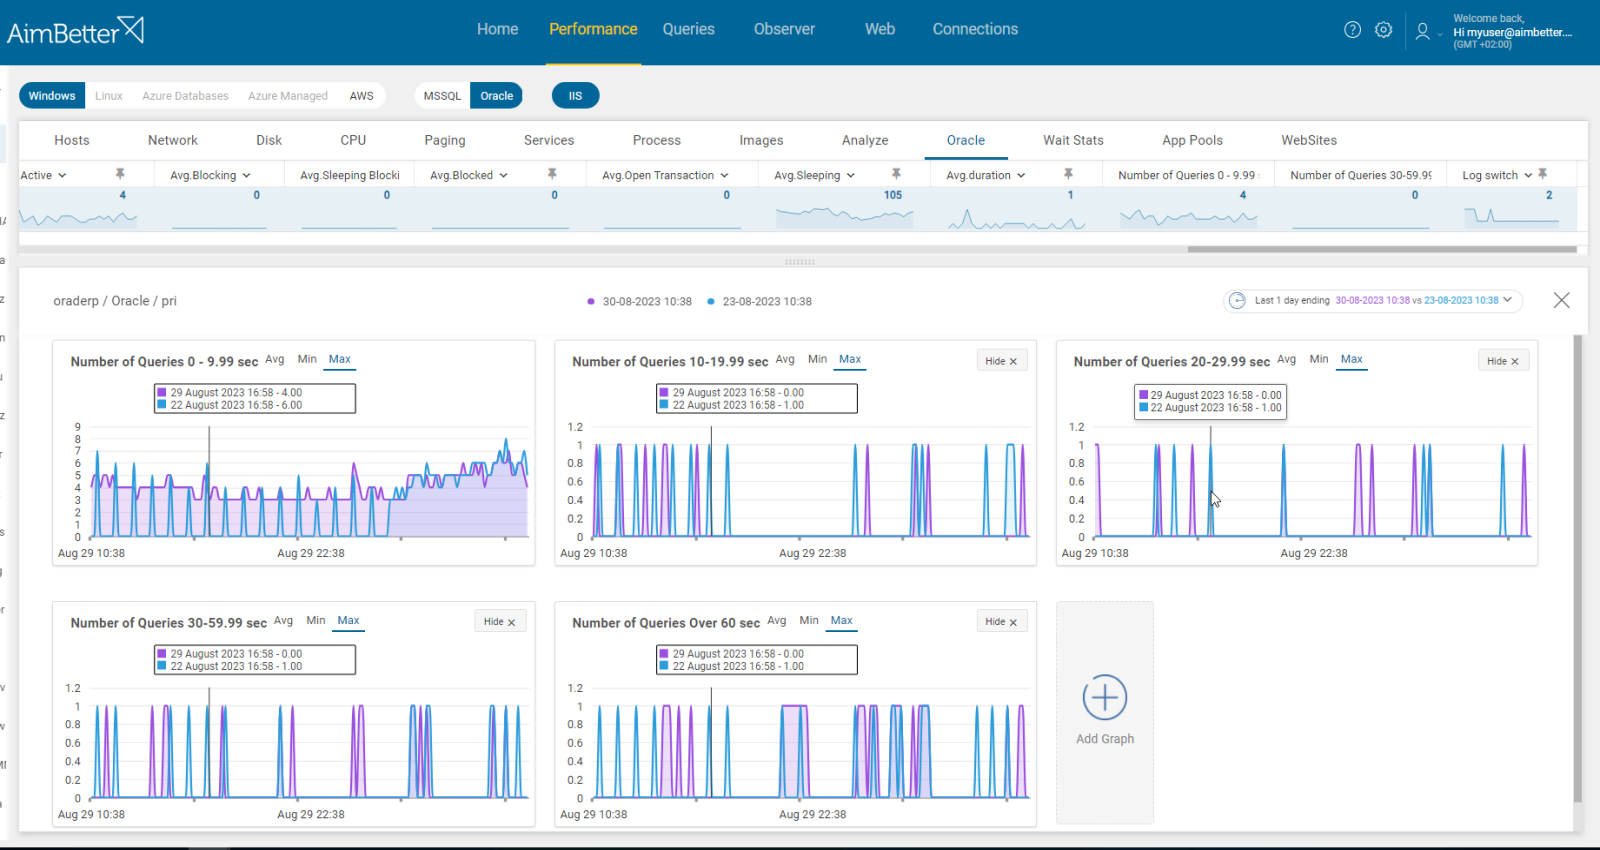
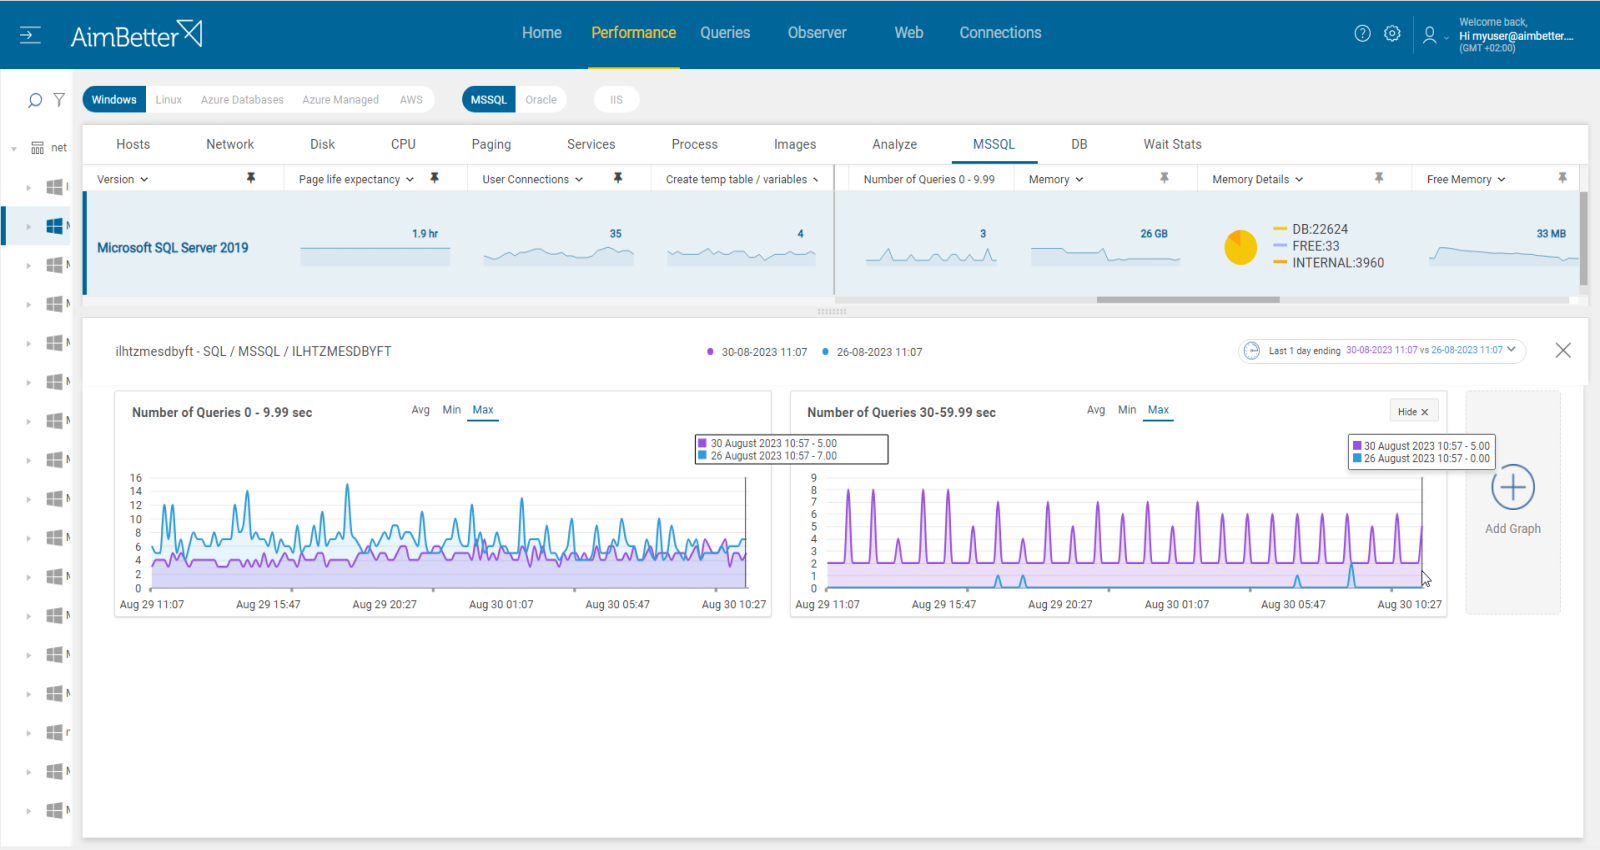
This alert provides data about queries running within a specific range of seconds. When there’s an increase in queries execution time (duration), these graphs give insight on that change over time with a general view of current performance.
It’s important to identify changes in the database servers’ operation efficiency for better or worse in time to take prompt action accordingly.
Various reasons can cause queries or updates to take longer than expected to execute. It may be related to performance problems related to the network or can also be caused by problems with the physical database design.
There might be situations when the queries’ duration did not increase but the overall server’s activity. It’s important to review the total performance of the server and decide whether this event doesn’t harm the server’s overall performance and, if so, what actions have to be taken.
Find out how you can save hours of work when investigating the root cause of this issue.
Symptoms :
Queries are running longer than expected, or users’ activity has increased, impacting the count of queries running for a specific duration.
Impact: Medium
Slow SQL responses will degrade the user experience, resulting in poor efficiency of your organization’s operations. When users’ activity increases, the impact depends on total server performance – whether it’s worse or regular.
Expected behavior :
There are no standard metrics for the length of SQL Query execution. For establishing the best benchmarks, queries should require about the same time to complete in both testing and production environments (assuming the same volume of data is processed).
If overall activity has increased, an increase in query execution length is acceptable as long as performance is not slower or worse.
Possible causes:
1- Queries are waiting for data that depends on locked resources. Priority: High
When multiple transactions are contending for resources, blocking situations can occur, causing delays in query execution and increasing the count of queries running for a specific period.
Blocking happens when another transaction has locked the table source and prevented this transaction from being committed since the table is already in use.
Problem identification:
You should identify the blocking queries currently and check if they caused increased queries duration time.
- Use tracking tools to identify blocking queries currently, such as SQL Server Profiler or Oracle Enterprise Manager. This task might be complicated since you have data about blocked queries but not blocking ones. You should search for data related to session ID, duration, wait type, wait resource, and the code of the affected queries.
- By comparing the blocking query and the affected queries, you can determine if the blocking query is causing delays or long execution times for the affected queries.
- Consider that there can be multiple layers of blocking or complex dependencies. Therefore, you might aim for a more comprehensive insight: analyze the transaction isolation levels, settings, and the overall database workload.
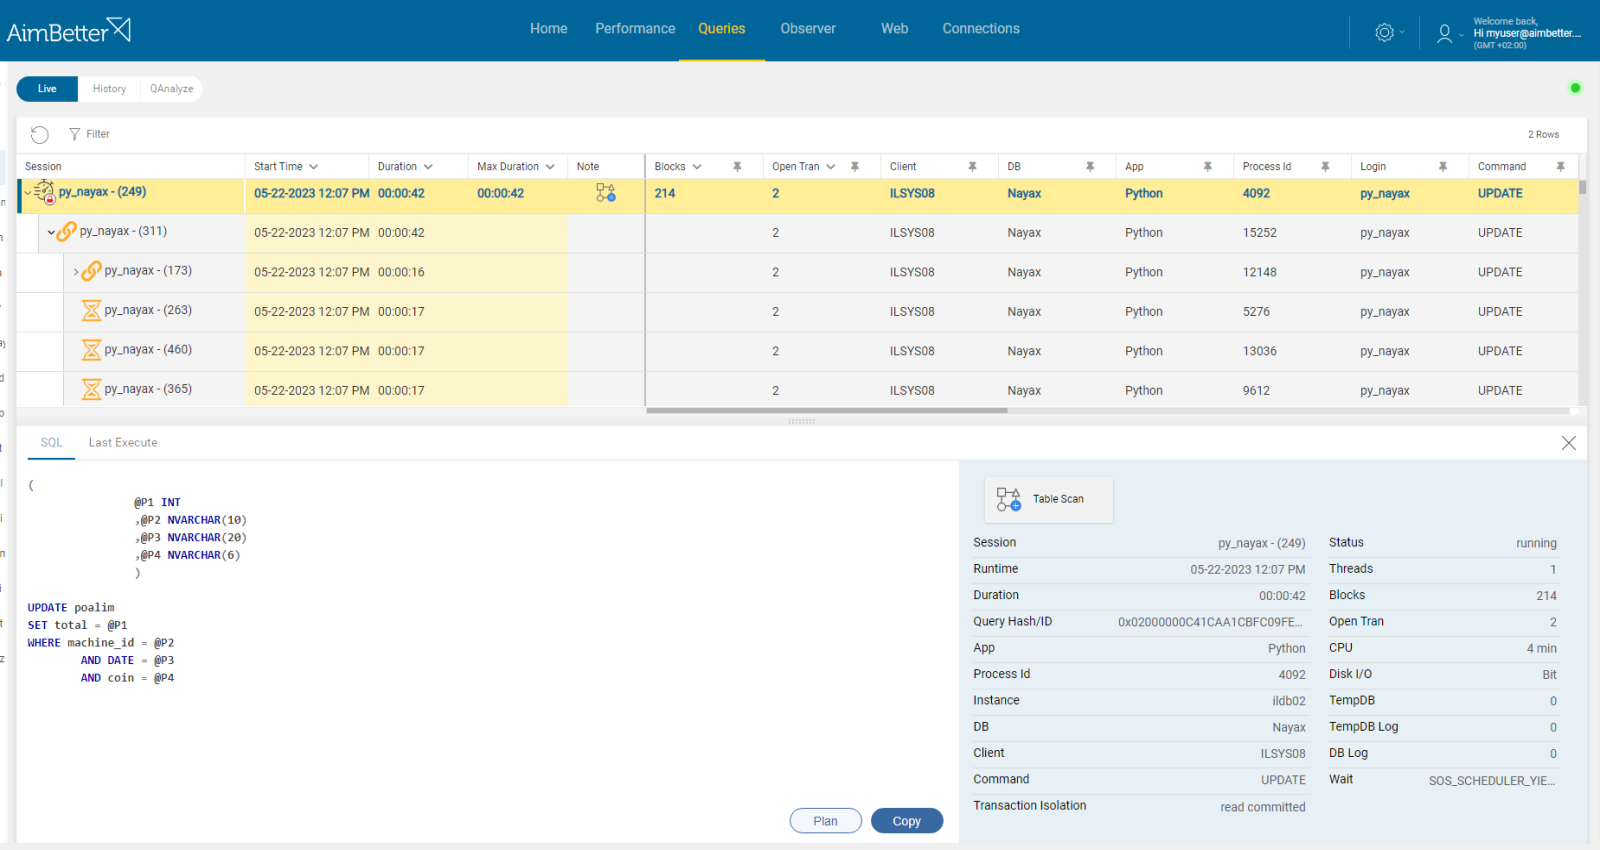
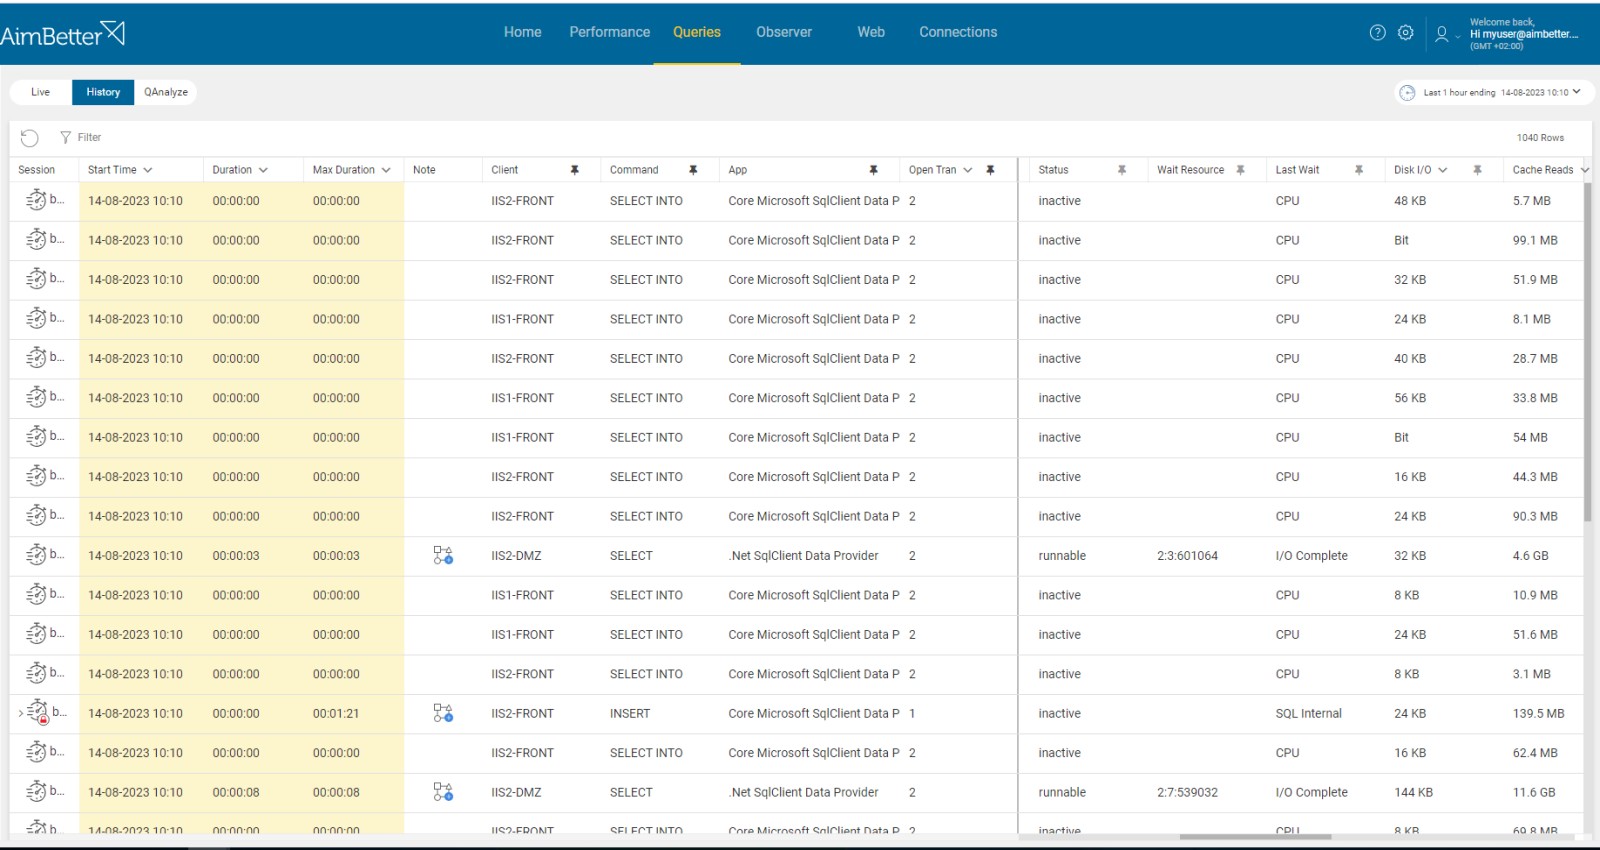
With AimBetter, all the blocking sessions are displayed in one panel, including all their details and all blocking layers.
You can select any period and narrow your search for a specific text, login, application, and more.
An alert will be applied if a blocking query happens parallel to an increased count of queries running longer.
Recommended action :
To resolve blockings, you may need to adjust the query design and execution plan, optimize indexing, implement correct isolation levels, tune queries, and change settings if required.
Where possible, use “WITH (NOLOCK)” in reading transactions. Reprioritize processes according to needs.
2- Overloaded hardware resources. Priority: High
Overloaded server resources such as CPU, memory, disk I/O, or network can slow down query execution. As a result, it might cause queries count of specific duration time ranges to increase.
Problem identification:
Check if CPU, memory, disk I/O, or network resources are highly utilized. Identify the source of the load, if it is recurrent, and if queries count running more than a specific duration time has increased.
- Check the Task Manager to identify the overload of hardware resources.
- Use OS tracking tools such as Performance Monitor to identify which processes use hardware resources. Use a network monitoring tool for network activity to check how much traffic flows through your network and which applications or devices use the most bandwidth. Consider that most tools help pinpoint when a problem starts, which you can’t compare to previous time frames.
- Check which hardware resource is more utilized than others while queries are running. For that, you should be using tracing tools such as SQL Server Profiler or Oracle Enterprise Manager. This step might be completed and take time, and the result probably won’t be precise while checking only online statuses.
- When the overload stops, track the queries’ duration time of the lower-resources demand period and compare this result to what you have traced while the overload exists.
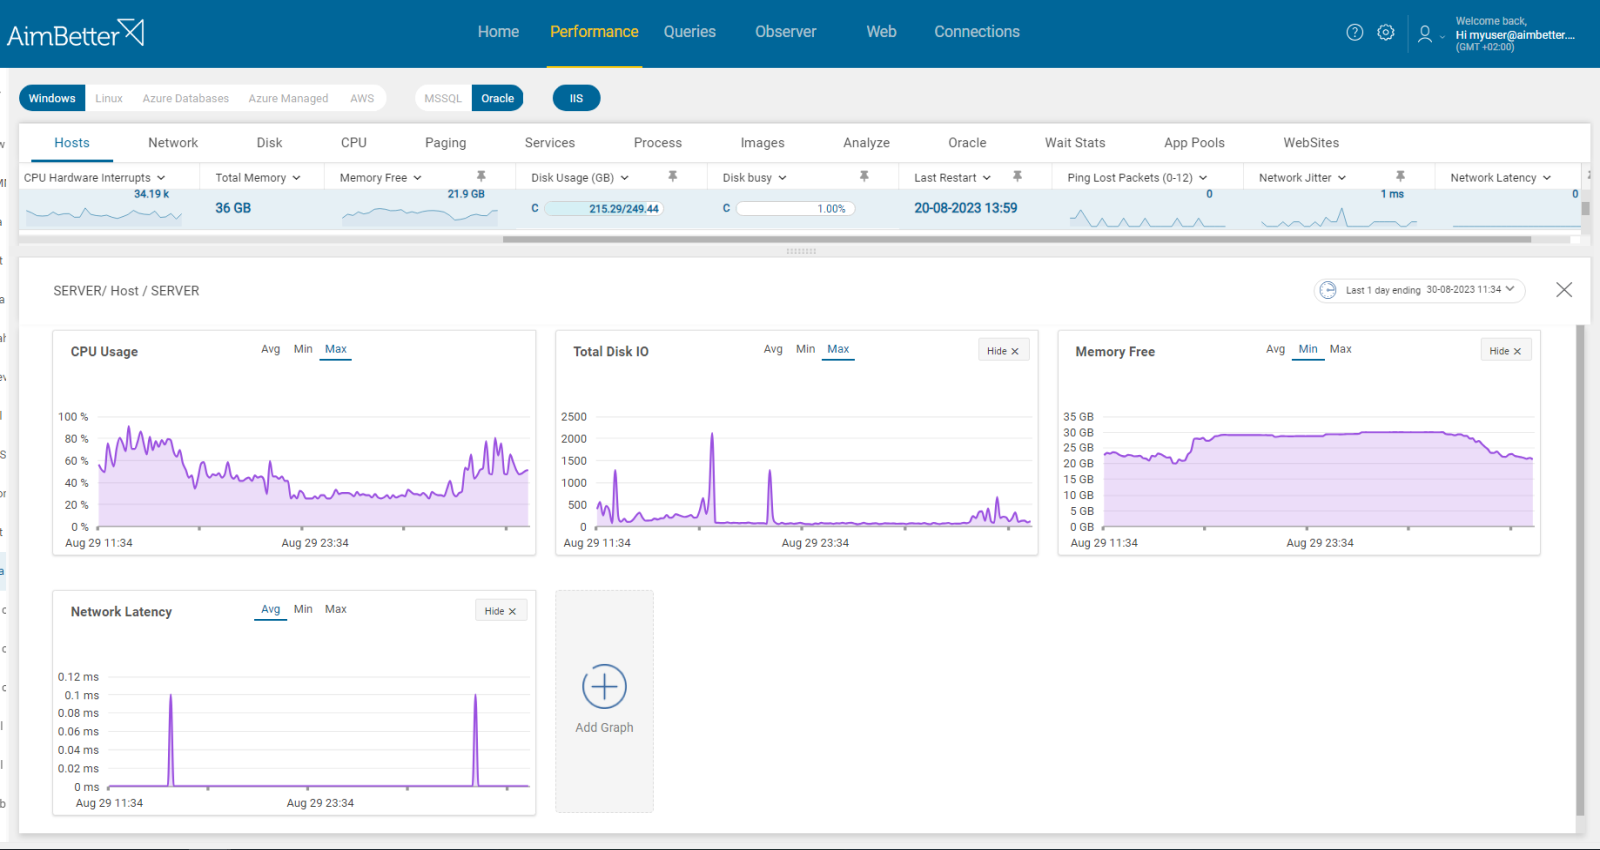
If there is an issue with any hardware resource, AimBetter will immediately alert you about it.
Comparing time frames is easy when working with a single panel, which allows you to view several metrics at once, checking query details, count of queries running for a specific period, and utilization of resources.
Recommended action :
Reschedule non-essential activity (e.g., virus scans, backup, etc.) to hours of lowest database demand where possible.
Consider upgrading hardware if possible.
Check queries execution plan to make sure that it’s optimal.
3- The execution plan was changed for the worse. Priority: Medium
Execution plans provide valuable insights into how the queries are being processed and help to identify areas where inefficiencies exist.
Queries that are with inefficient query execution plans can lead to poor performance, inefficient data access, and increased resource usage. This can include missing or outdated statistics, inappropriate use of joins or subqueries, unnecessary sorting or grouping, or inefficient use of functions. When that happens, queries whose execution plan is worse would probably run longer.
Problem identification:
Identify queries with non-optimal execution plans in parallel to finding out queries running longer.
- Track the database server activity: identify which queries have high execution time and count them. For SQL Server, you can use the built-in activity monitors or SQL Profiler. For Oracle, you can use Dynamic System Views or OME (Oracle Enterprise Manager). This mission might be complicated and take hours or days of work, requiring a highly skilled DBA.
- Investigate the query code and execution plan, trying to look for execution plans that are not optimal, for example- having missing indexes or excess subqueries. To get this data, you have to run the query live from the management studio again, which might increase the overload and investigation time of this issue.
- Examine index usage and fragmentation: Evaluate the use and fragmentation of indexes in the database. Unused or fragmented indexes can impact query performance.
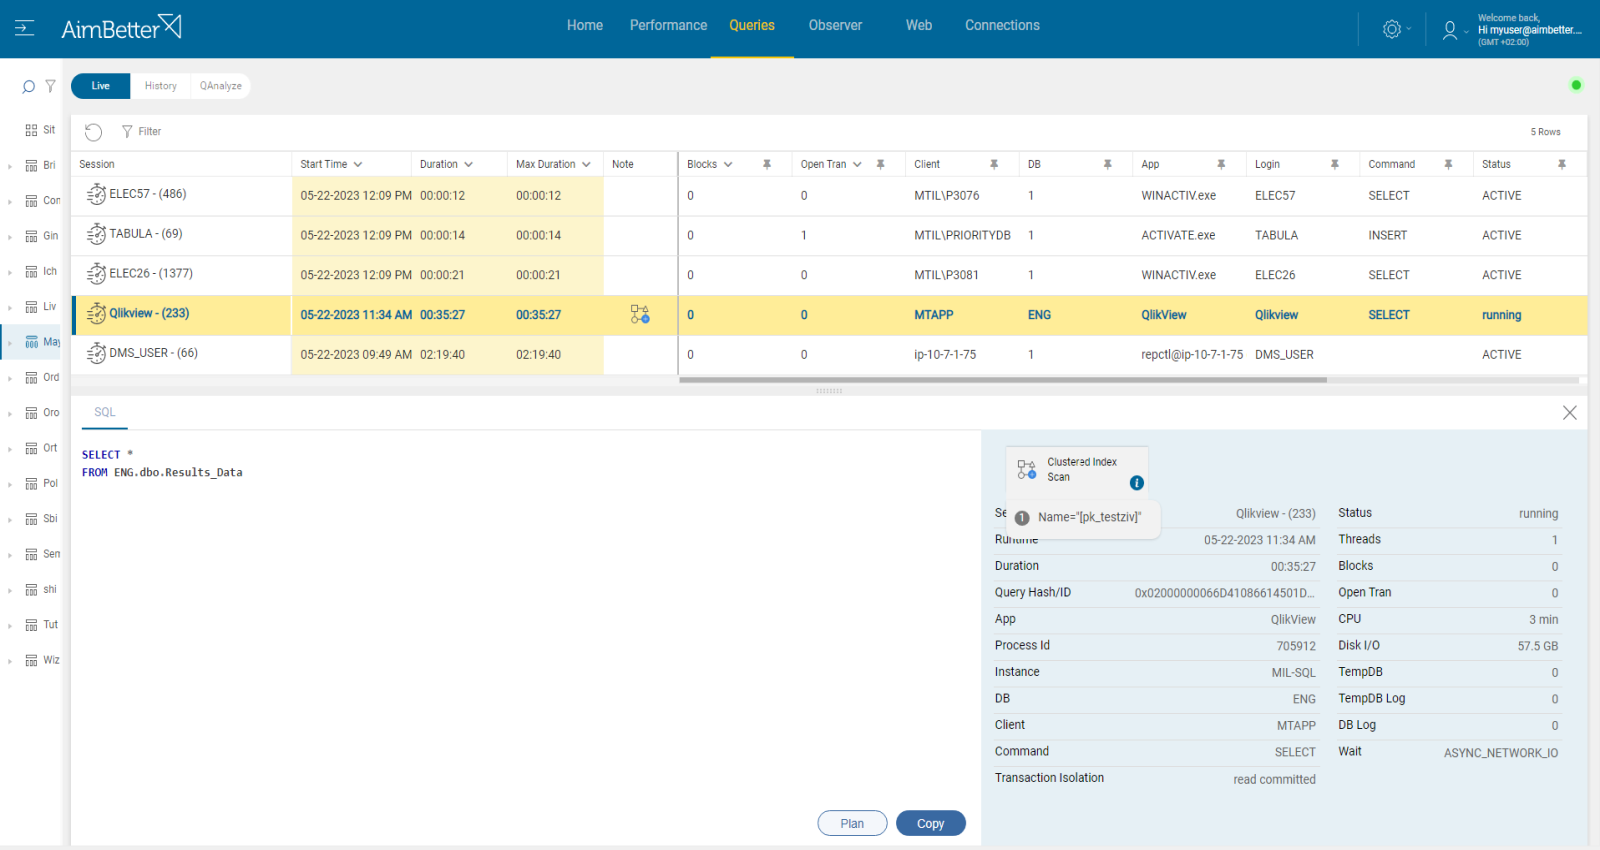
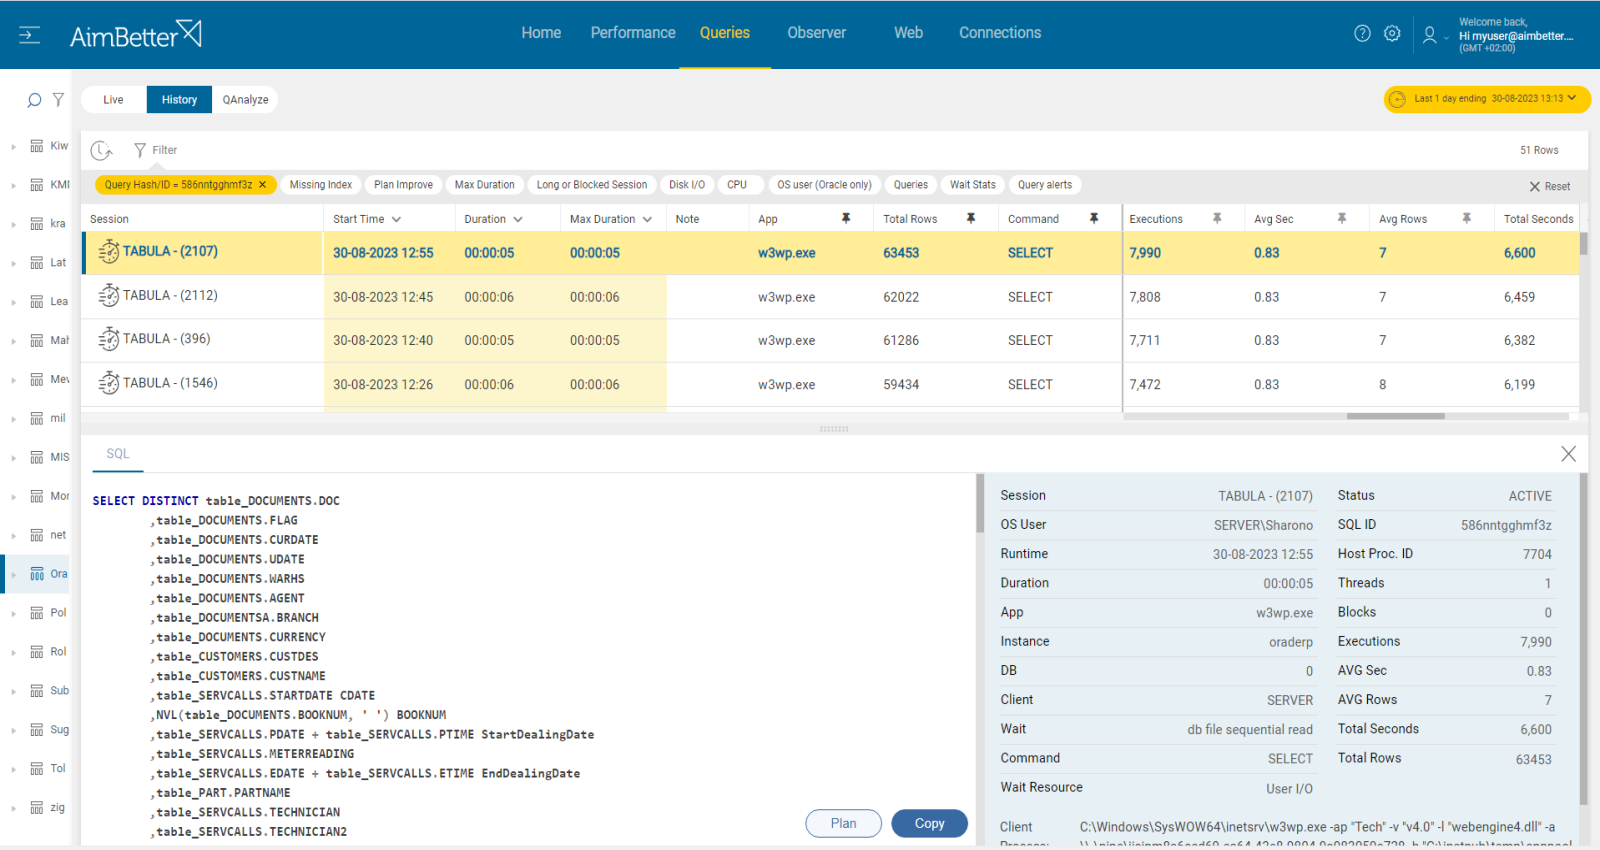
With AimBetter, all running queries at the moment can be viewed from a single screen, and you can filter and sort the queries by execution time or resource utilization or even search for a specific query text.
Queries execution plan and missing indexes are available immediately, even while the queries are running live! There is no need to waste time waiting or running them again, including notes showing improvement recommendations.

Recommended action :
Investigate the execution plans, look for bottlenecks, and try to optimize accordingly.
You should consult a DBA who understands the data model before making these changes.
-Look for functions over fields that can be tuned or avoided to improve performance.
-Make sure you use proper indexes; add or delete indexes if necessary.
-Minimize the number of fields and records in the result sets as much as possible so that they would only return what is needed and nothing more.
-Break complex queries into more simple steps, and make sure to use proper filtering, WHERE clauses, and JOIN operations.
4- Environment changes affect performance badly. Priority: Medium
Inadequate database design can result in inefficient queries.
Before implementing changes, you must ensure the instance’s future design fits the business flow and application requirements.
.
Problem identification:
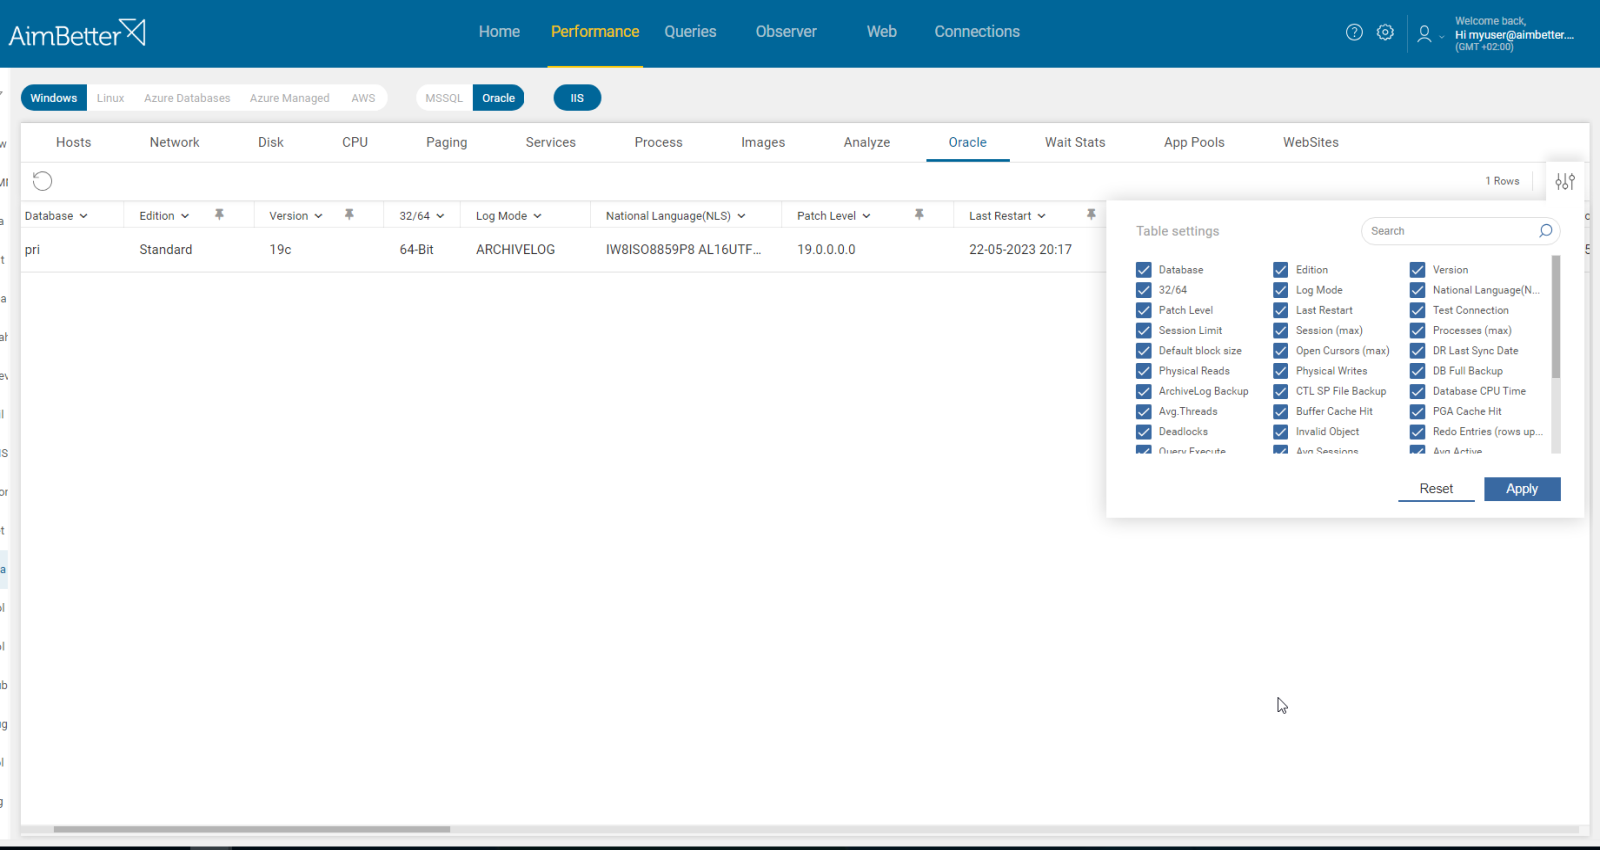
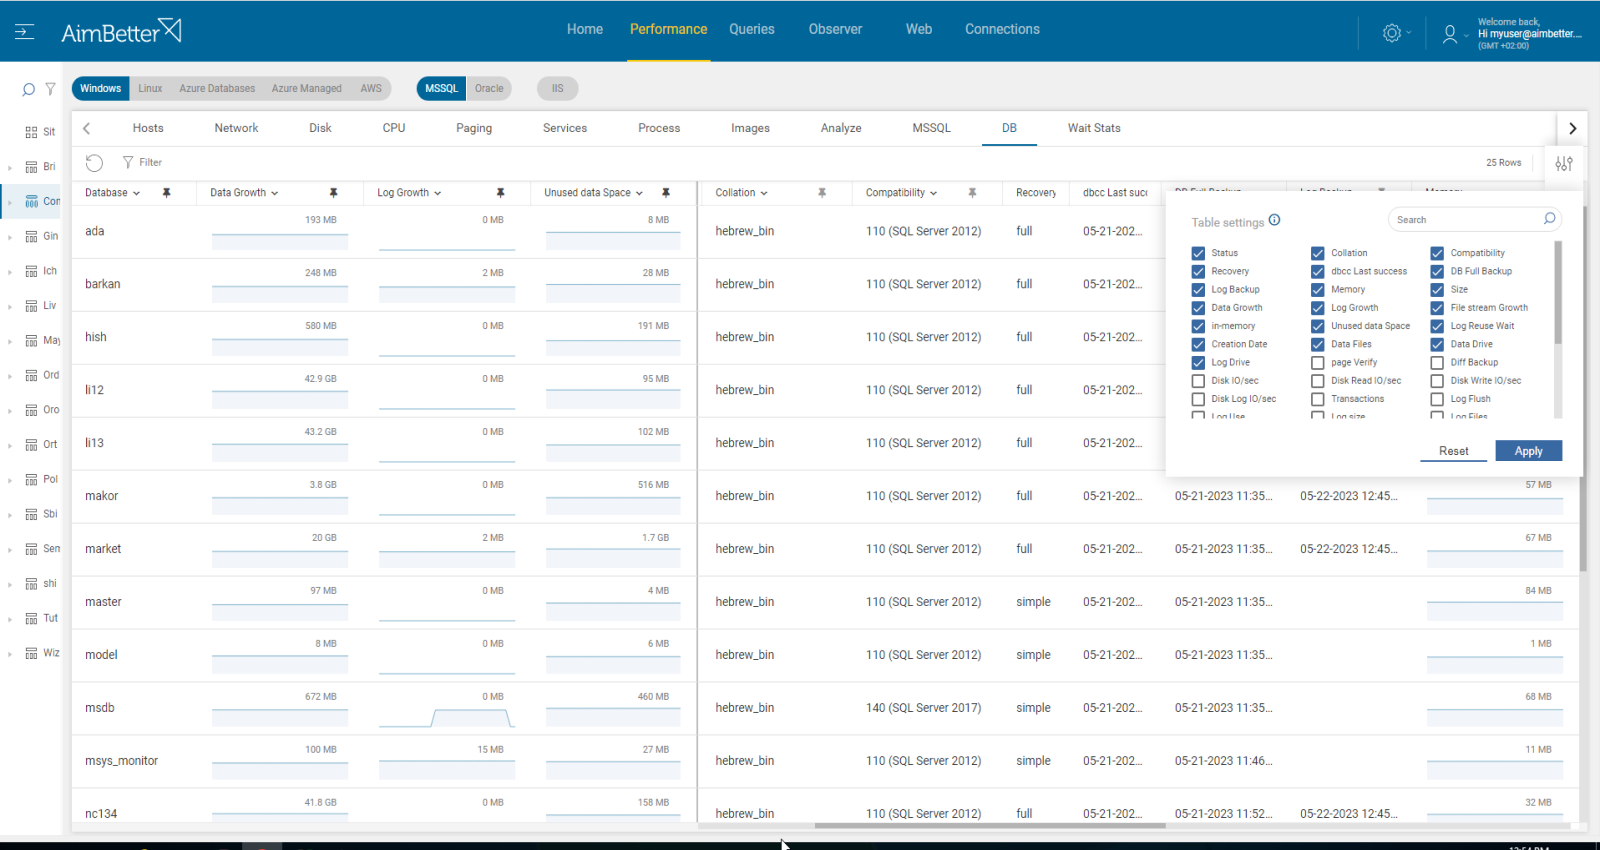
Analyze the query’s performance, look for queries that consistently take longer to execute, and identify which instance and databases it originates from. Once you are sure the reason is not an inefficient query execution plan or insufficient resources, you should check instance and database settings.
- Identify which queries have a high execution time. You can use the built-in activity monitors or SQL Profiler for SQL Server or Dynamic System views for Oracle. Identify the database and instance from which the query is running.
- Check the database settings to see if they have changed recently. For example, data and log file settings and division, backup type, compatibility, and more. This must be done with a professional DBA who knows the structure of the instance.
- Don’t forget to look for statistics and daily tasks to improve the functionality of the databases. For server settings, ensure that the infrastructure fits the best working mode.
Recommended action :
Change the settings of the database, instance, or host if needed. You should work with a professional and track these changes with proper monitoring tools. Next time, it should be done before implementing sudden changes.
Ensure that the server is appropriately sized and configured based on the workload demands.
5- Increased row count. Priority: Medium
When the table has increased row count, it might affect the performance of queries accessing it and cause longer running times. When using many processing steps such as filter, sort, group, join, and more, an increase in the row count will cause the queries’ operations to take longer.
Increased row count, if significant, can also impact increased I/O operations and resource usage.
Problem identification:
Utilize the query’s execution plan to identify large numbers of rows being processed, such as full table scans on tables with a high row count. While doing so, check the utilization of resources done by the queries.
- Track the database server activity to identify long-running queries. Out of it, identify queries with higher utilization of resources. For that, You can use SQL Profiler or Oracle Enterprise Manager.
- Get in hand the problematic queries’ execution plan. Analyze the execution plan to identify full table scans, index scans, and joins.
- For Oracle, you can use Oracle System Dynamic Views to get information about executed queries and their execution plans. Look for queries with high execution counts.

Recommended action :
Make sure that database statistics are up-to-date and tune queries’ performance. Once at a time, query mostly-utilized tables looking for unnecessary rows to free some table space by deleting processes.
6- Increased users’ activity. Priority: High
A sudden surge in application usage might cause an increase in user connections since more users are accessing the database instance.
It might be at a specific time in the month, for example, during holidays or sales periods for store- companies or more requests for support companies.
Problem identification:
Check for increased user connection numbers in parallel to increased duration time of queries and check both the applications identified in the sessions.
- Connect to the SQL Server Management Studio (SSMS) and navigate to the Activity Monitor. This provides online information about user connections, yet you don’t have history data to compare with to decide what is the source of the increased activity.
- Track the database server activity: identify which queries have high execution time and count them. You can use the built-in activity monitors or SQL Profiler for SQL Server. For Oracle, you can use Dynamic System Views or OME (Oracle Enterprise Manager). This mission might be complicated and take hours or days of work, requiring a highly skilled DBA.
- Query SQL Engine system views to identify repeated patterns of many connections originating from the same application. However, you don’t have history data here, and you should monitor this issue manually.
- You should track this issue again to characterize the routine behavior of connections and queries duration in your environment. You must provide insight into the routine duration of queries and if there are actually more queries running for increased duration time.
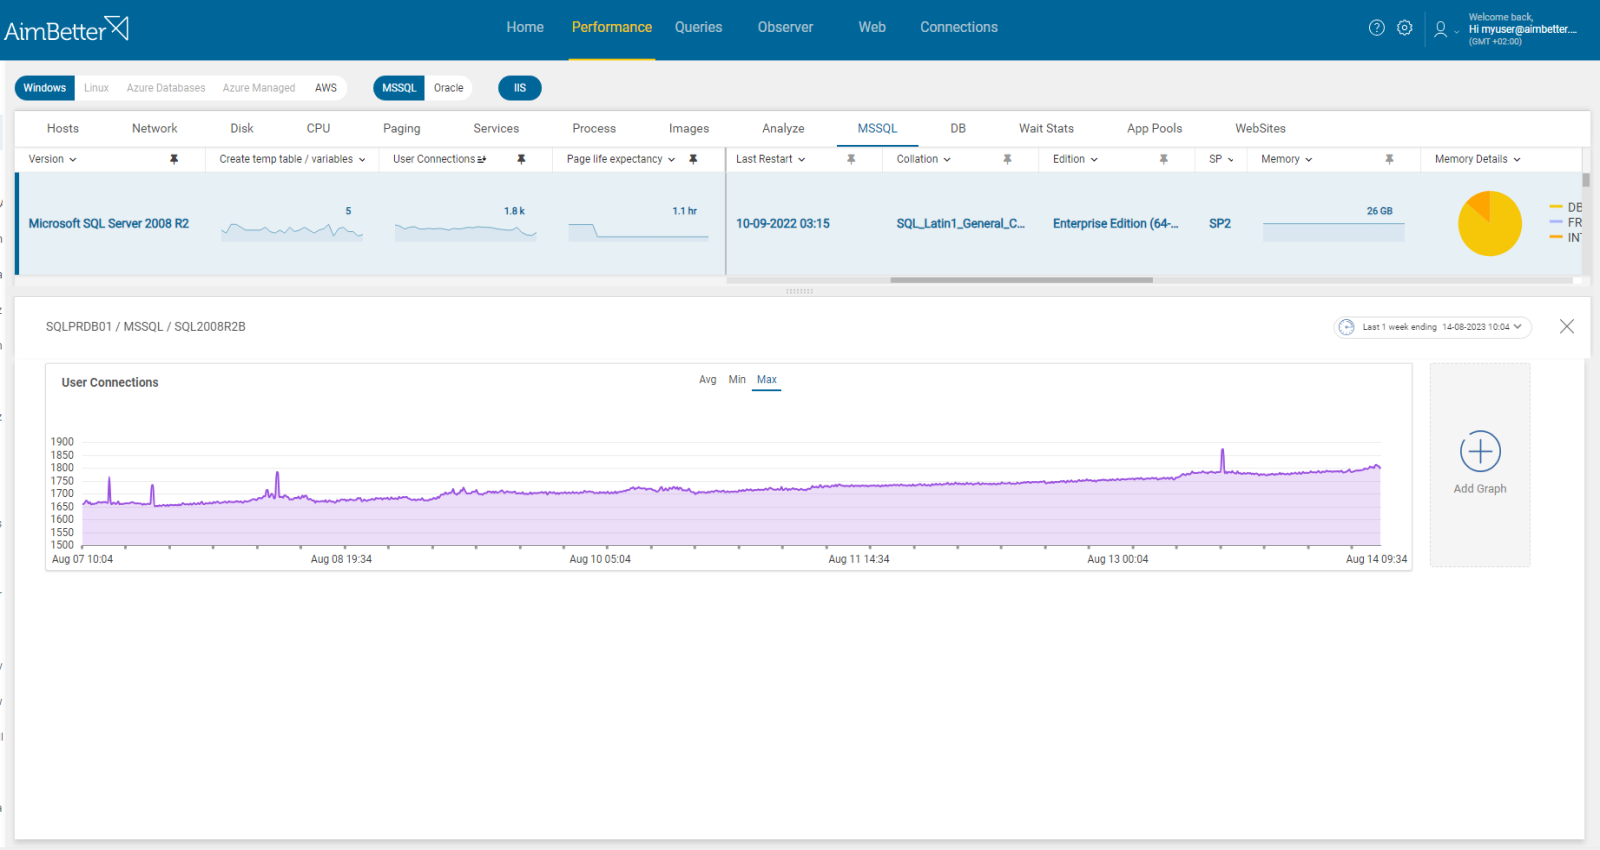
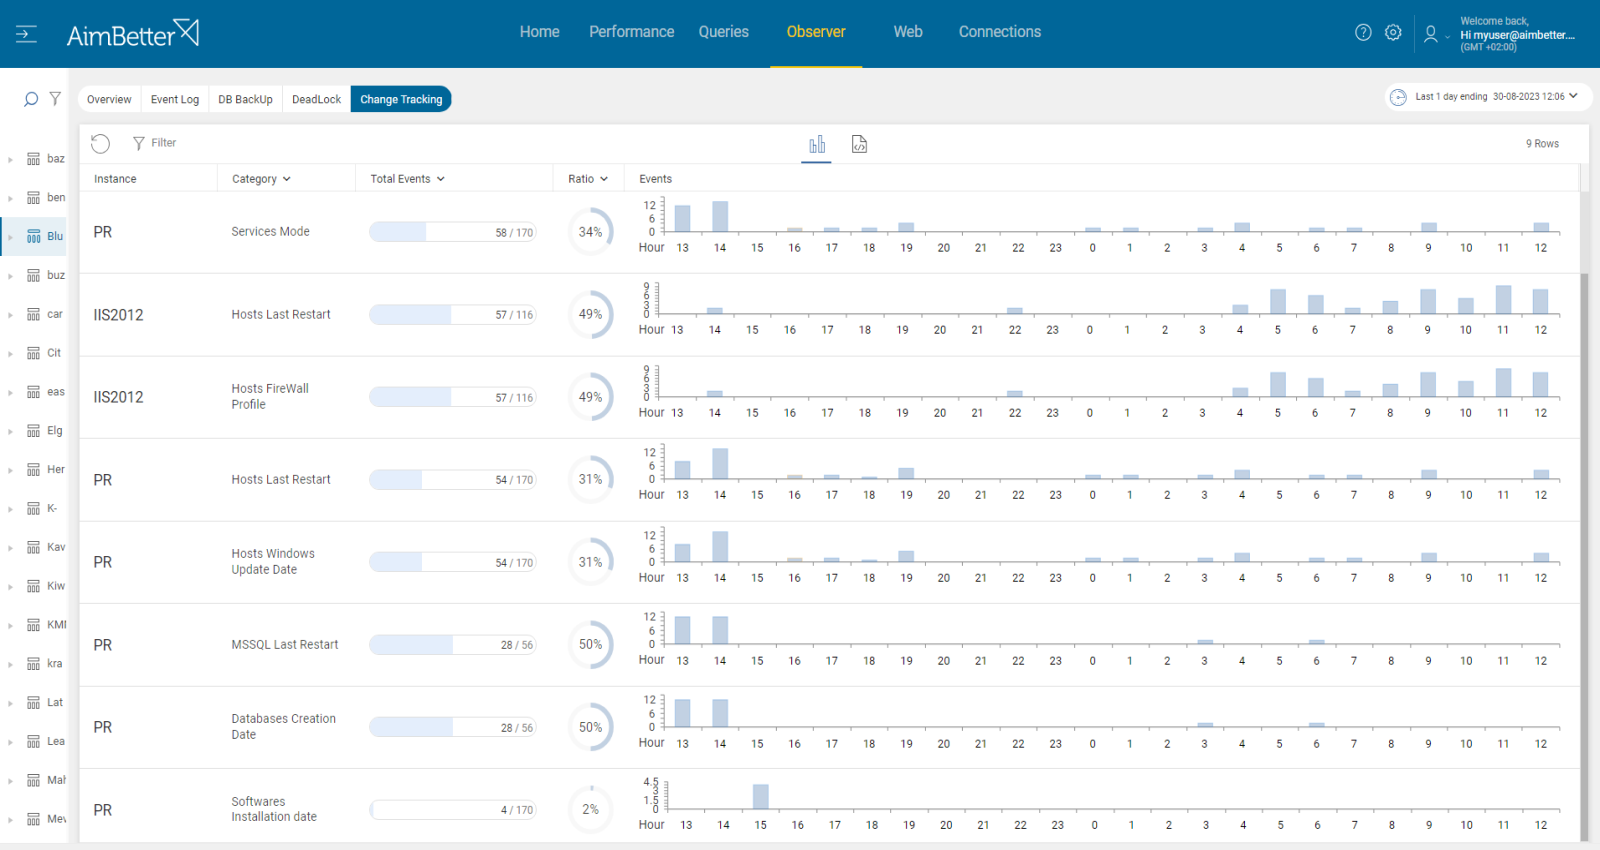
AimBetter makes it easy to follow up on historical behavior with one month of data available in a user-friendly environment. You can compare between different periods.
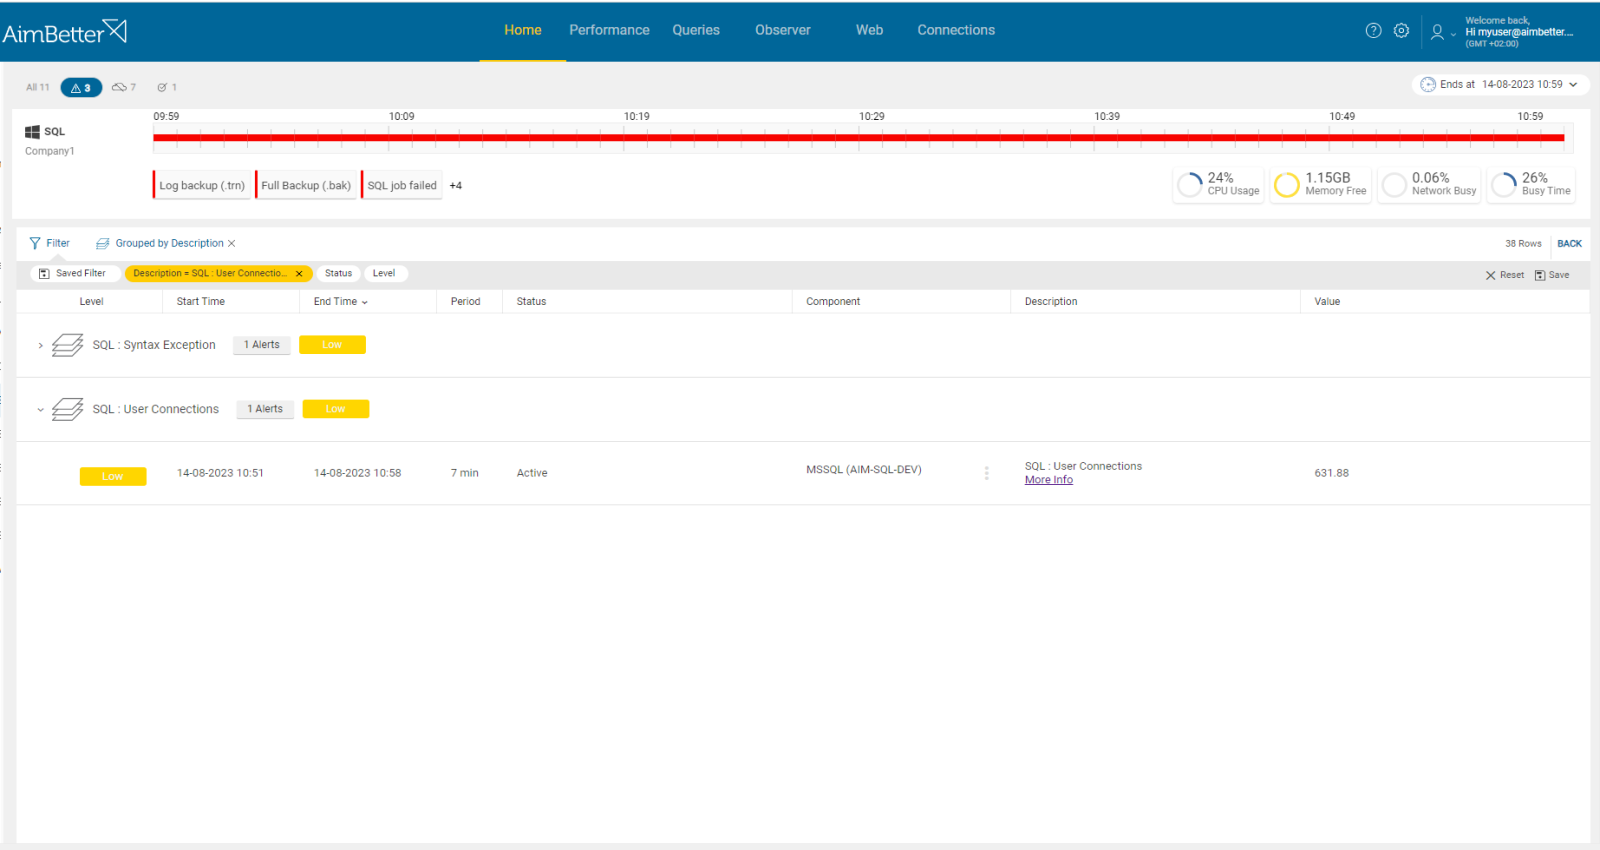
You will receive a notification once there’s an increase in user connections, and you can filter by suspicious application name if it’s the source for increased activity.
Recommended action :
Ensure the application’s connections are adequately managed and closed and set appropriate time outs. Check if the overall server performance is worse – if queries are running longer than before, if it’s just the queries count increasing, or if CPU, memory, disk, and network are overloaded.


