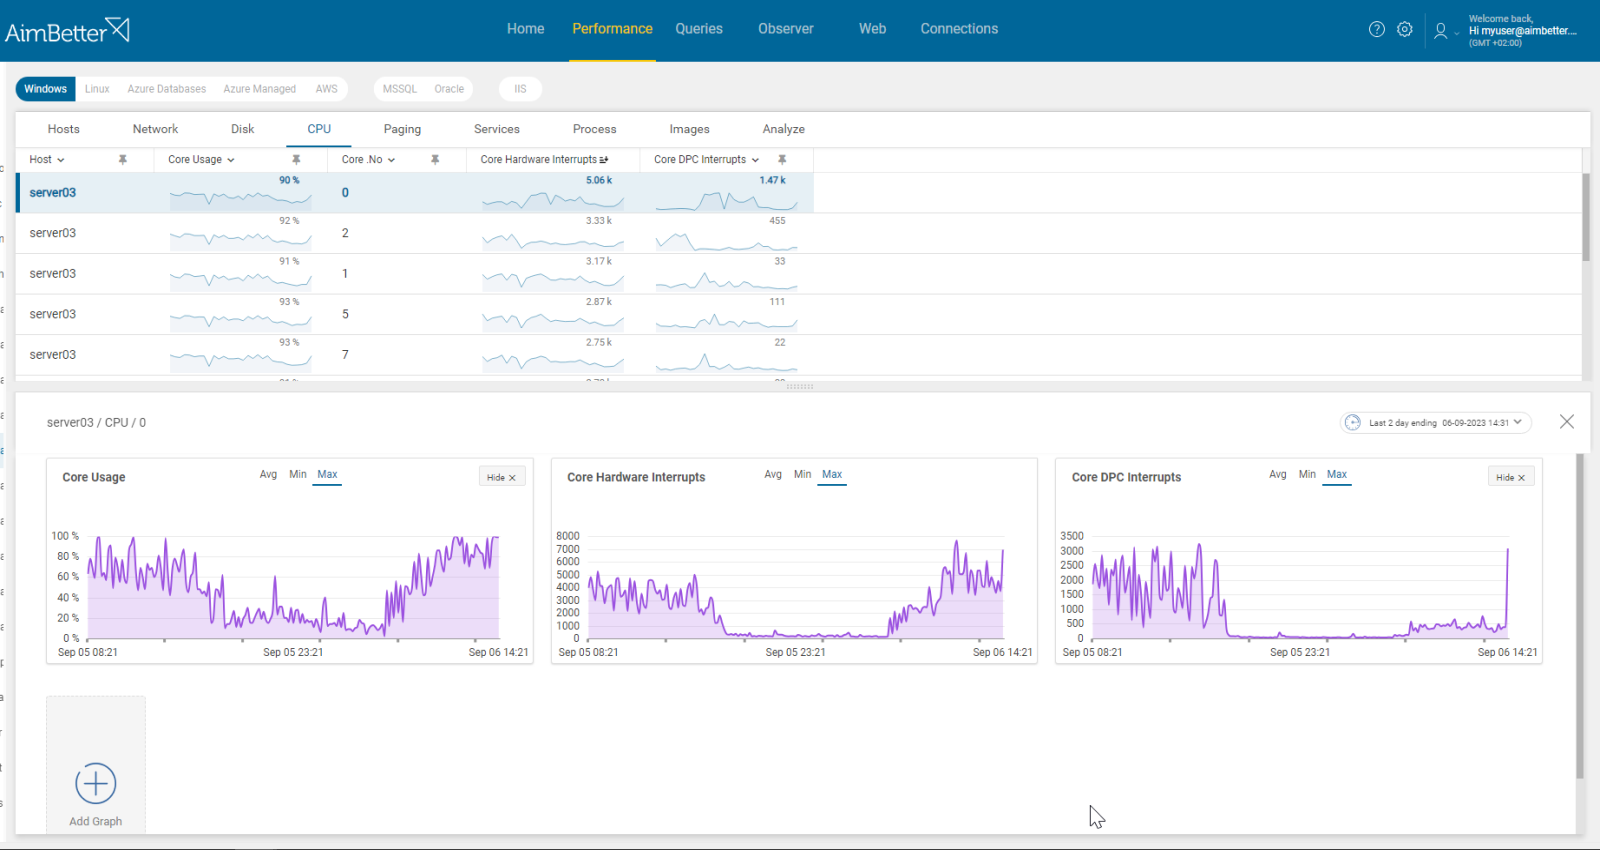
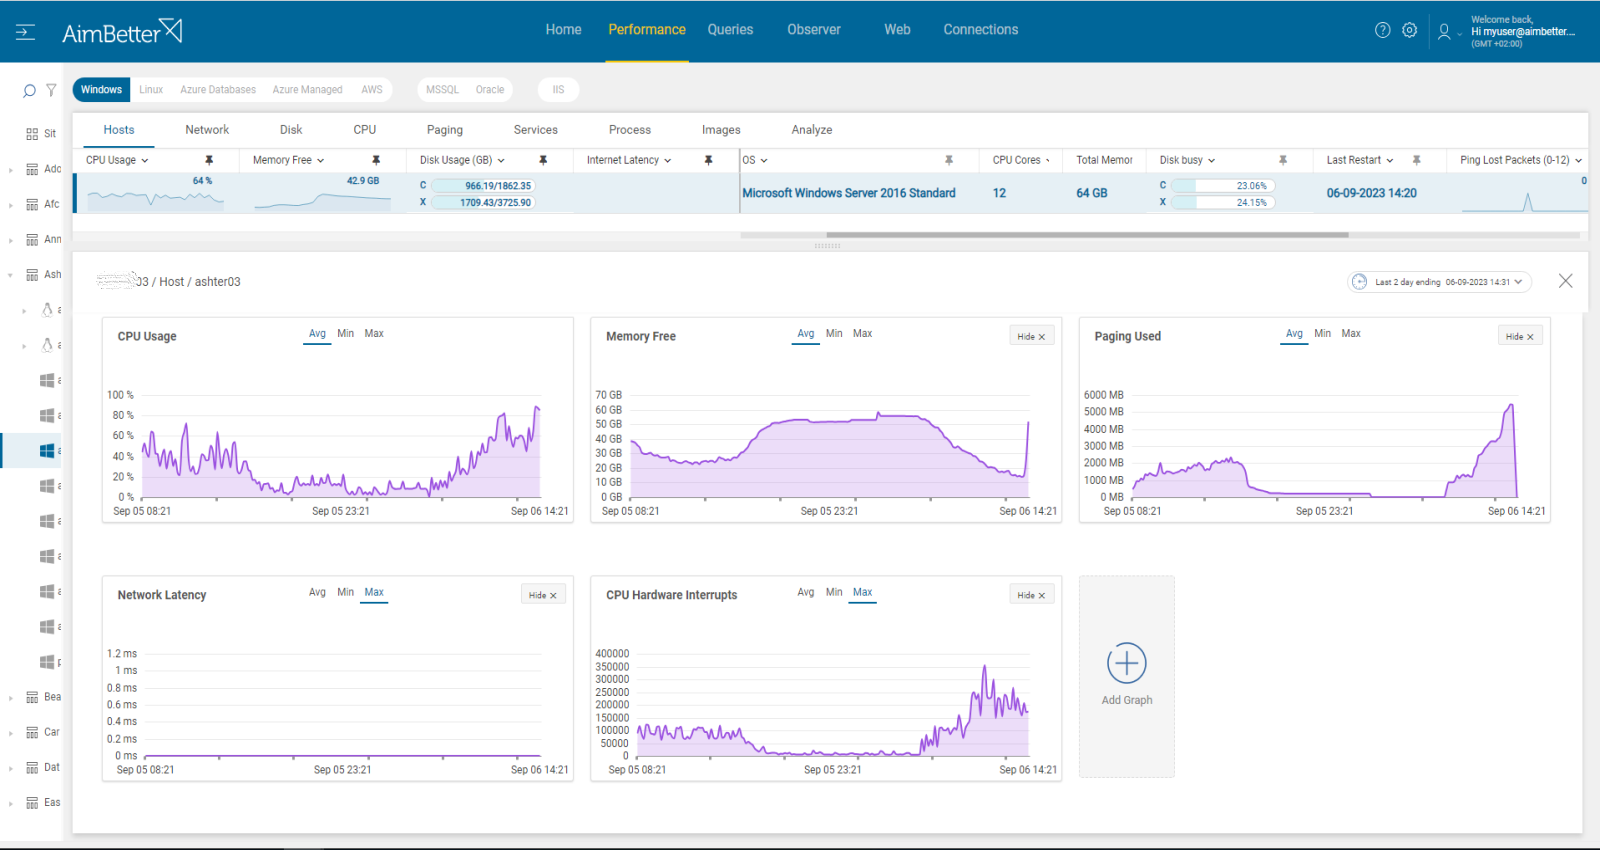
CPU hardware interrupts indicate that the CPU receives external signals that should be handled promptly. The signals might be from any OS external device such as disk IO, network, memory, or page file.
System interrupts appear as Windows processes, and they communicate to the CPU that their input must be processed with high priority. It allows the CPU to respond to external events without wasting processing resources.
The handling process includes several steps, beginning with the increase in hardware interrupts promptingthe execution control to interrupt the service routine (ISR). The ISR responds to interrupts and performs the tasks, communicating the system upon their completion. As a result, the hardware interrupt count is restored to the previous state. There may be slight differences in this process depending on the server’s interrupt controller of each environment.
Hardware interrupts are part of a computer’s operating system operation, and their occurrence is normal. However, when hardware interrupts are higher than expected, there may be a hardware issue that must be investigated.
Find out how you can save hours of work when investigating the root cause of this issue.
Symptoms :
The operating system response is slow due to a high number of hardware interrupt occurrences.
Impact: Critical
An interrupt alerts the CPU to a high-priority condition requiring the interruption of the current code execution. The processor responds by suspending its current activities, saving its state, and executing a function called an “interrupt handler” to deal with the event.
This process might harm the business flow by delaying tasks that should be handled currently.
Expected behavior :
This metric expected behavior varies between systems. It’s based on your system’s specific needs and performance goals, depending on the CPU frequency, running software, and attached hardware, and not impacting OS response time. This metric matters if the hardware interrupt value is higher than usual and degrades the server’s performance.
Possible causes of high process CPU load
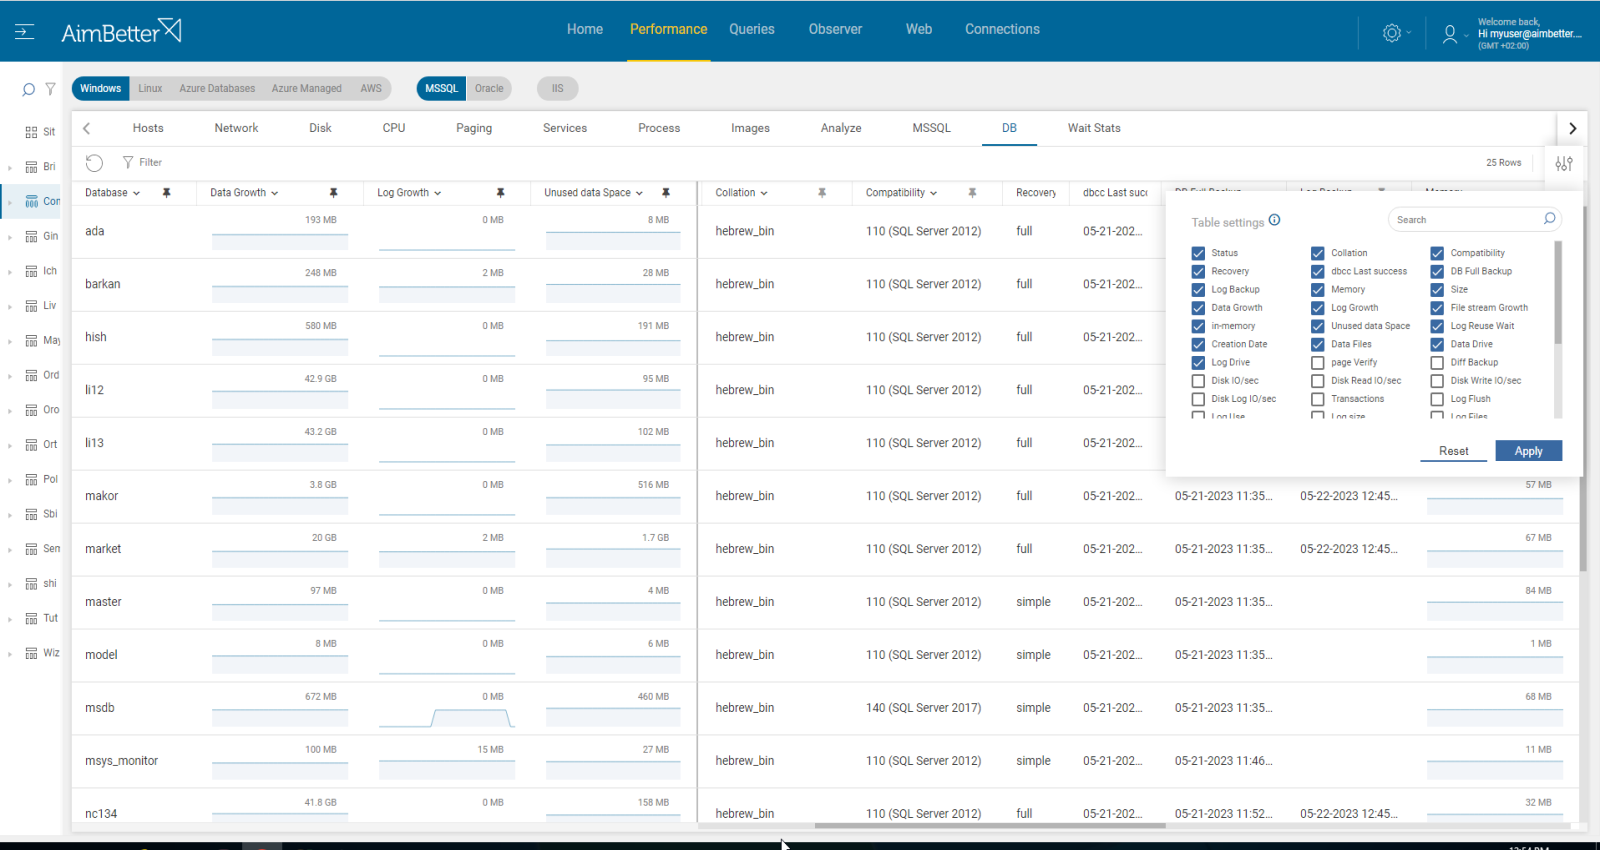
1- Disk IO/ Network/ Memory utilization Priority: High
One or more critical processes, together with high CPU usage, require high Disk IO, network, and/or Memory utilization.
Higher utilization of the server’s resources might happen for many reasons, such as higher application activity in which many processes are running at the same time or specific processes that consume hardware resources extensively. Otherwise, external operations such as anti-virus scans, backups, and restores can also cause overload.
Problem identification:
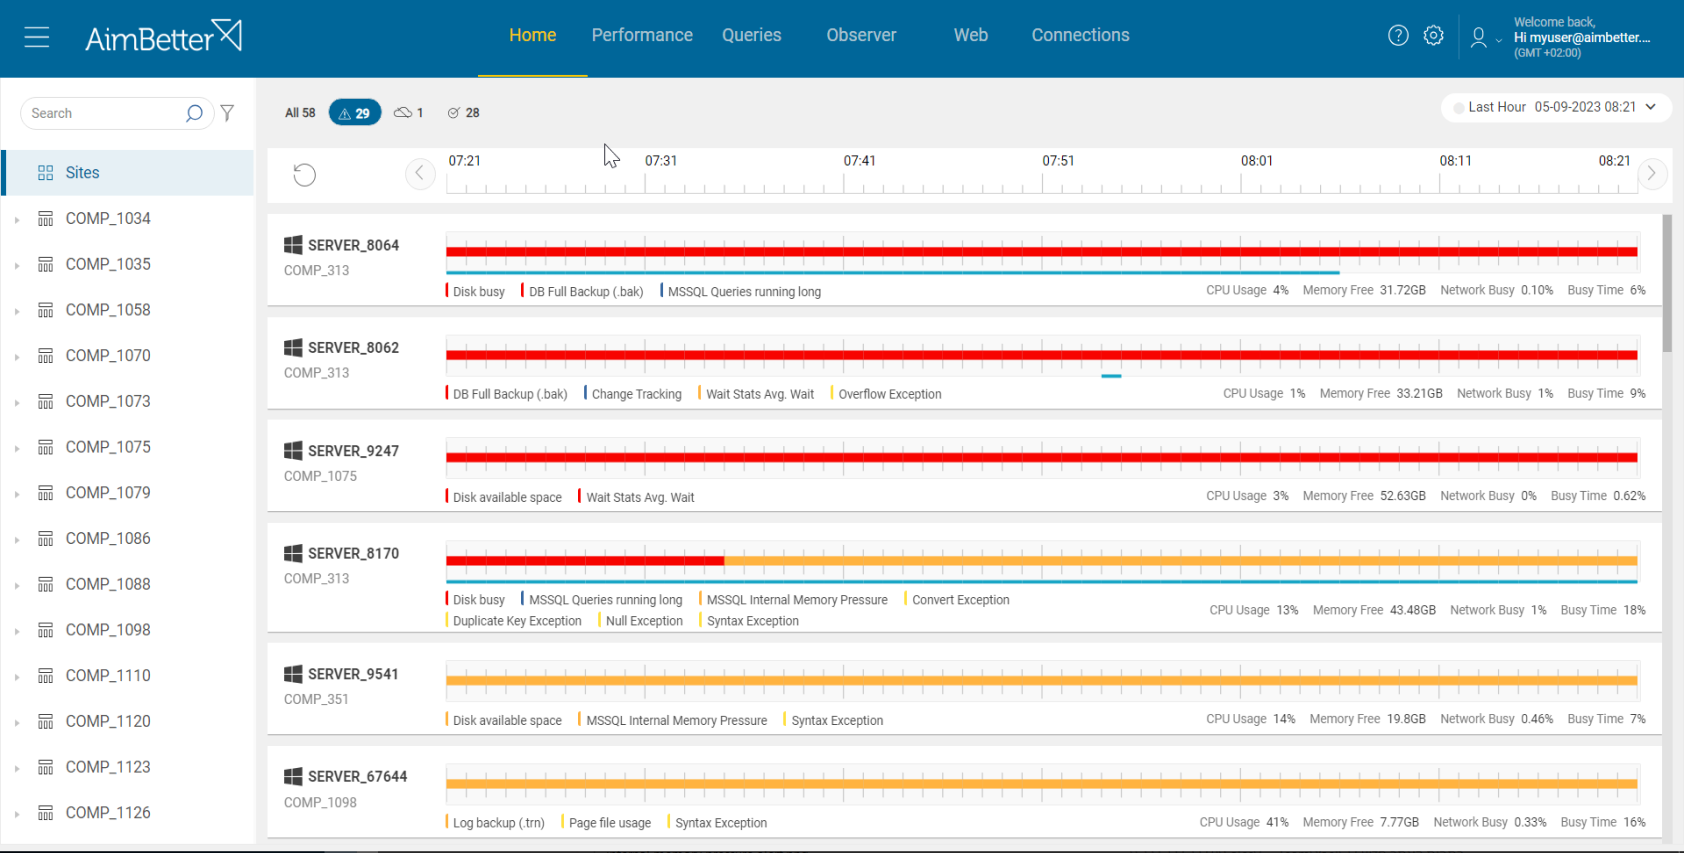
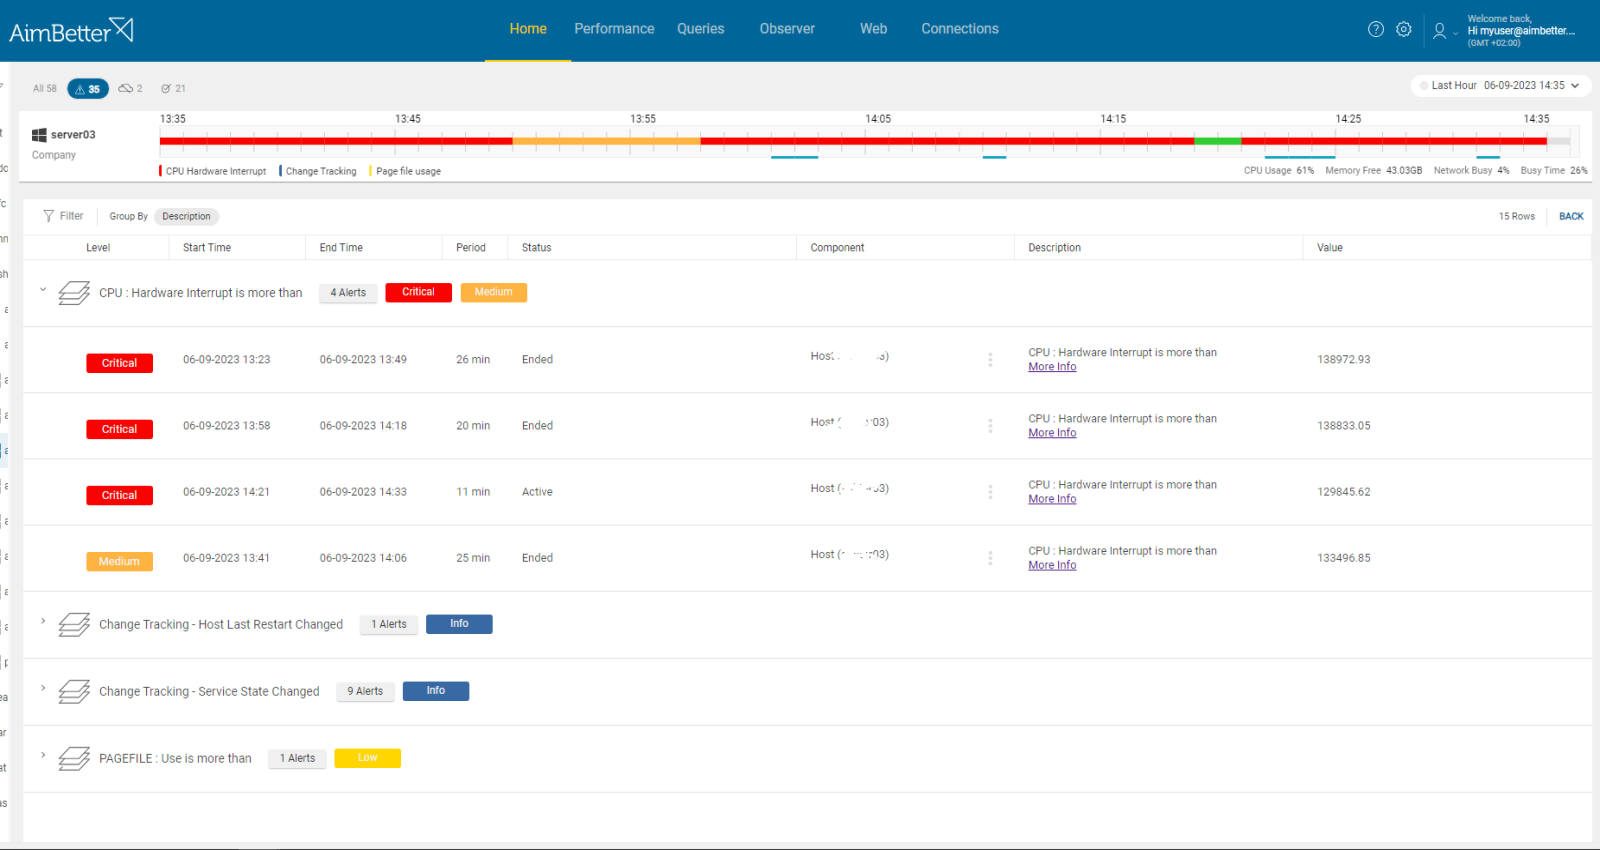
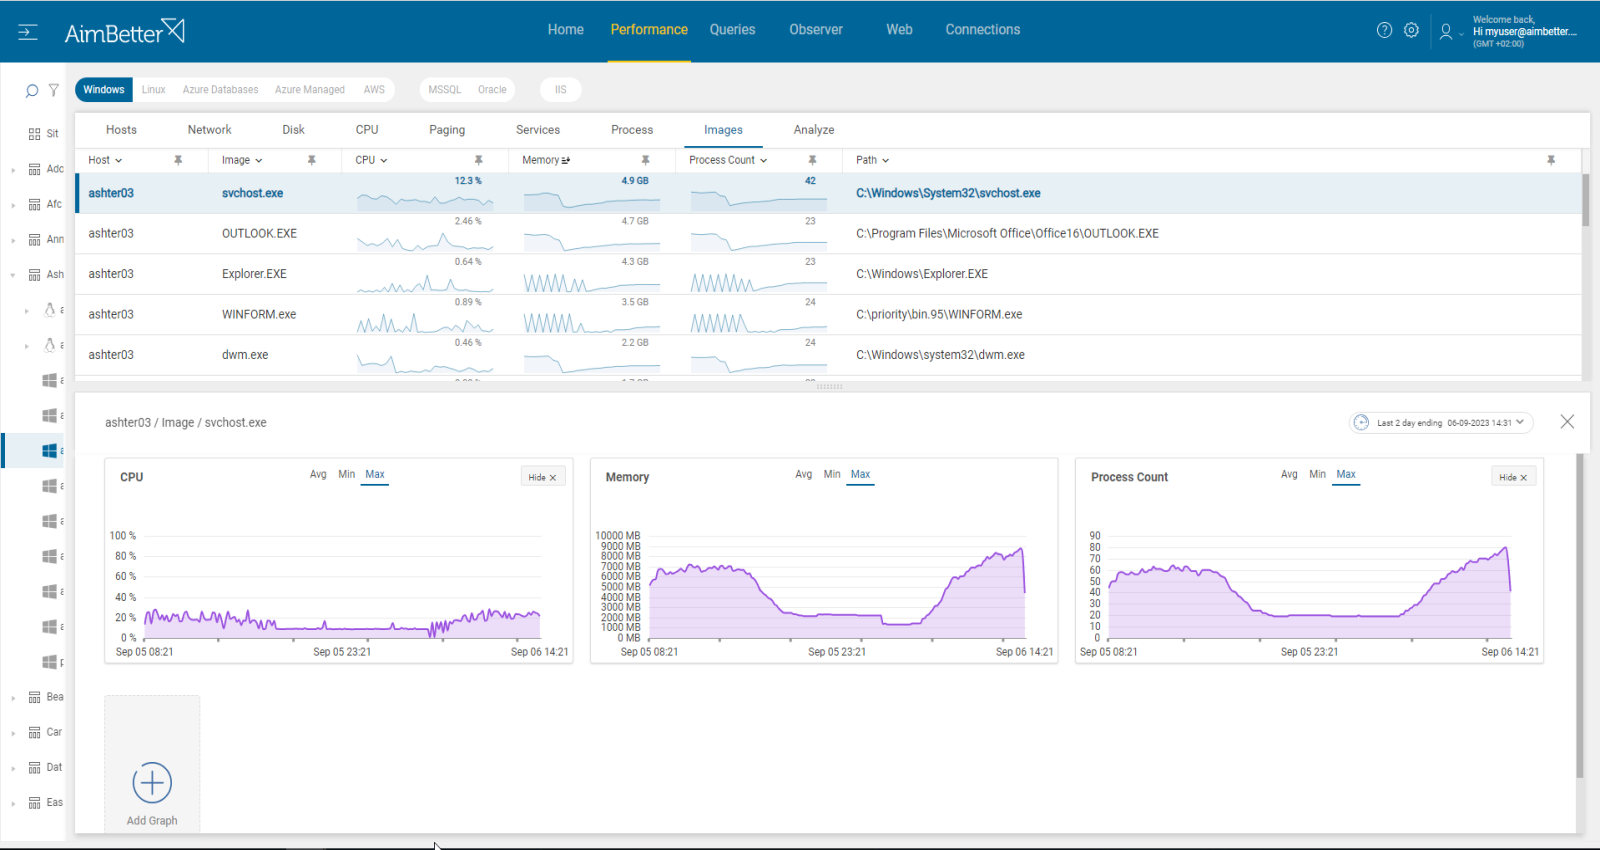
Check if CPU, memory, disk I/O, or network resources are highly utilized. Identify if it is recurrent and happens in parallel to peaks in hardware interrupts.
- Check the Task Manager to identify the overload of hardware resources. You can also try to track hardware interrupts here: go to the Resource Monitor, click on the “CPU” tab, and look for the “Interrupts” process listed in the section of “Processes with Disk Activity.” Remember that you only get live data, so you will have to track this issue manually.
- Use OS tracking tools such as Performance Monitor in order to identify which processes use hardware resources. You can also track hardware interrupts when using this tool. For network activity, use a network monitoring tool and check how much traffic flows through your network and which applications or devices use the most bandwidth. Take into account that most tools help pinpoint when a problem starts, with which you can’t compare to old time frames.
- Compare the higher activity of OS resources and the increase in CPU Hardware interrupts if they occur at the same time.
Recommended action :
Close unnecessary programs that cause high hardware utilization. If possible, reschedule non-essential activity (e.g., virus scans, backup, etc.) to hours of lowest SQL demand.
In cases when higher activity is part of the current business flow, upgrading the hardware to match the instance operation requirements—for example, additional cores or disks—is justified.
Monitoring is useful in following up on this issue and preventing situations when OS resources are overloaded.
2- Higher database activity with unfit settings to the host environment. Priority: High
In database engine environments, OS resources, including cache, storage, and network, are needed. When the database activity is higher than usual, database transaction management for these resources can lead to a significant number of hardware interrupts.
This type of increased activity might involve a lack of alignment between the database engine and hardware settings.
Problem identification:
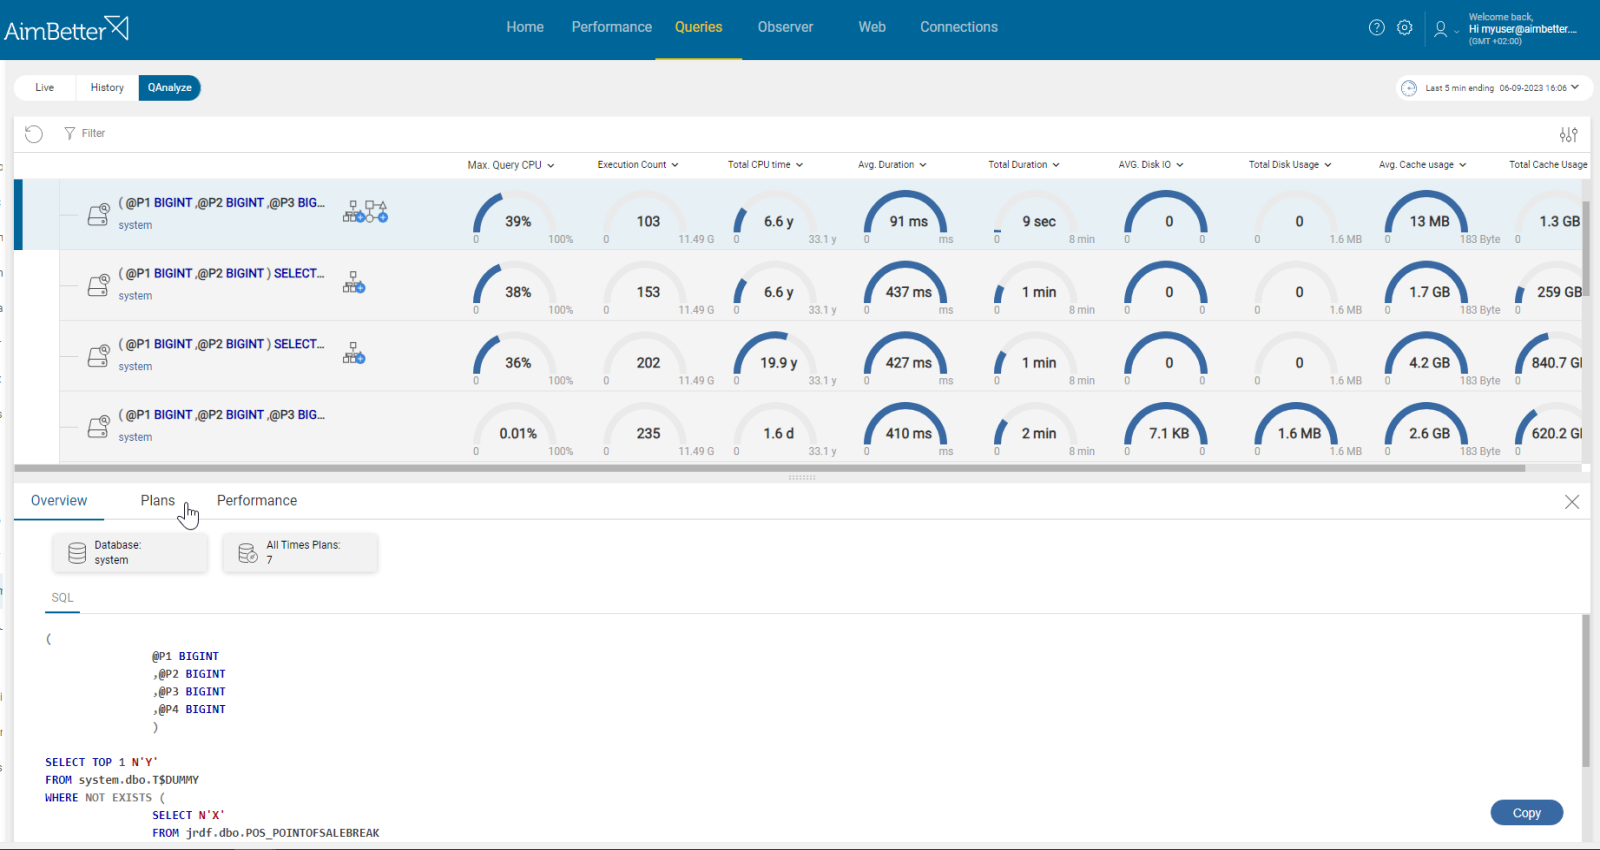
Identify higher utilization of OS resources involved with longer queries’ execution or increased session count. Try looking for waiting types related to OS resources.
- Use tracking tools such as SQL Server Profiler (for SQL Server) , or SQL Trace for Oracle, to identify running queries. Activate a trace and analyze the outcomes, looking for signs of higher activity. This task should be done by a DBA to select current filters for the trace and analyze the outcomes. Take into account that you have only current performance and can’t compare it to historical performance unless you put more traces, which requires you to wait more time.
- Another option is to use system views in order to collect data about current queries’ performance.
- Use (DMVs) Dynamic Management Views in order to identify which queries are currently waiting for hardware resources (CPU, Memory, Disk I/O, Network). It might be new events or out of the queries you tracked on previous steps. You should filter for correct wait types as well. It might be hard to track.
- Check the database settings, such as data and log file settings and division, backup type, compatibility, and more. This must be done with a professional DBA who knows the structure of the instance.
- Check the instance settings, such as parallelism, optimization, and memory settings. Remember to evaluate statistics and daily tasks to improve the databases’ functionality. As for server settings, make sure that the infrastructure fits the best mode of working—for example, advanced system properties.
- Analyze and try to figure out which seems to be the main cause of this problem.
Recommended action :
Analyze the execution plans of top resource-consuming queries and implement proper indexes. Review and optimize these queries’ code. Consider using different caching or storage solutions with low-latency access to reduce the chances of interrupts.
Change the settings of the database, instance, or host if needed. You should work with a professional and track these changes with proper monitoring tools.
Monitor any change that’s done to follow up for a better or worse performance, and do it wisely.
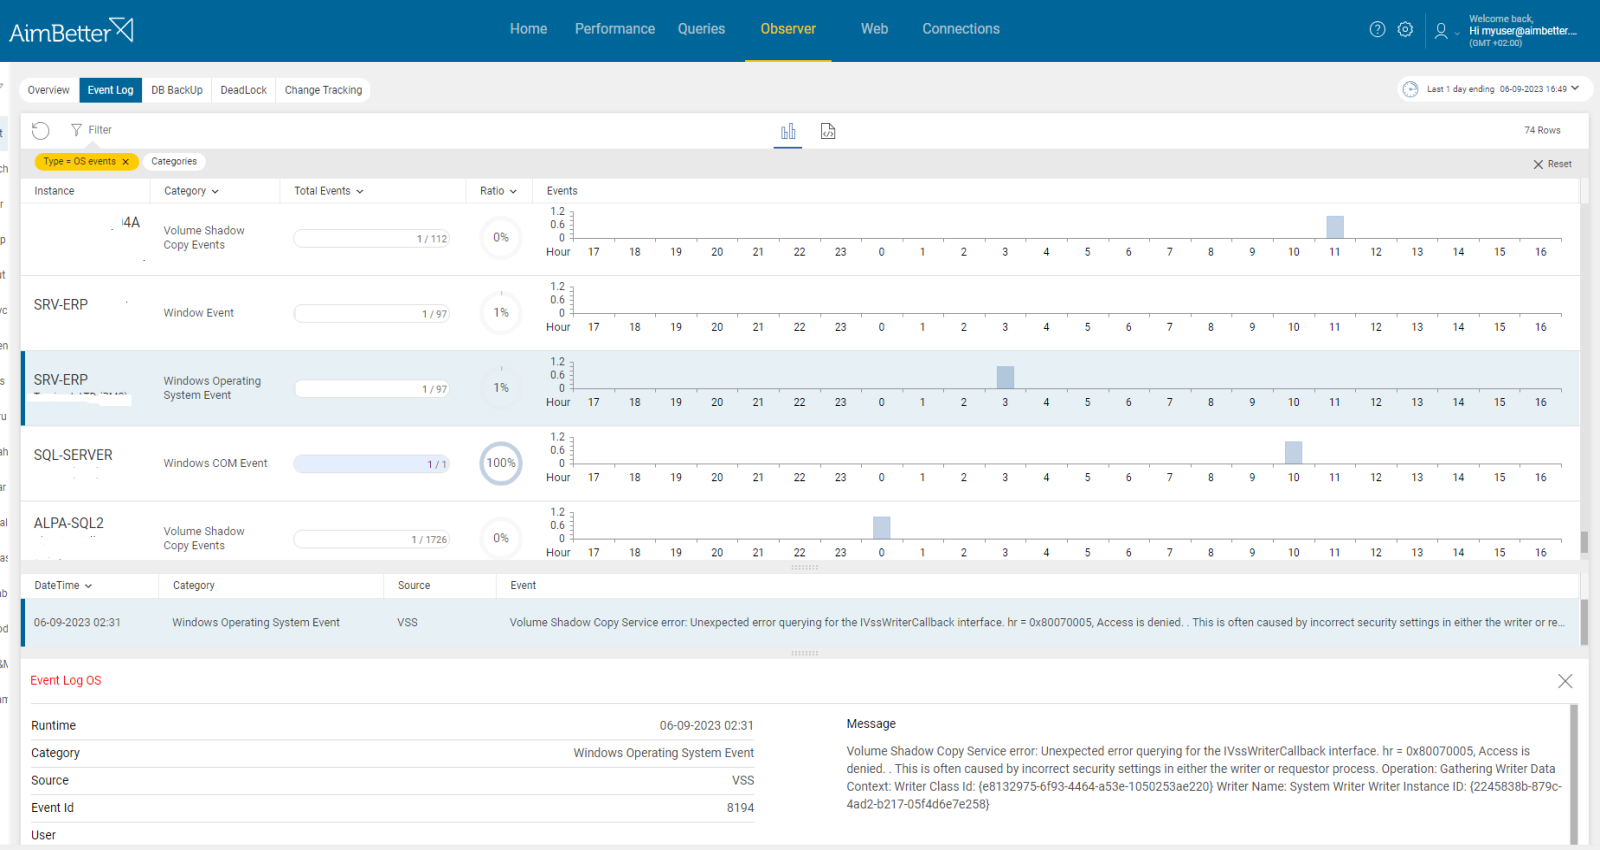
3- Hardware Errors Priority: Medium
When hardware components raise errors, the CPU hardware interrupt value might increase. These errors might happen because of communication problems or failures in various hardware subsystems. When hardware errors occur, the system may generate interrupts to alert the operating system or hardware management systems about a problem.
Problem identification:
Identify error messages related to hardware, in parallel to higher CPU hardware interrupts.
- Use the Event Viewer to recognize logs for errors such as warnings or hardware failures. Tracking these might be time-consuming, especially when the period of search is unclear.
- Start tracking CPU Hardware interrupts over time to identify peaks. You can do that with Task Manager’s “Interrupts” display or by creating an interrupt counter in Windows Performance Monitor.
- Look for System notifications and pay attention to them.
- Use built-in Memory Diagnostic tools of Windows to identify memory issues that might cause errors.
Recommended action :
Identify the exact source of the errors according to the provided error messages and codes.
Upgrade hardware if needed and run tests.


