This measure corresponds to a shortage of memory to satisfy all program needs. That means the operating system must flush the buffer pool to store and retrieve data from the hard disk.
Such situations will result in high Paging File usage. When free memory runs low, the server flushes the oldest page to disk when it requires new space. Thus sustained physical I/O both for reading and writing, which is a significant performance concern
The more memory your server has, the more cached disk reads and writes it can perform. Lack of system memory can cause high non-cached disk reads and writes. Adding memory to your server can help lower physical disk access.
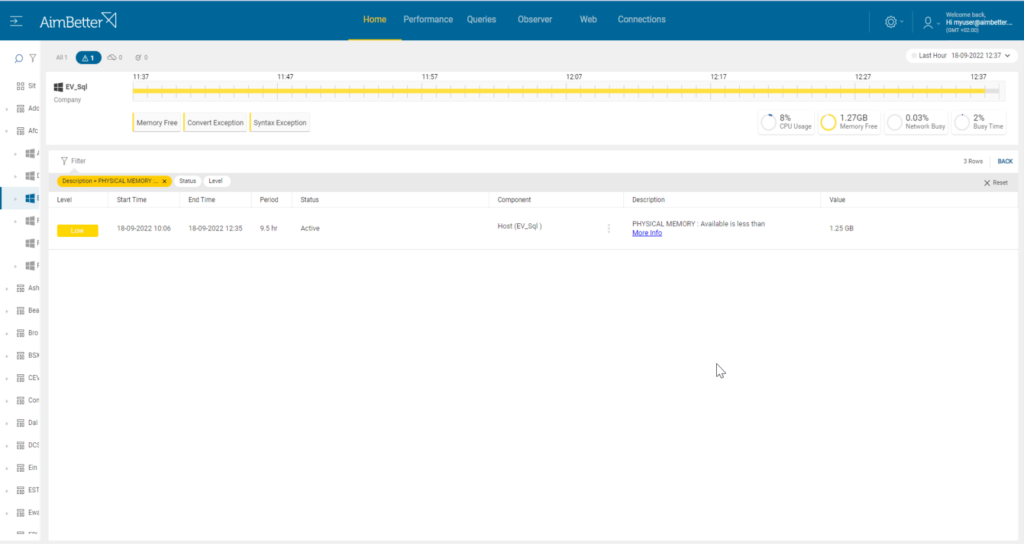
As well as measuring and alerting to the absolute total of available memory (in Gbyte), this alert compares available to total, which can be a more meaningful indicator of stress.
Find out how you can save hours of work when investigating the root cause of this issue.
Symptoms:
Available memory (percentage of total) is below the threshold.
Impact: High
A fall in available RAM may slow SQL responses.
Available memory running below the critical level can be an indicator of an impending crash or freeze.
Expected behavior
There are no suggested metrics for free memory percentage. The figures will vary based on levels of user activity, time of day, and other factors.
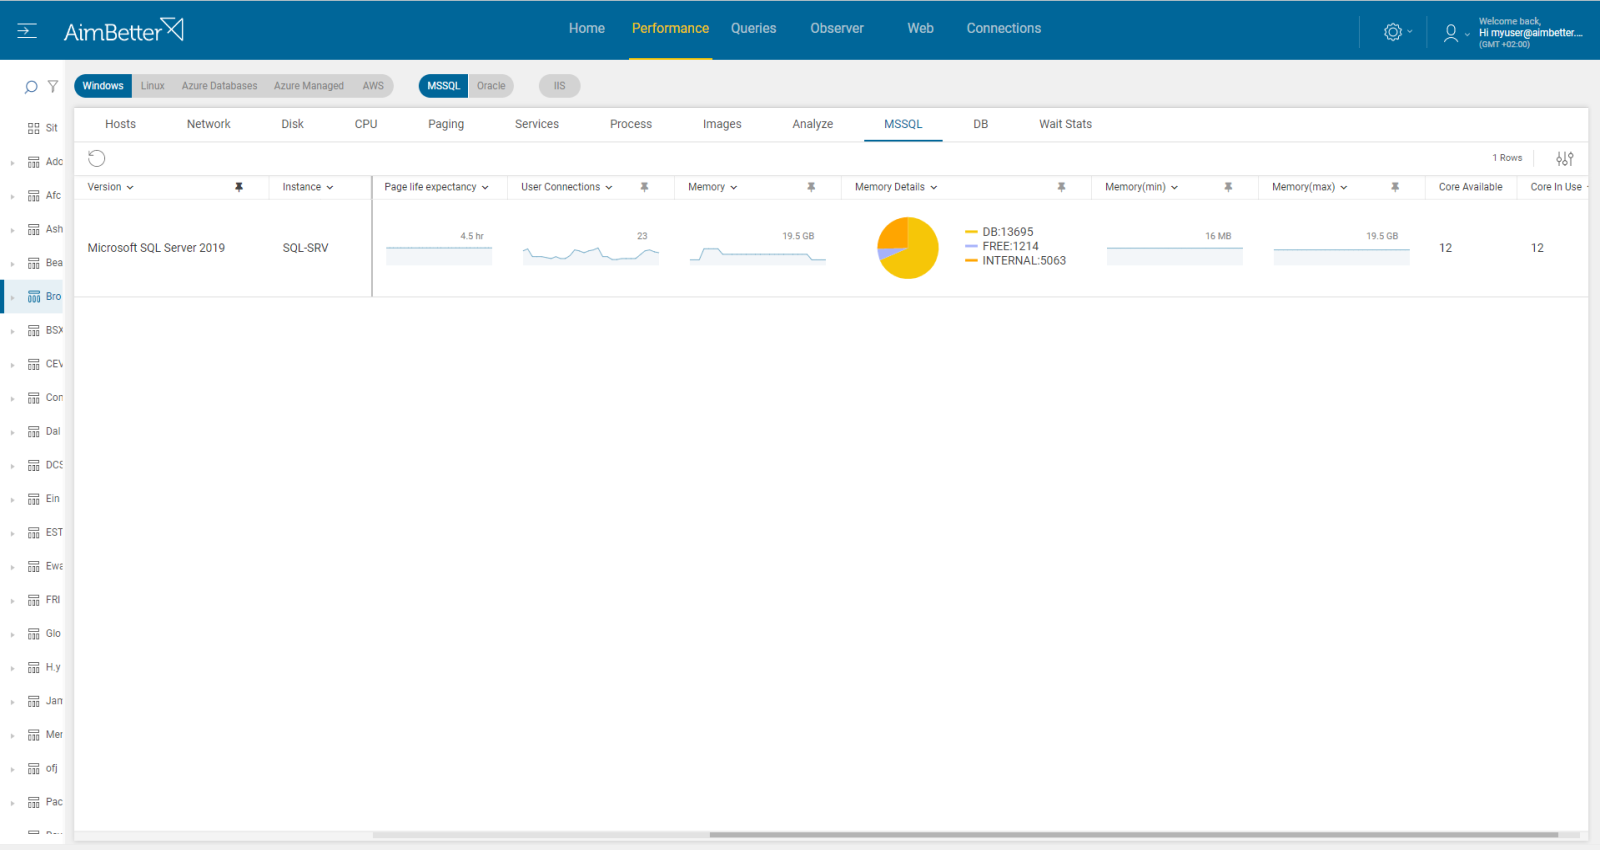
This metric is compared to total memory. Usually, we would expect more than 15% available memory for low total RAM Servers (up to 16 GB) and more than 5% available memory for high total RAM servers.
Possible causes
1- Long system tasks Priority: High
Low free memory might occur once too many applications are running simultaneously. Otherwise, low free memory happens due to memory leaks, malware, or non-optimal settings.
Problem identification:
Identify the cause of low free memory and check if it’s recurrent. Use system monitoring tools.
We would recommend taking action in the next order:
- Check if you have several applications running simultaneously; they can consume a lot of RAM memory. While doing it, also look for background processes. You should consider closing applications that you are not using currently. For that, you need to enter the task manager and look at the current processes running. However, you can’t guarantee precise results when checking the online status with no historical events.
- Use task manager to check which applications are using more memory and identify possible memory leaks. Consider reinstalling it.
- Run a malware scan on your computer to identify and remove any threats. It might take time and should not be done during working hours.
- Consider upgrading your RAM to improve performance. it might be expensive.
- Run a system file check in order to locate corrupted files.
These tasks might take hours or a day and be imprecise when looking at current performance. Therefore, we would recommend the second way.
Recommended action :
Possible short-term action – add RAM.
Check the buffer pool cache hit ratio and adjust the buffer pool allocation. See our knowledge base regarding cache hits here.
2- Low page life expectancy – Priority: Medium
For database servers, most of the time, the main process that takes most of the RAM memory is sql server. If there’s a memory issue then the apps can’t work.
See our recommendations regarding PLE here.
Recommended action :
Possible short-term action – add RAM.
Check the buffer pool cache hit ratio and adjust the buffer pool allocation. See our knowledge base regarding cache hits here.
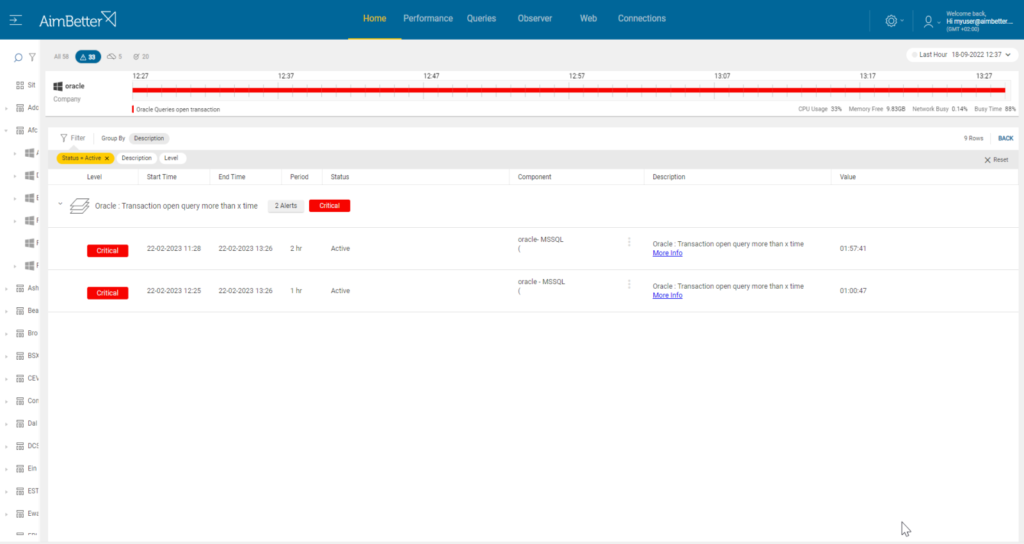
3- Long-running transactions – Priority: Medium
Properly size your log file and disk capacity to account for a worst-case scenario (e.g., maintenance or known large operations).
Problem identification:
Identify long-running transactions that hold on OS resources while focusing on cache usage.
- Use SQL Server Management Studio to identify the long-running transaction consuming memory. For Oracle, you should use Oracle Dynamic Performance Views or other tools.
- Look for queries with code written ineffectively. Consider how to improve the performance of these queries. Try to look at improving query code, reducing transaction length, or identifying inefficient operations in the query’s plan. This task might be complicated, requiring a highly skilled DBA.
- You may need to increase the amount of memory allocated to SQL Server or Oracle.
Recommended action :
Optimize the application code – avoid starting a transaction in your application that is having long conversations with SQL Server or risks leaving one open too long. If doing operations on large numbers of rows, consider batching them up into more manageable chunks and giving the log time to recover.
Improve the query execution plan, increase the allocated max memory, or consider upgrading your hardware to increase the amount of RAM available to the server.
See our knowledgebase entry regarding long queries here.
4- SQL not releasing memory to the operating system – Priority: Medium
You must check the Max Server Memory configuration option that determines how much memory SQL Server can consume. It needs to allow sufficient space for the operating system’s activities. If too much is reserved for SQL, it is not released when the SQL server is under light load, so the dynamic balance between OS and SQL does not adjust automatically.
Compare the Max Server Memory with the existing total RAM memory.
- Verify that the maximum server memory setting is appropriate for your server’s hardware and workload.
Too low? SQL Server or Oracle may not have enough memory to store frequently accessed data in the buffer pool.
Too high? SQL Server or Oracle may be consuming too much memory, which can lead to memory pressure and paging to disk. - Compare the maximum server memory setting in SQL Server with the existing total RAM memory. Use the Max Server Memory configuration option to configure how much memory SQL Server can consume.
- For Oracle, you should use oracle dynamic performance views or run scripts in SQL-plus.
- You need to do it parallelly while entering the task manager and viewing the current performance, which changes every moment. Keep in mind that you don’t have historical data on it.
Recommended action :
Change current max memory settings while allowing sufficient space for the operating system’s activities. If too much is reserved for database activity, it is not released when the SQL server is under light load, so the dynamic balance between OS and SQL does not adjust automatically


