We’re excited to introduce AimBetter 2.4.0, packed with powerful new capabilities, improved visibility into system activity, enhanced monitoring options, and numerous usability improvements across the platform.
Alert Settings
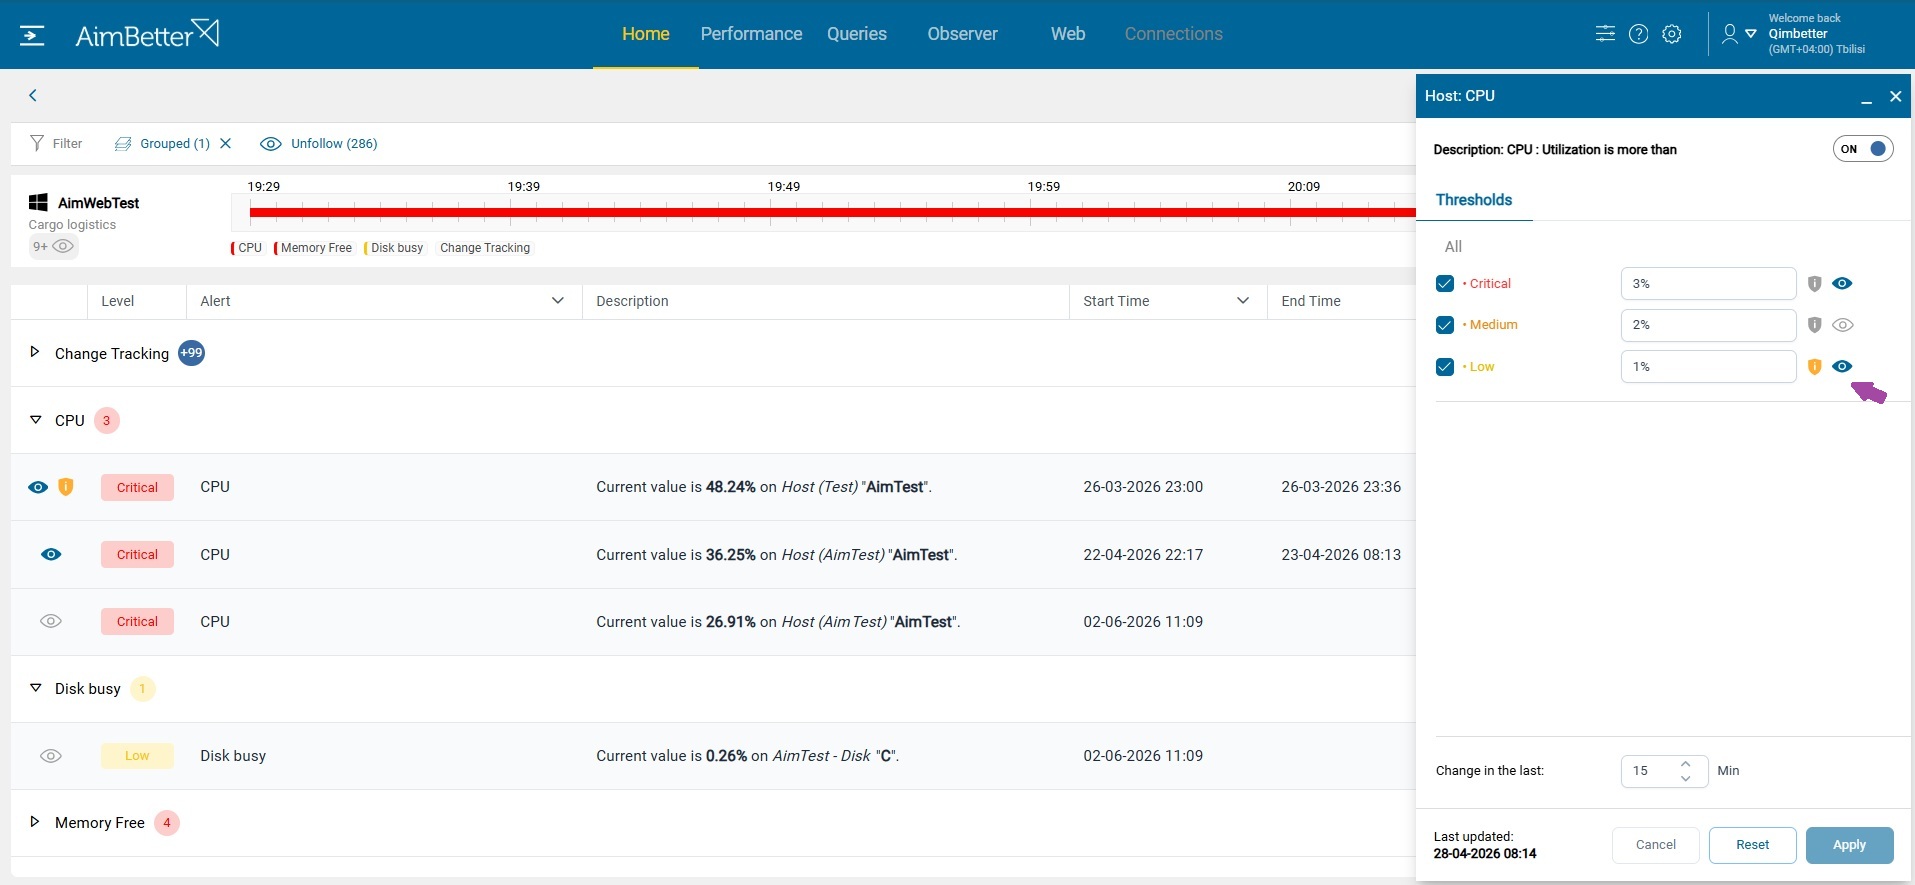
Define Risk & Follow
Administrators can now define default Risk and Follow settings directly within Alert Settings, providing greater flexibility and ensuring alerts are handled according to organizational requirements.
Risk settings allow users to mark any alert and severity level as a potential security risk. While some alerts already include a predefined risk classification indicating a possible security vulnerability, users can now customize these definitions and assign risk indicators to additional alerts based on their own security policies and operational needs.
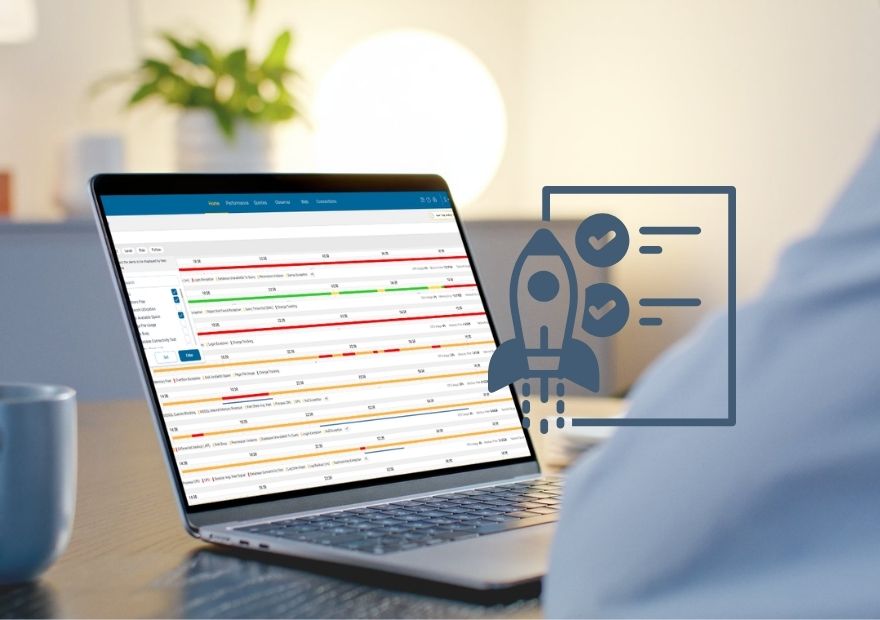
Follow settings ensure that important alerts remain visible on the Home dashboard until they are addressed, regardless of whether they fall within the selected time range. For example, if a critical job fails during the night, its alert may no longer appear when users open the Home dashboard with the default “Last Hour” filter. By marking such alerts as Follow by default, organizations can ensure that important issues remain visible and actionable until they receive the necessary attention.
Change Tracking Enhanced Category Configuration
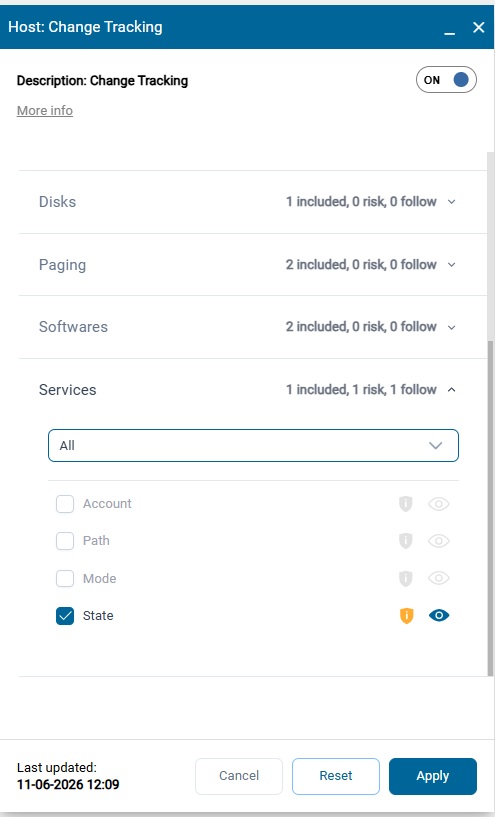
Change Tracking Settings have been enhanced to support selecting specific change types within each category. This provides more granular control over monitored changes, helping teams focus on the configuration modifications that matter most while reducing unnecessary noise.
Change types that are deselected in the Change Tracking Settings will no longer generate email or mobile notifications and will not appear on the Home dashboard. However, these changes will continue to be monitored and recorded, and will remain fully available for review in the Observer Change Tracking tab. This allows organizations to reduce alert fatigue without losing historical visibility into system and configuration changes.
Alert Details
Alert Notification Table
A new Alert Notification Table has been added to Alert Details, providing complete visibility into alert notification activity. Users can easily review when notifications were sent, through which channels, and gain better insight into alert distribution and escalation processes.

Alert Event Table
For alerts related to operating system or database errors and events, the Alert Details now includes an event table displaying the specific events that generated the alert. Users can adjust the date range to review all events within the same category for up to one month, providing a broader context and helping identify recurring issues or trends.
Selecting an event from the table opens its detailed information, allowing users to quickly investigate the root cause and better understand the sequence of events that led to the alert.

QAnalyze
Gap Visualization in Graphs
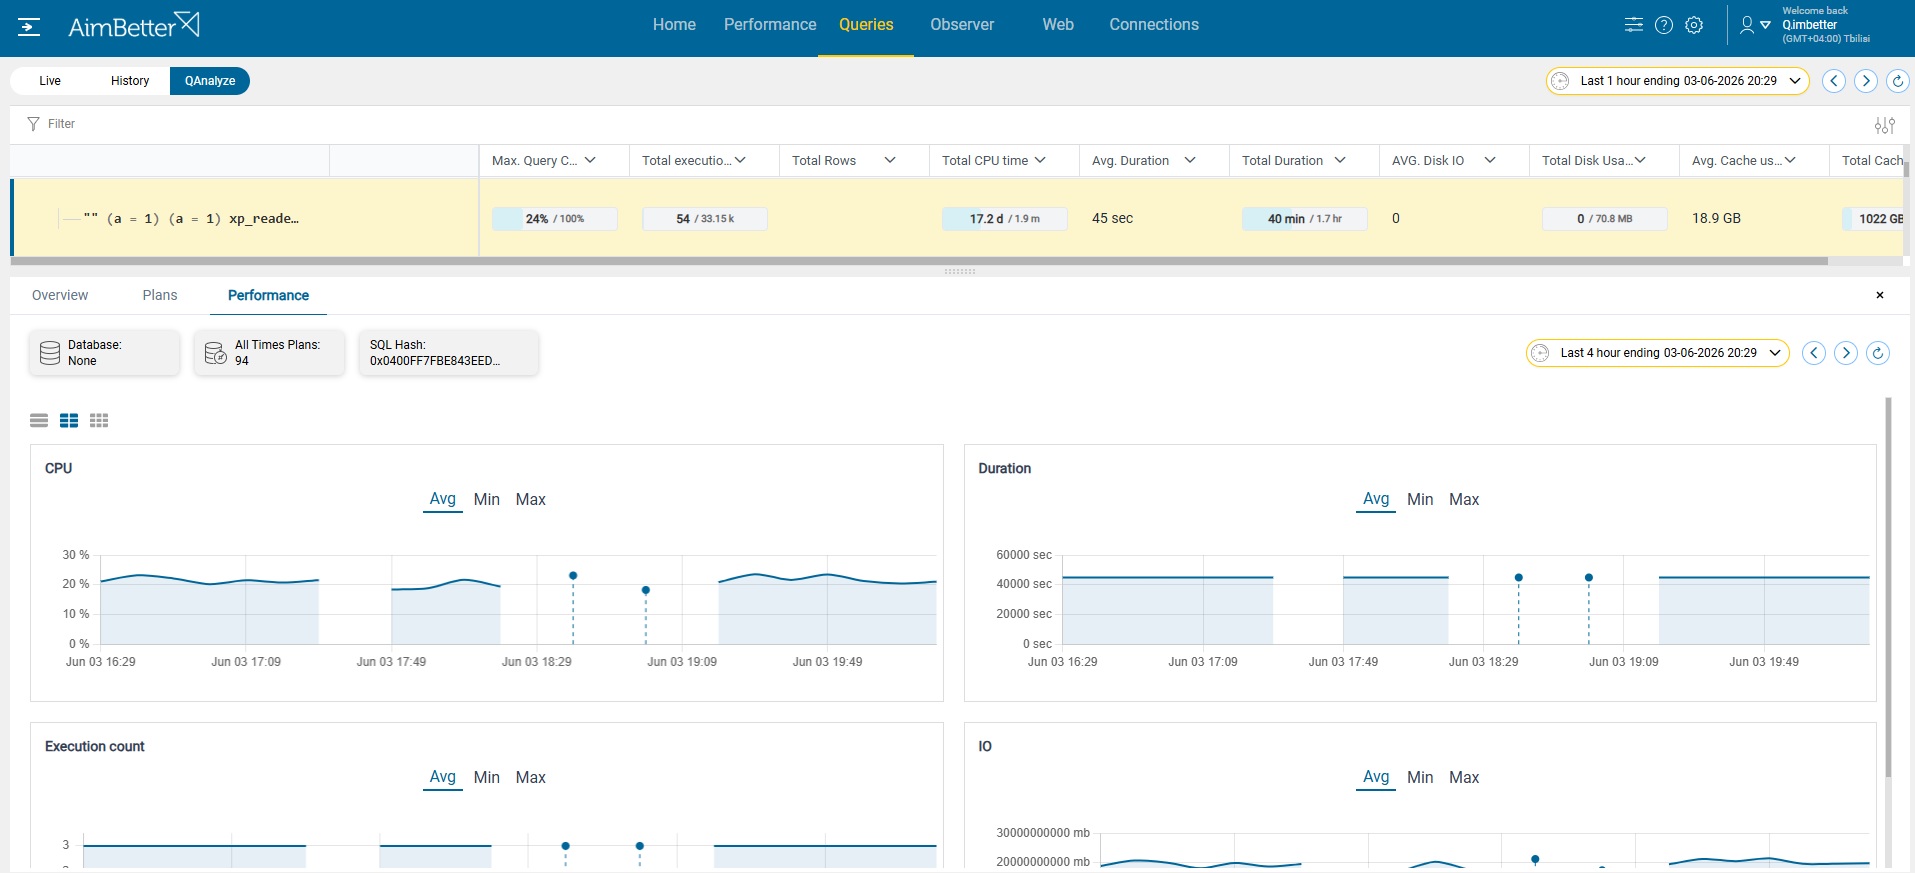
QAnalyze graphs now visually highlight gaps in collected data. This improvement helps users quickly identify periods when data was unavailable, either because the query was not among the most resource-intensive queries or because data collection could not be completed.
This enhancement provides a clearer context for analyzing performance trends and query behavior, enabling users to more easily distinguish between actual changes in activity and missing data points.
Performance Monitoring
New Database Metrics
AimBetter now monitors additional database and storage performance metrics, including DataReadIO, DataWriteIO, DriveHealthState, LogIO, ReadIOPS, ReadLatency, WriteIOPS, and WriteLatency. These new metrics provide deeper visibility into storage subsystem performance and help identify I/O bottlenecks, latency issues, and underlying infrastructure health concerns more effectively.

Event Log
SQL Agent Job Events
Observer now displays SQL Agent Job Failed and Job Canceled events, using the Job Name as the event source. This enhancement simplifies troubleshooting by providing clearer visibility into failed or canceled database scheduled processes.

Web Monitoring
URL Parameters for GET Requests
Web Monitoring now includes a dedicated URL Parameters tab for GET requests. This allows users to easily inspect transmitted parameters, improving troubleshooting capabilities and providing greater visibility into web application activity.

Responsive Actions
Kill Image and Associated Processes
A new responsive action allows administrators to terminate a selected executable image together with all associated child processes. This enables faster response to runaway applications, resource-consuming processes, or suspicious activity.

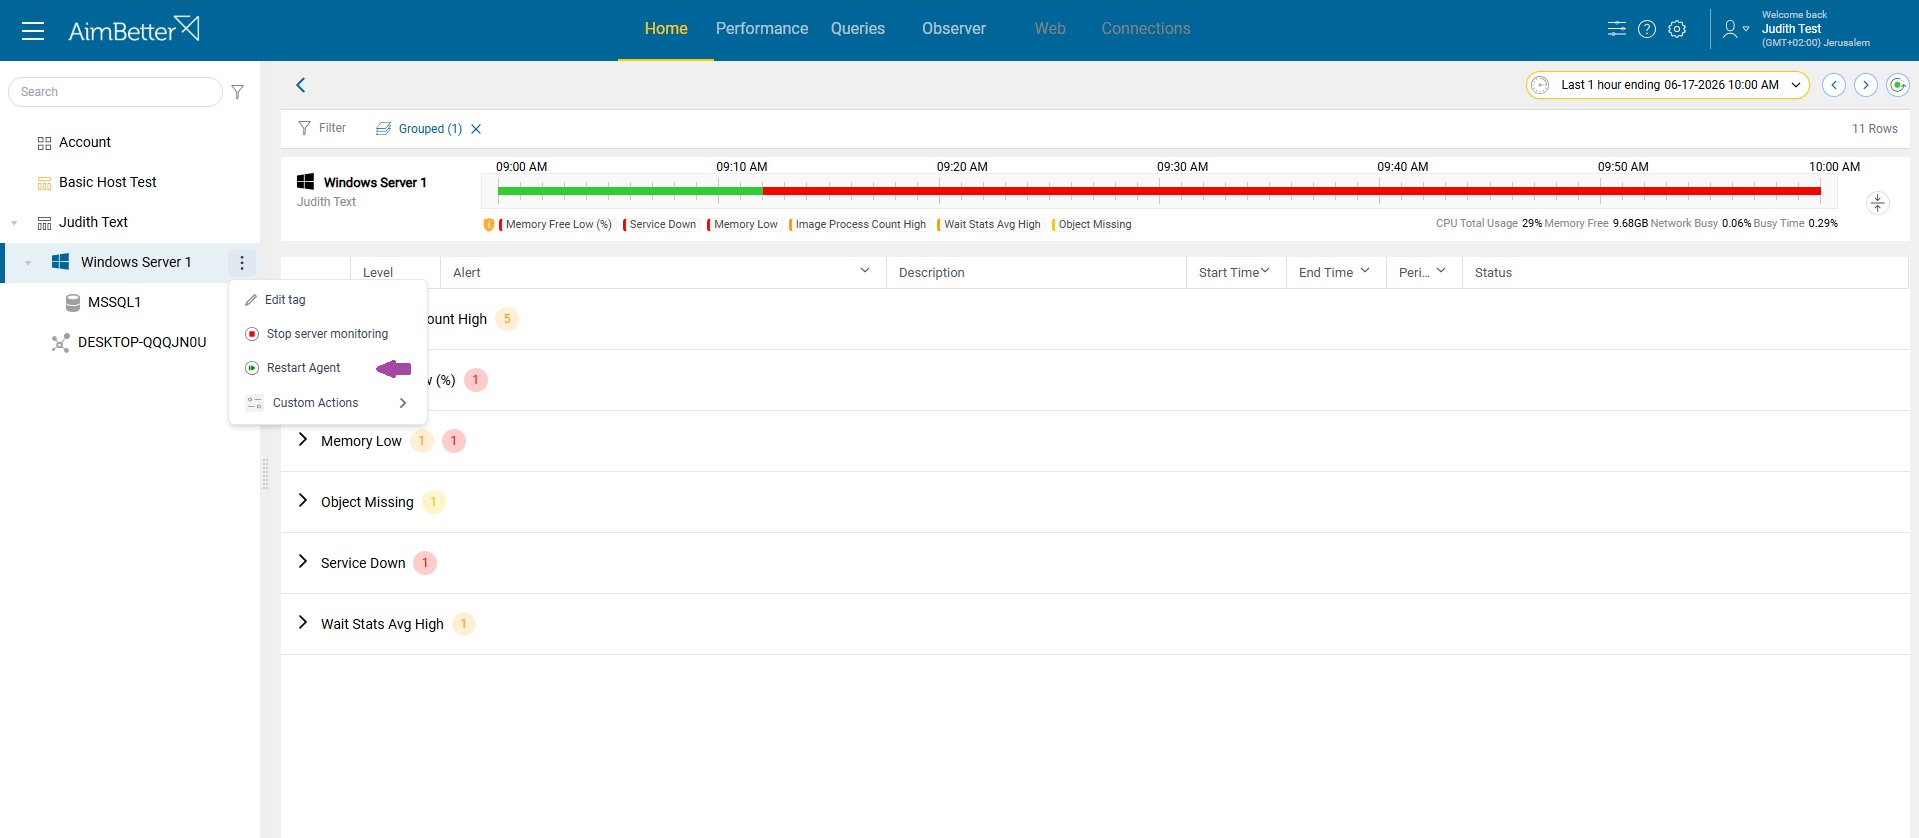
Restart AimBetter Agent Service
Administrators can now remotely restart the AimBetter Agent Service directly from the platform. This simplifies troubleshooting and reduces the need for direct server access when resolving agent-related issues.
New Email Report
A new Alert Summary Email Report provides a consolidated view of alert activity, helping teams stay informed about system health, trends, and recurring issues through scheduled email summaries. From the report, users can directly open the AimBetter dashboard to investigate issues in more detail, enabling faster troubleshooting and seamless transition from overview insights to in-depth analysis. Read more.

Additional Improvements
Several usability and performance enhancements have been introduced throughout the platform.
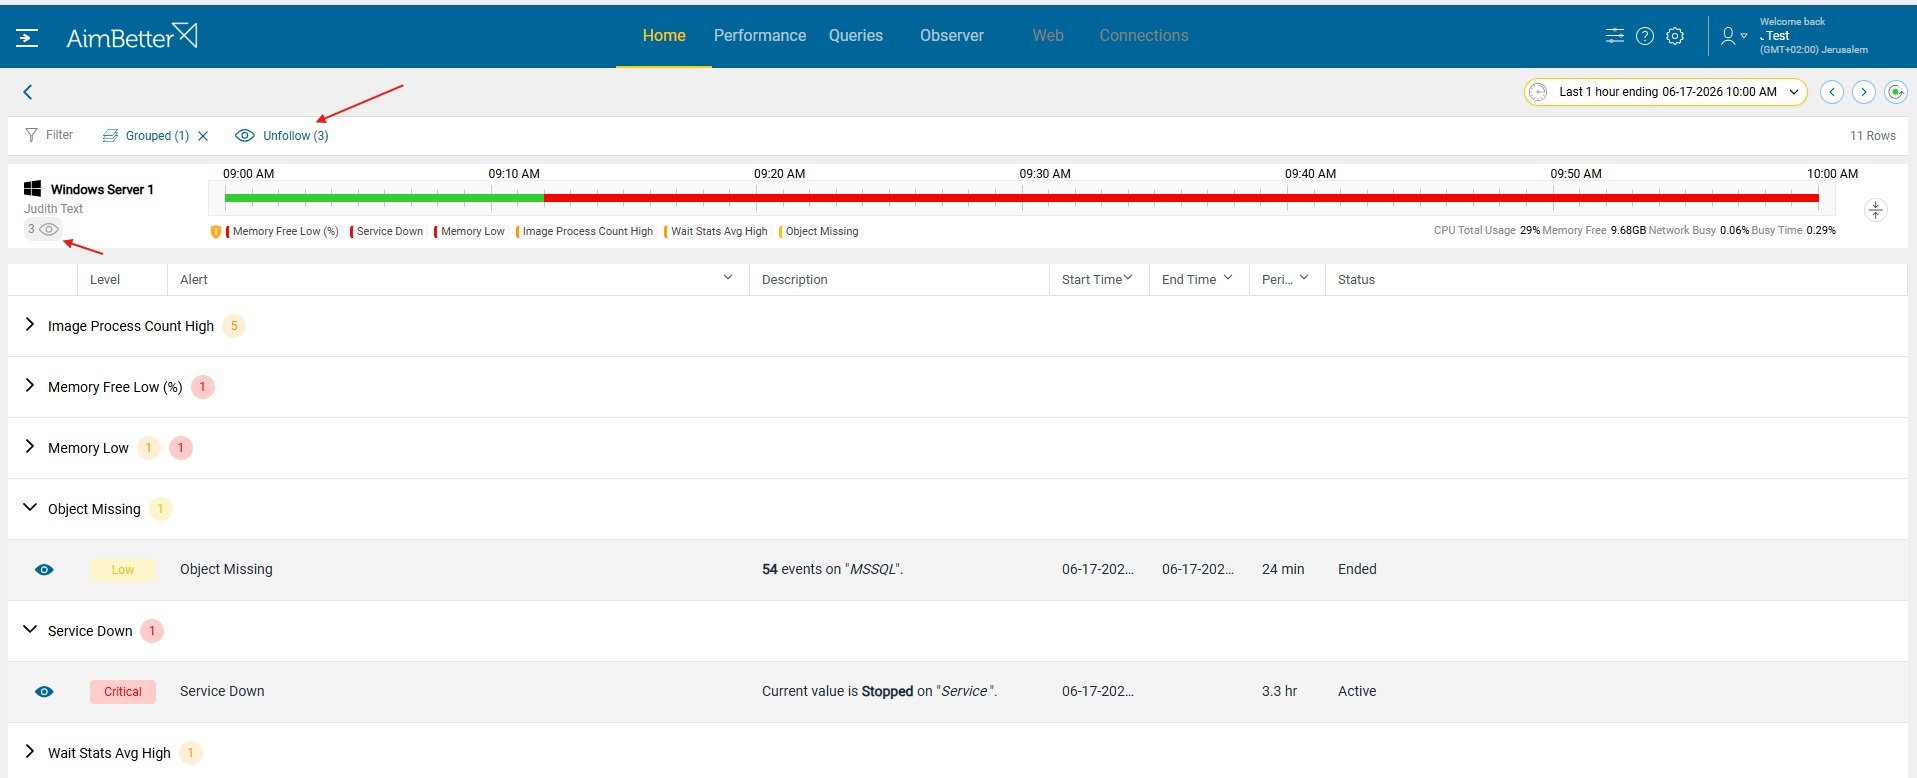
- Unfollow All – Users can now unfollow all monitored entities with a single action
- Follow Count – View follow counts clearly in the interface under the server on the Home dashboard
- Improved alert description formatting in the Home dashboard
- Preview queries in the QAnalyze table without displaying parameter values
- Identify blocked queries that got a timeout through a dedicated timeout indicator
- View query login times
- Experience improved overall responsiveness thanks to a new high-performance table grid implementation.
This release also includes several smaller refinements designed to improve the user experience, including:
- Sortable and resizable table columns
- Performance graphs that automatically display maximum or minimum values according to the alert condition,
- Reorganized alert icons on the Home page
- Additional table configuration columns
- Query start times displayed with second-level precision
- Improved expansion behavior within Observer Overview.