“AimBetter represents NextGen database monitoring – providing powerful cloud tools to identify problems on the spot.”
by Rony Shoshani, Operations Manager
Gain complete visibility and control of the SQL Server environment, understanding the root cause of performance issues in real-time. Powerful computing capabilities and advanced algorithms shorten the time needed to troubleshoot critical issues, improving system stability and performance. With the insights gained from AimBetter SQL Server RTPS, you can make informed decisions about optimizing and enhancing your databases without being a Database Administrator.
You’ll be able to quickly identify the source of performance issues, whether from application code errors, non-optimal query plans, operating systems, or hardware deficiency. Instead of asking for the expert DBA to analyze each performance issue, you can count on AimBetter’s powerful computing capabilities to analyze all the activities and identify what needs to be fixed. That means significant time and cost savings for you and your company.
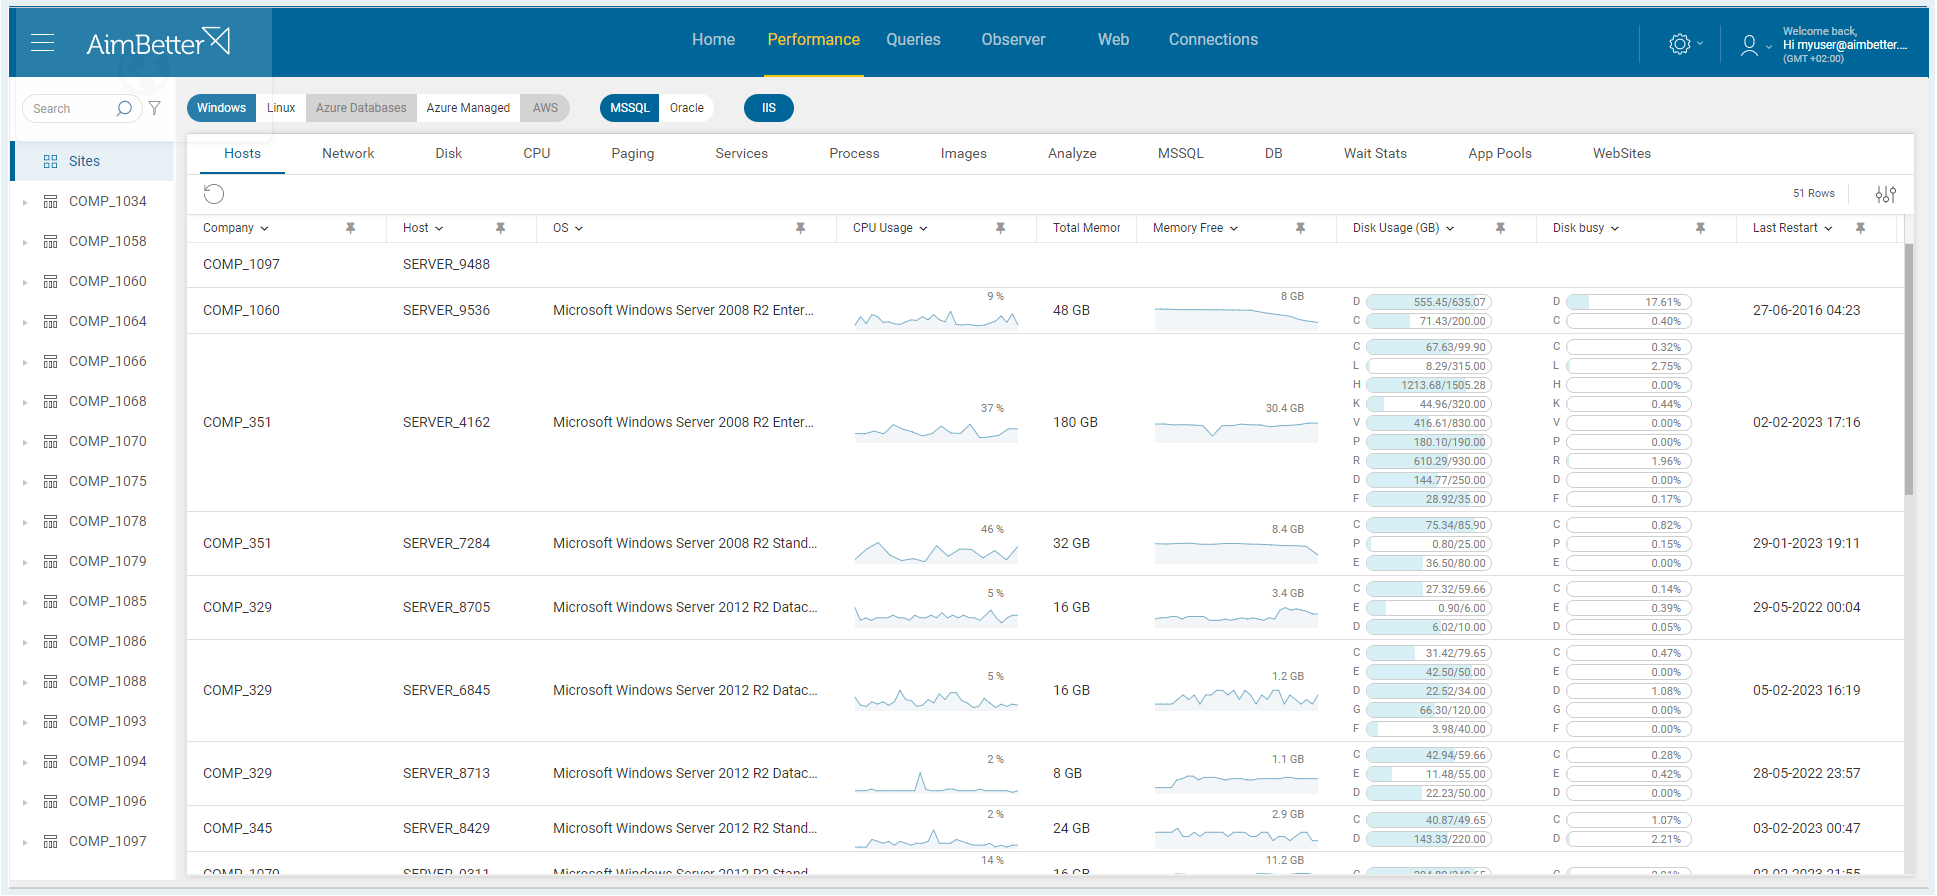
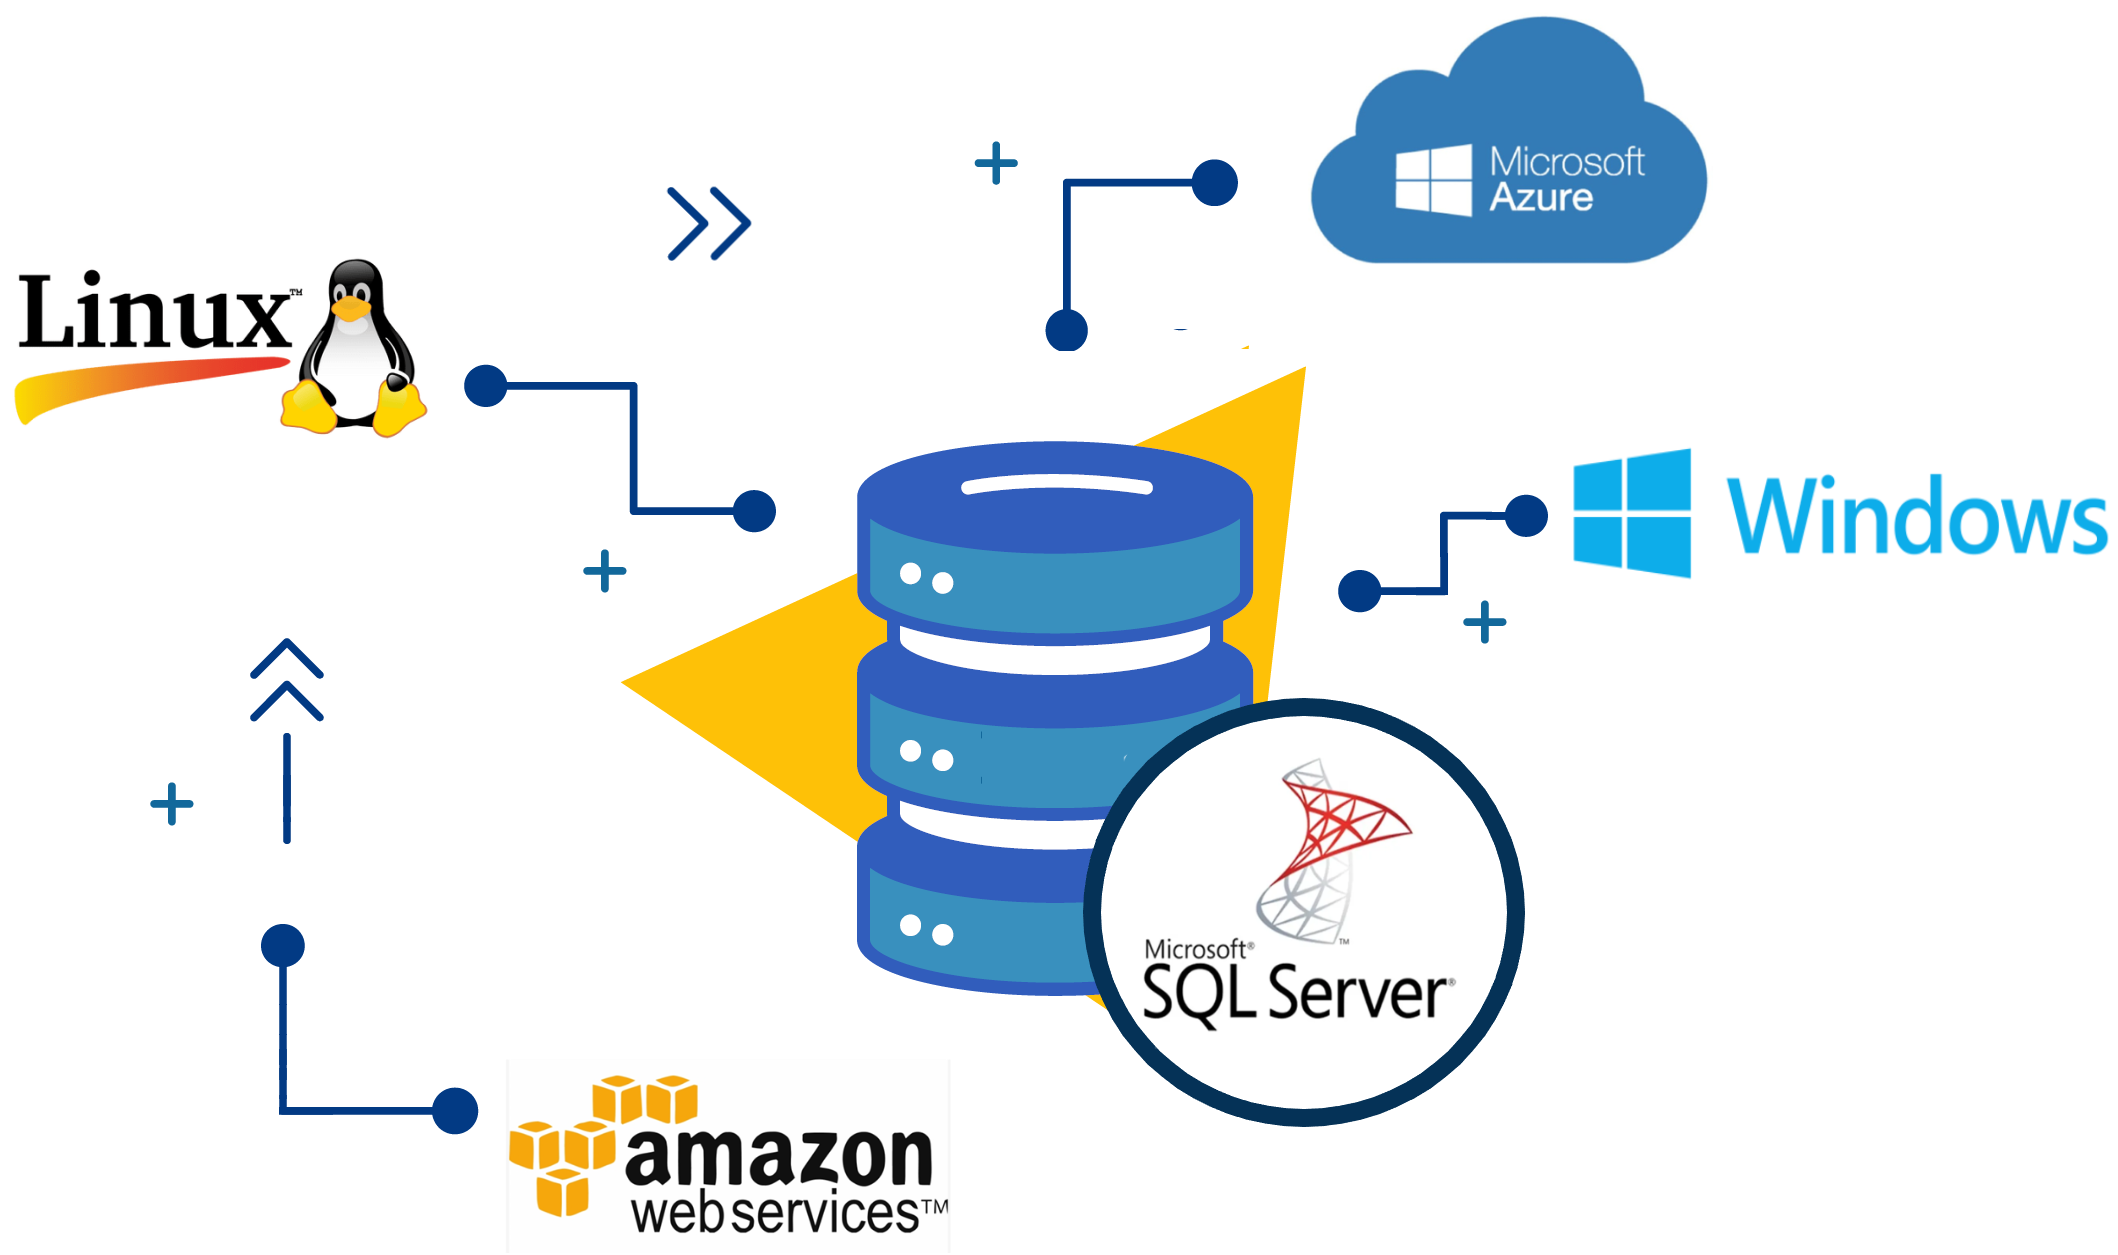
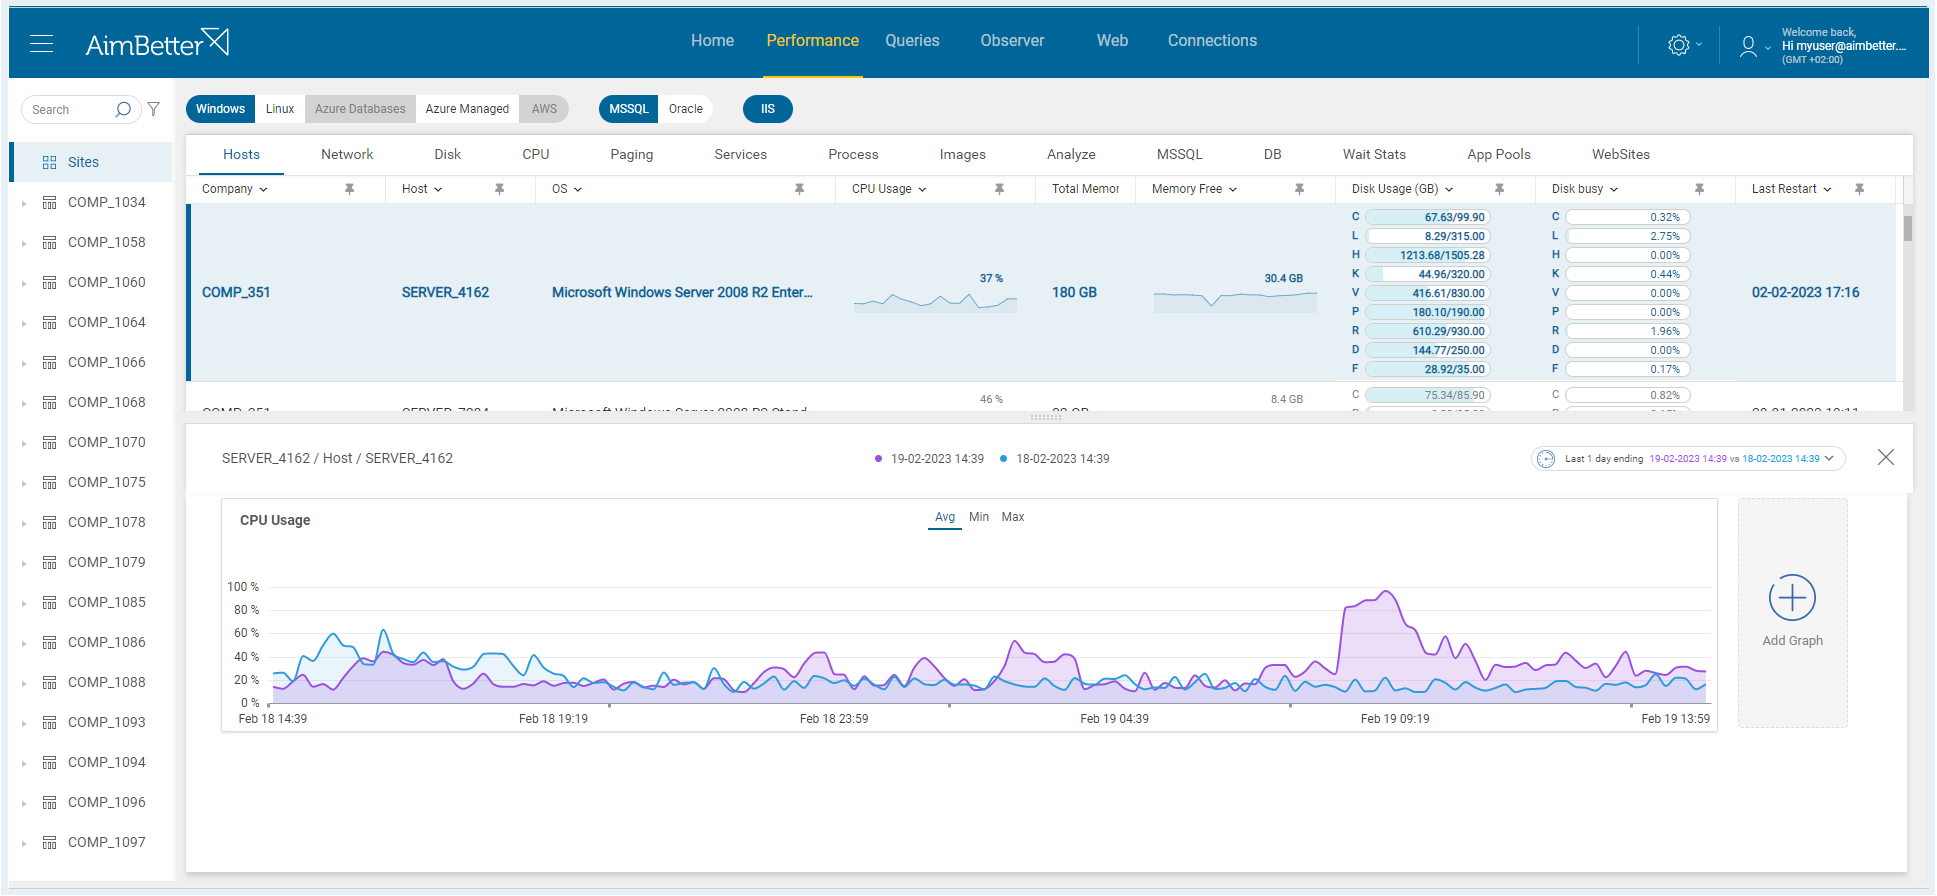
1. System – the first layer of the SQL Server environment is the system layer. It includes the server’s Hardware and Operating System, such as Windows or Linux.
2. Resources – the second layer includes all the server´s resources, CPU, memory, hard disk, and network.
3. SQL Server – the third layer is the SQL Server program (Database Management System), such as Microsoft SQL Server, Oracle SQL, MySQL, PostgreSQL, and MongoDB.
4. Queries – the fourth layer are the queries that run in the Database System.
5. Processes – the fifth layer includes the interaction between the Database System with its different types of clients (real users and system automation), through the processes initiated by these clients applications.
6. Exceptions – the sixth layer refers to the exception mechanism used by the other layers that communicate events and errors occurring constantly on the system.
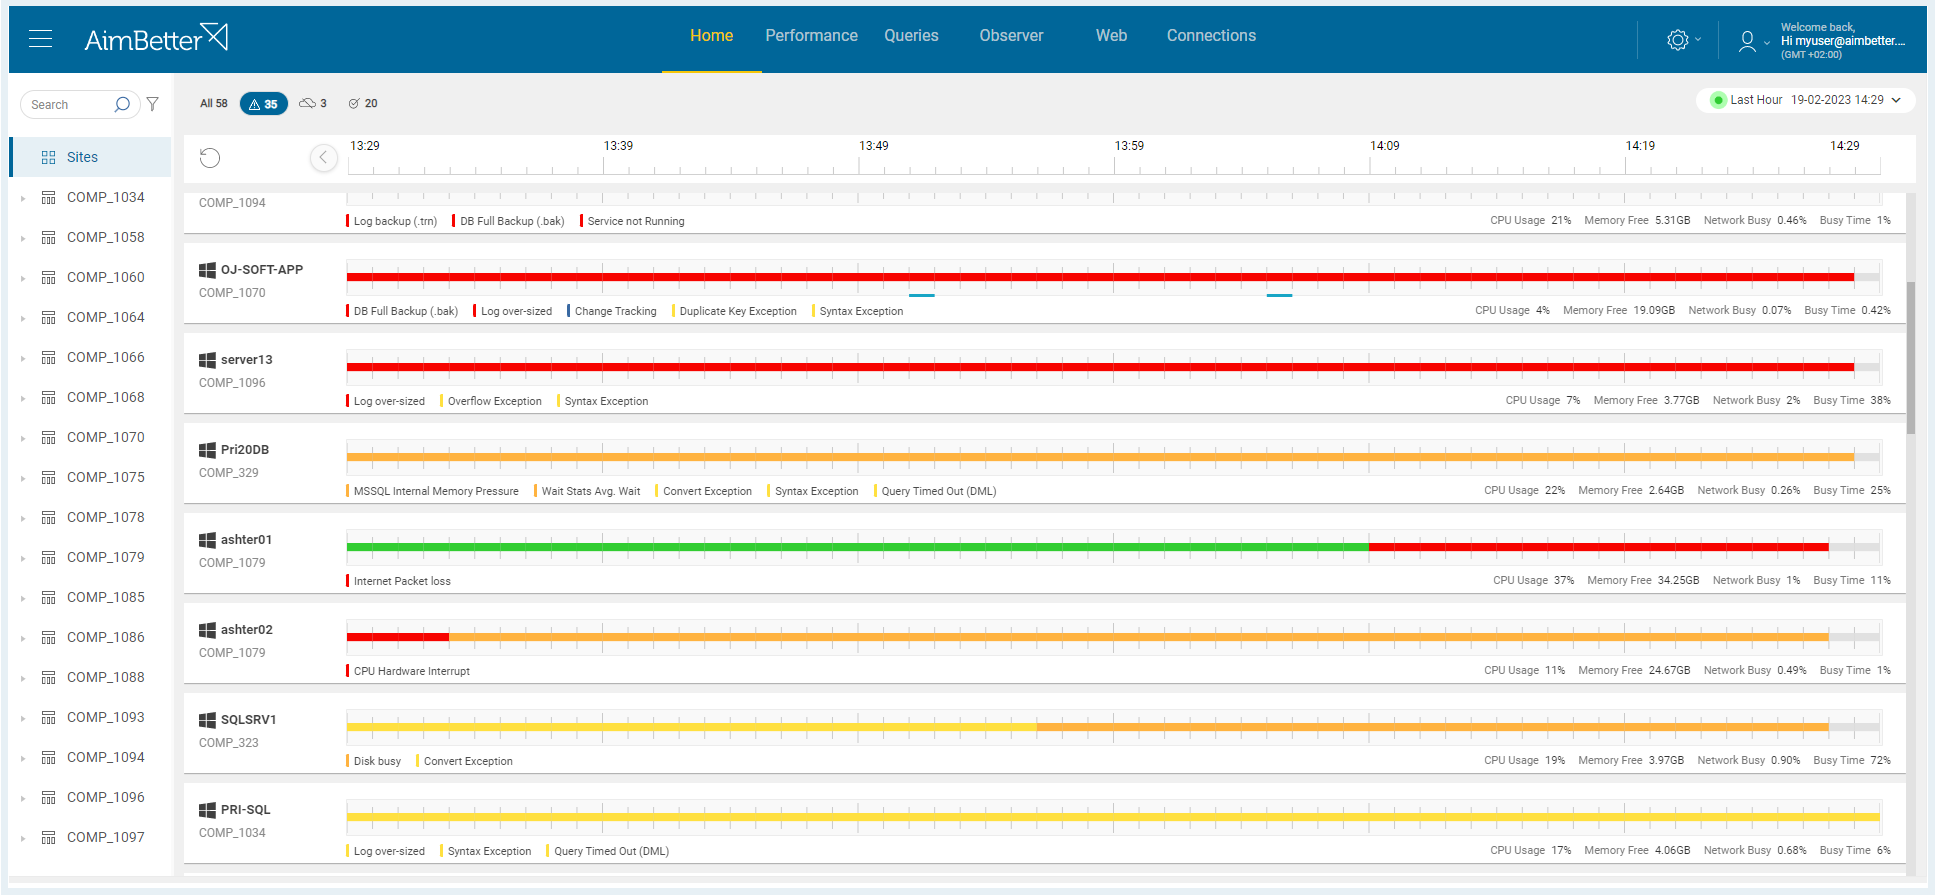
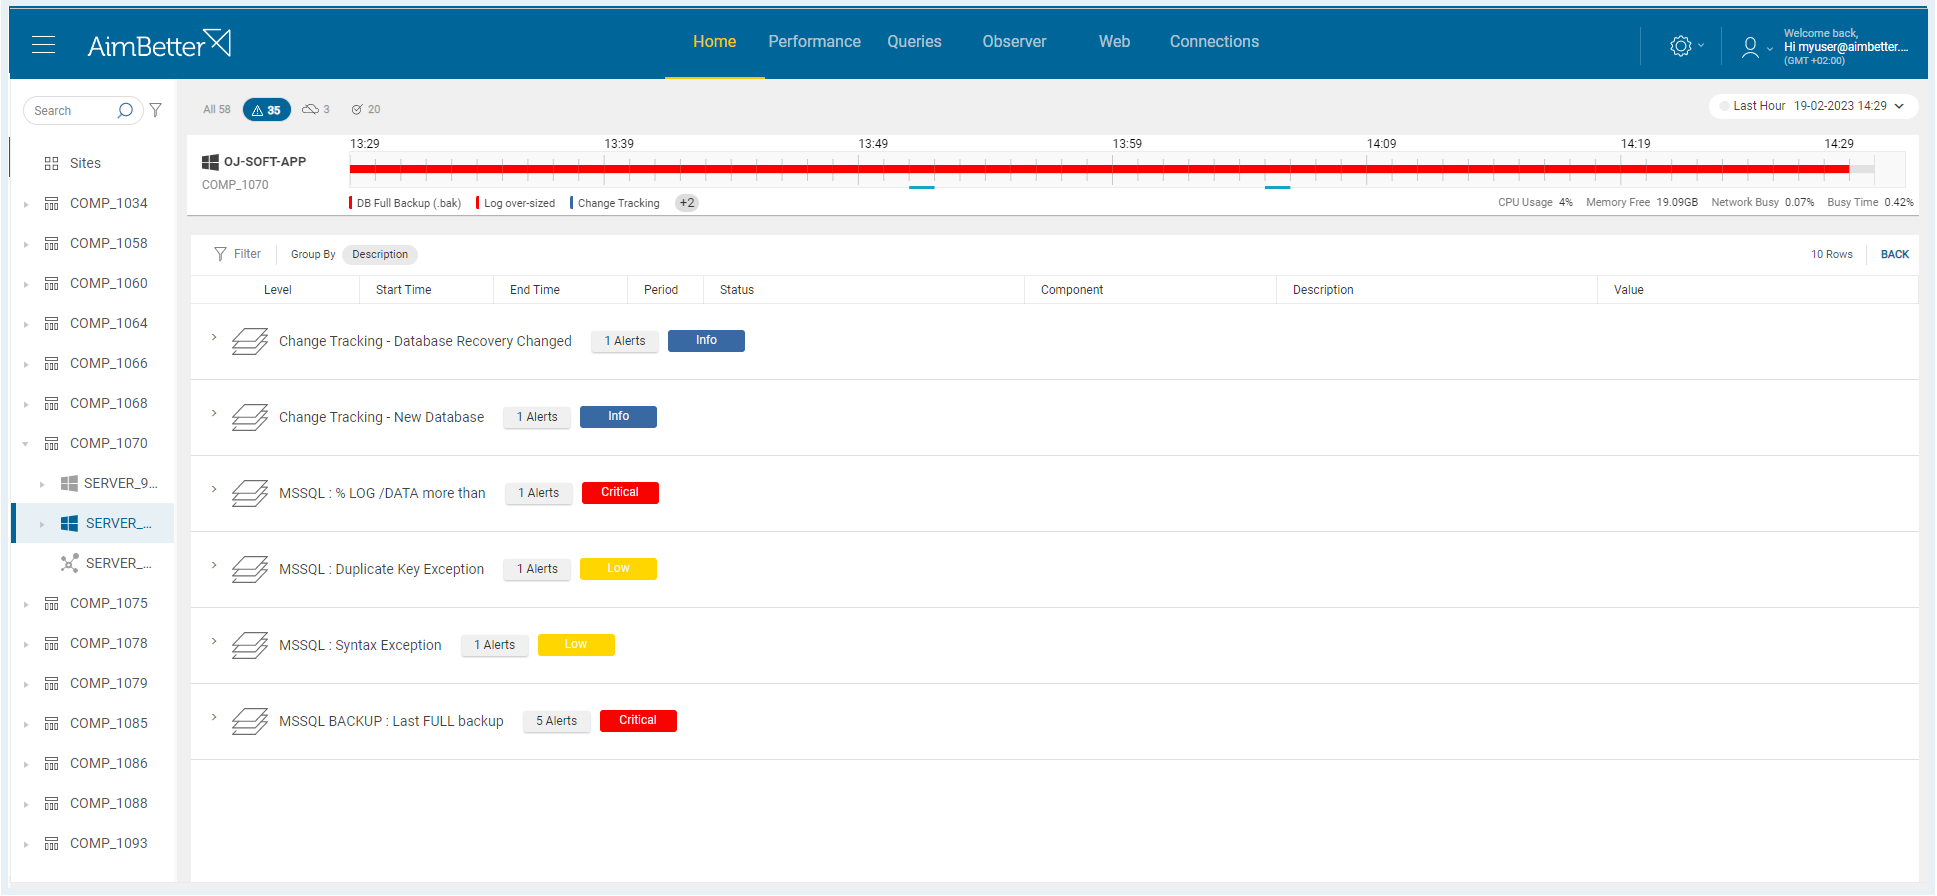
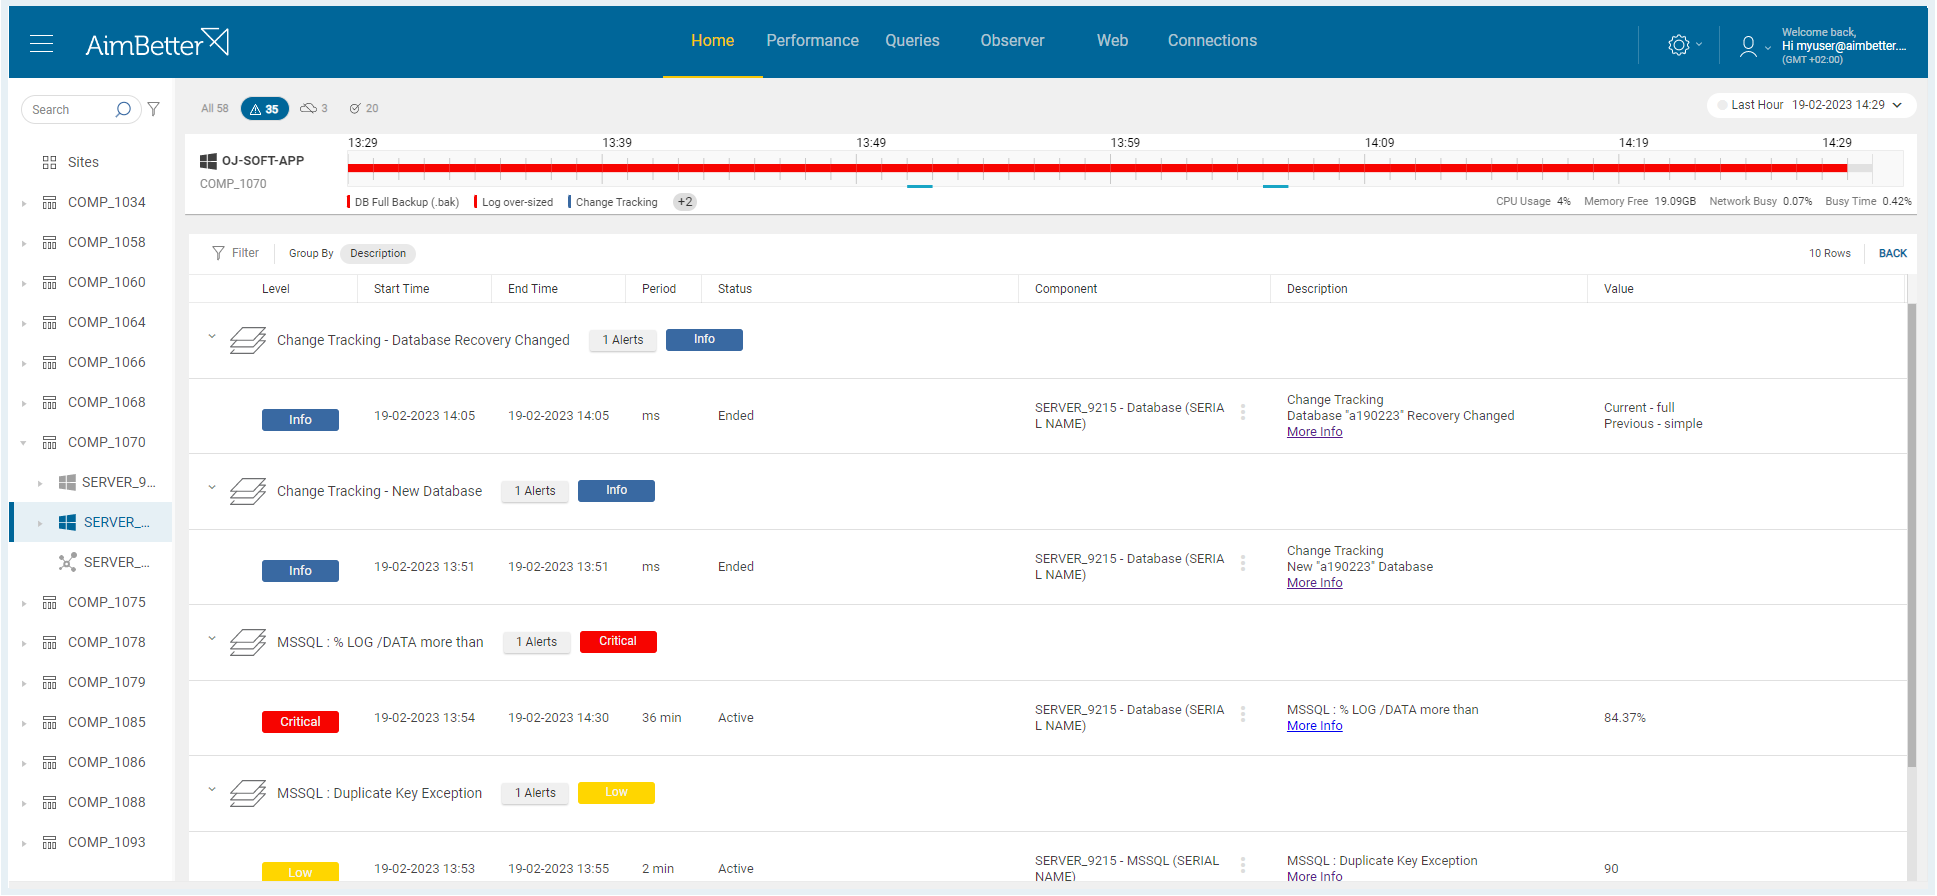
✓ Quickly identify and address the most urgent cases.
✓ Scroll over the bars and become aware of the present challenges through labels beneath the status bars
✓ Choose which servers to focus on by selecting the hierarchical layer (All, Company, Host, or Server)
✓ Get details in seconds by clicking on the status bar
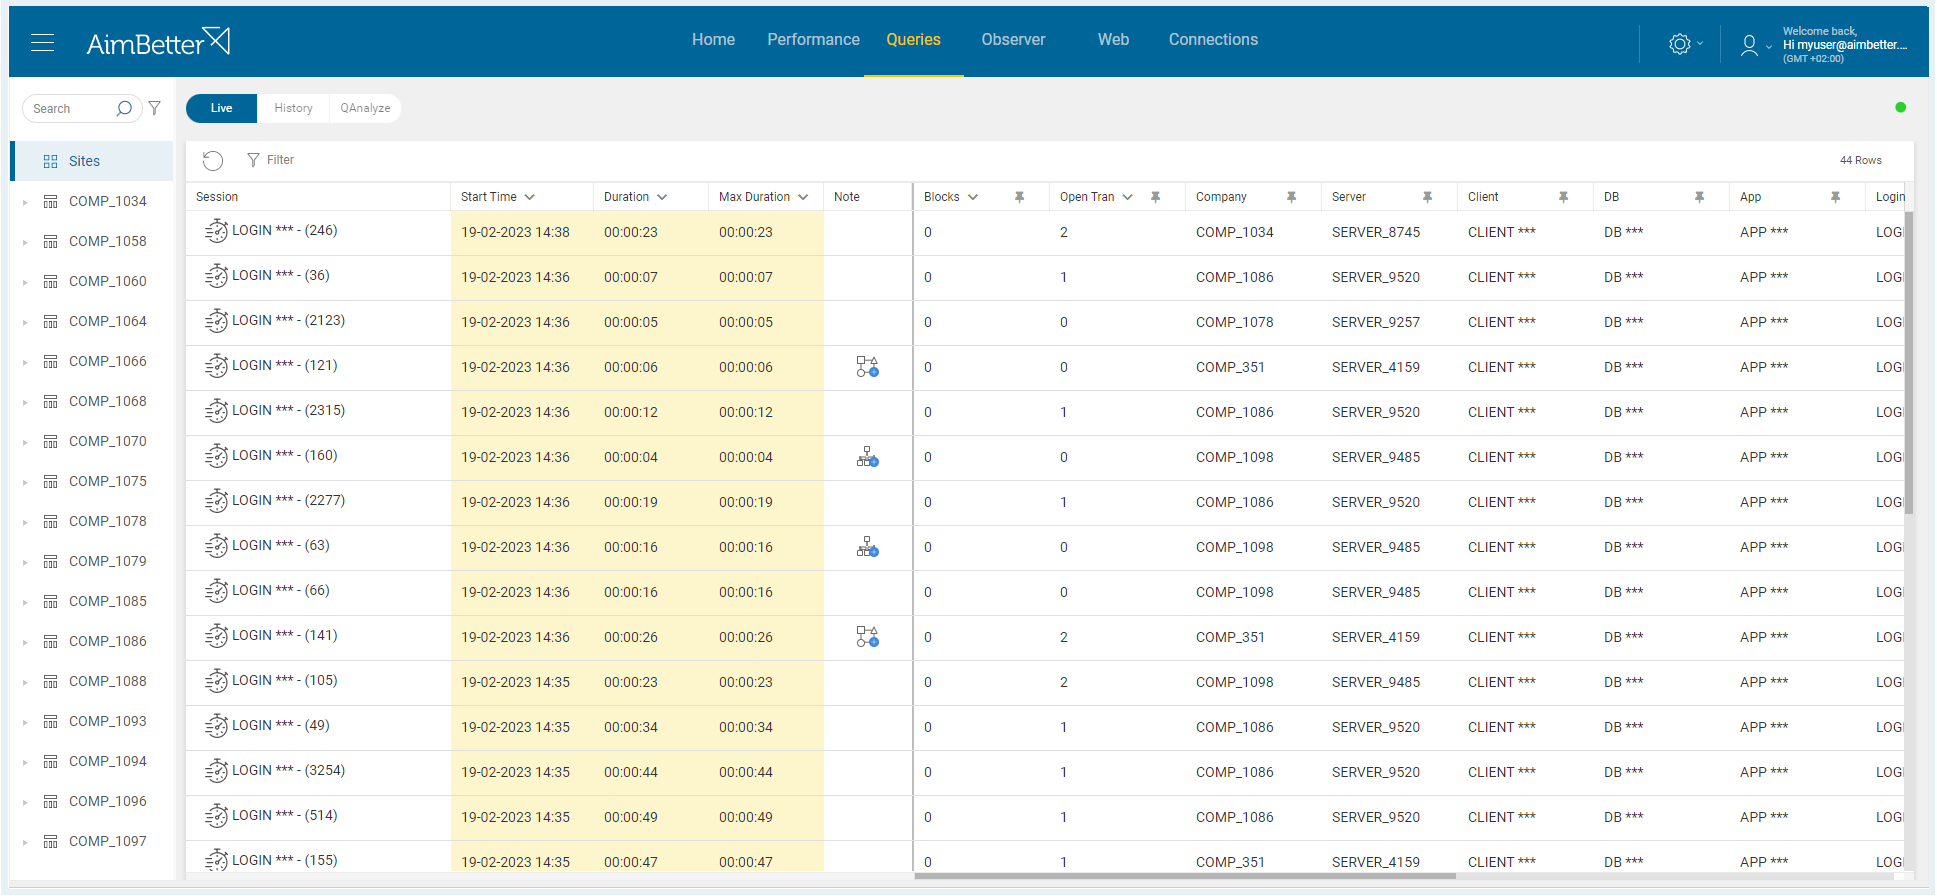
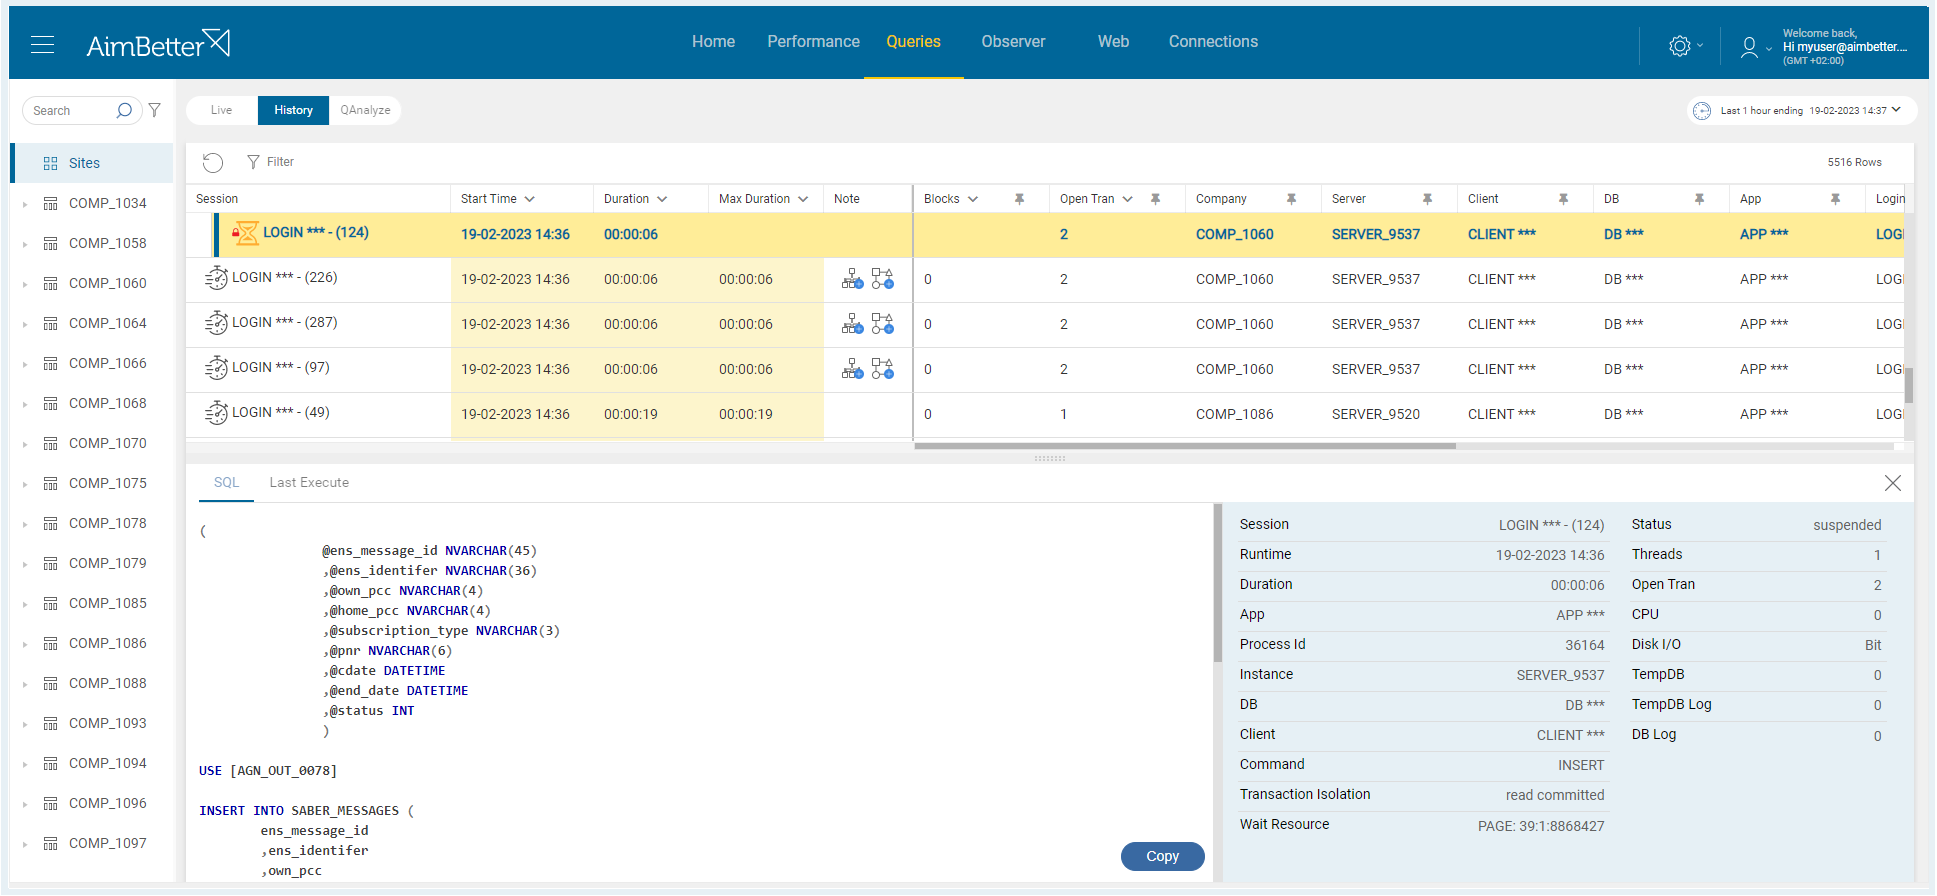
✓ Real-time comprehensive analysis of all queries
✓ Identify blocking queries with users’ details
✓ Multiple filtering options (duration, code, alert type, and more)
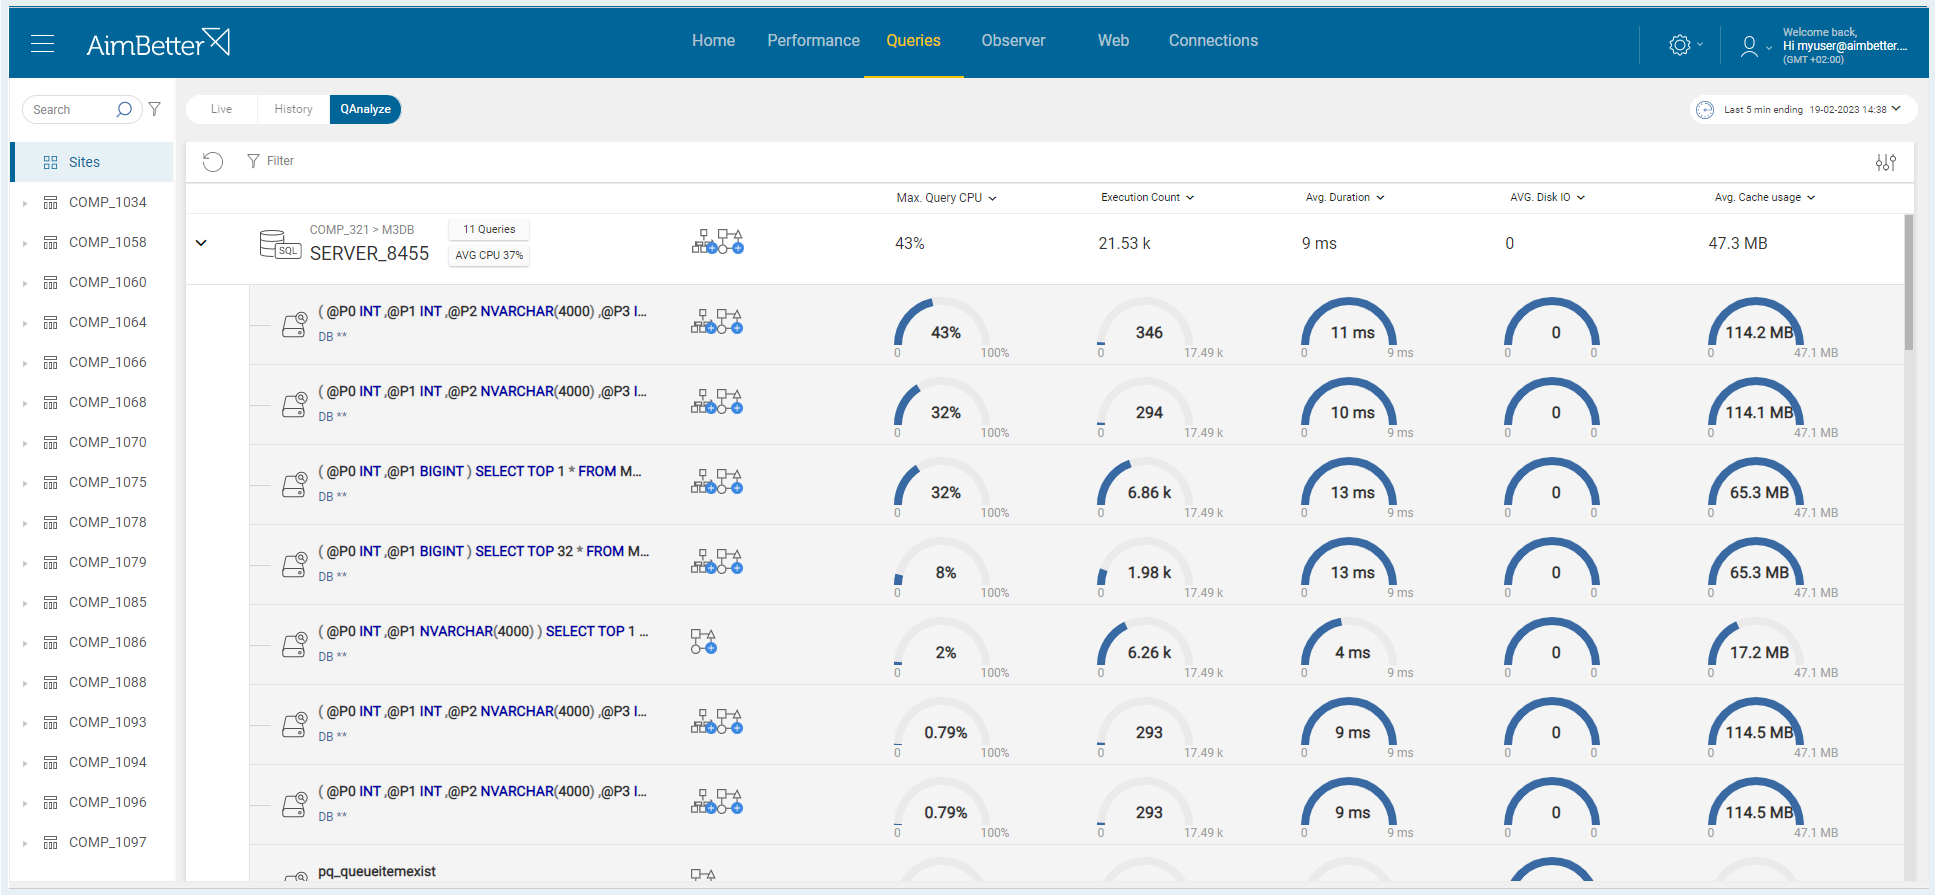
✓ Recommendations for missing index and plan improvements
✓ Queries’ execution plans deep analysis
✓ Resource usage analysis (CPU, memory, execution count, Disk I/O, and Cache).
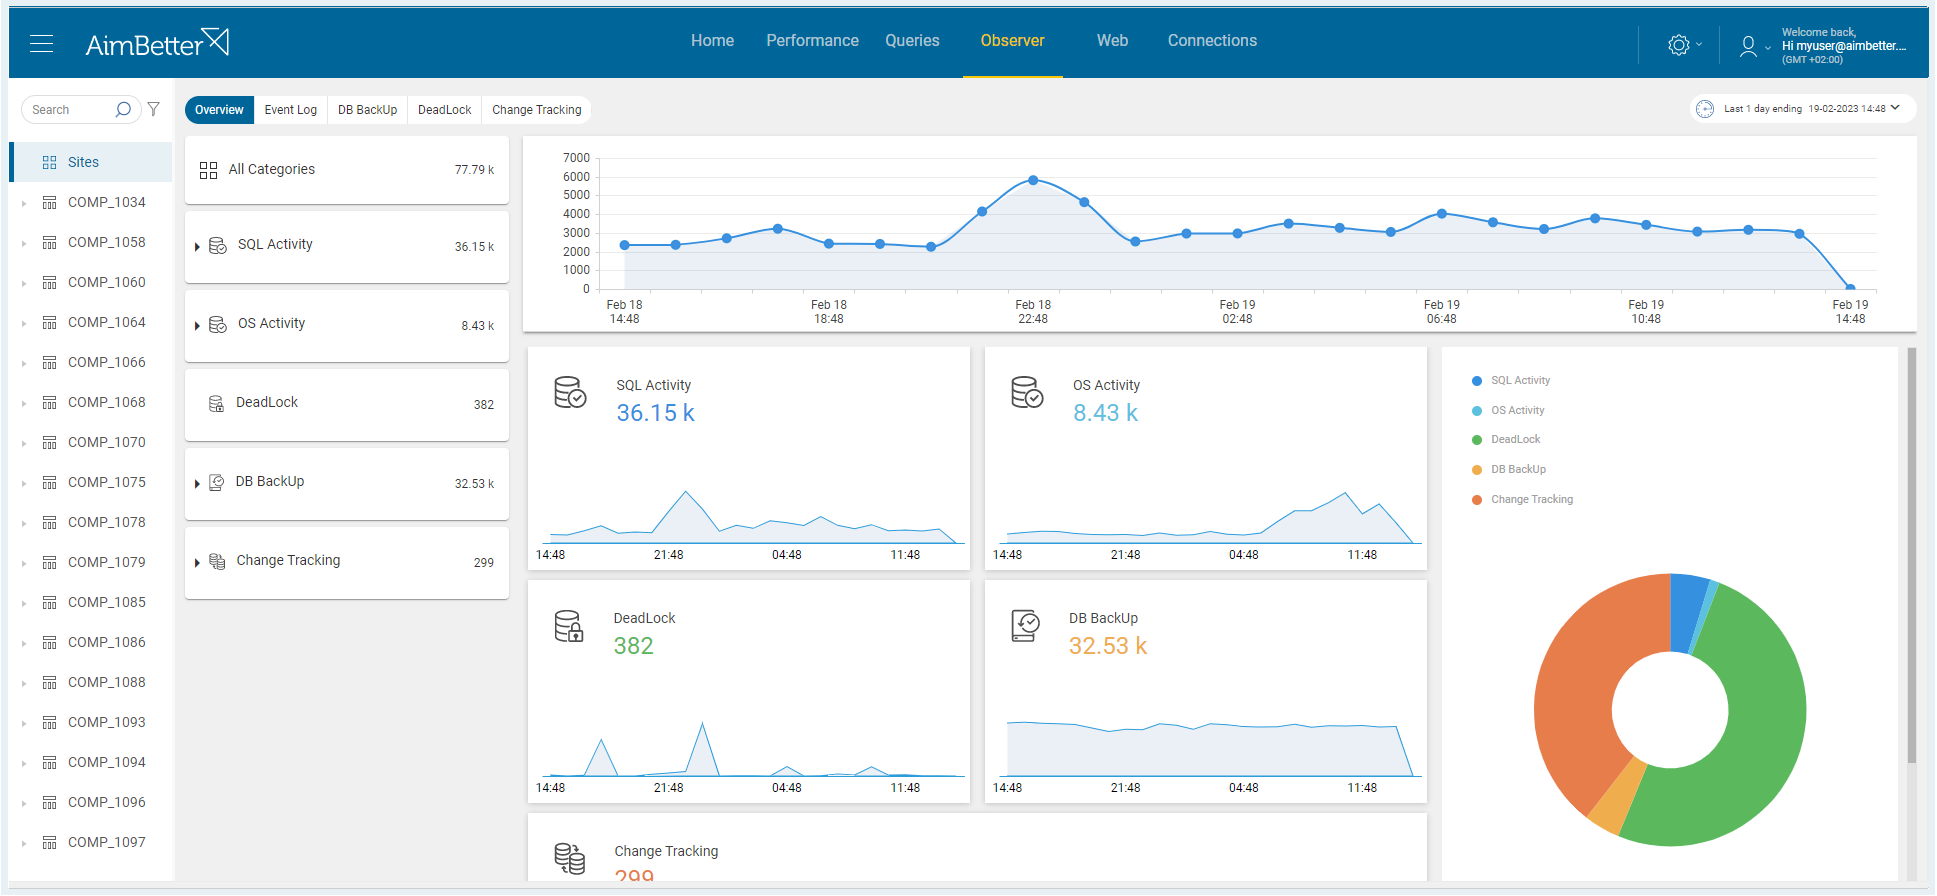
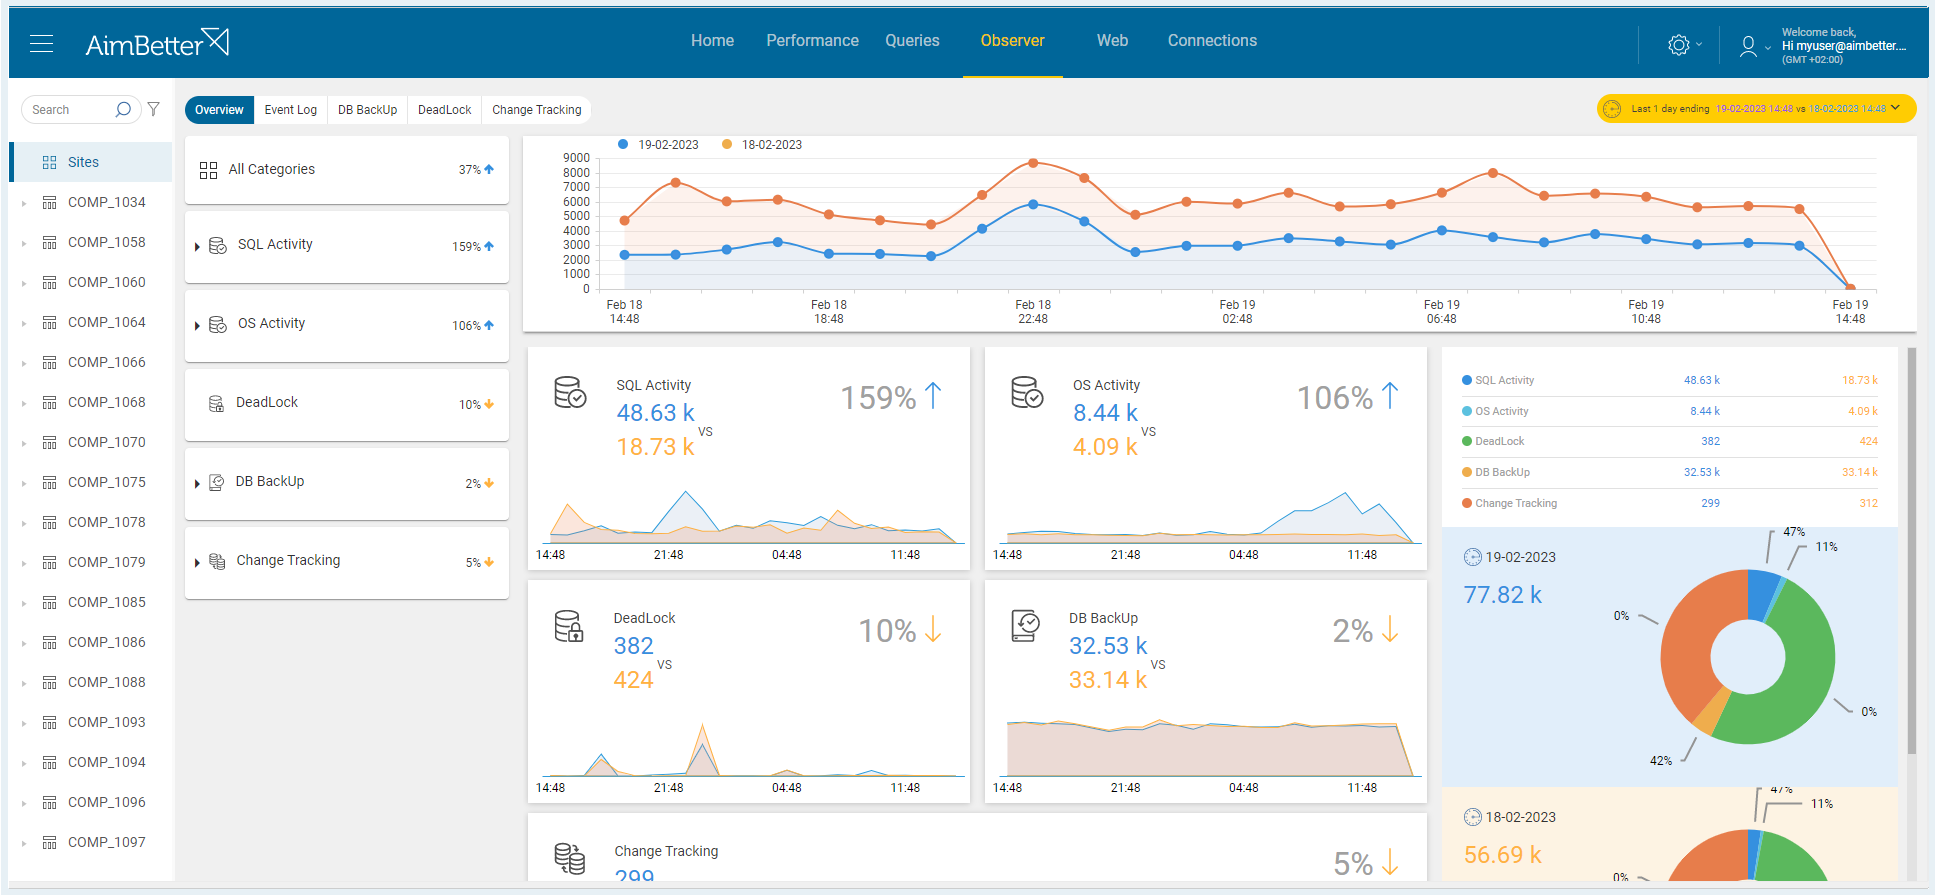
✓ Keep updated on any changes like software installation and updates, database creation, service status changes, and more
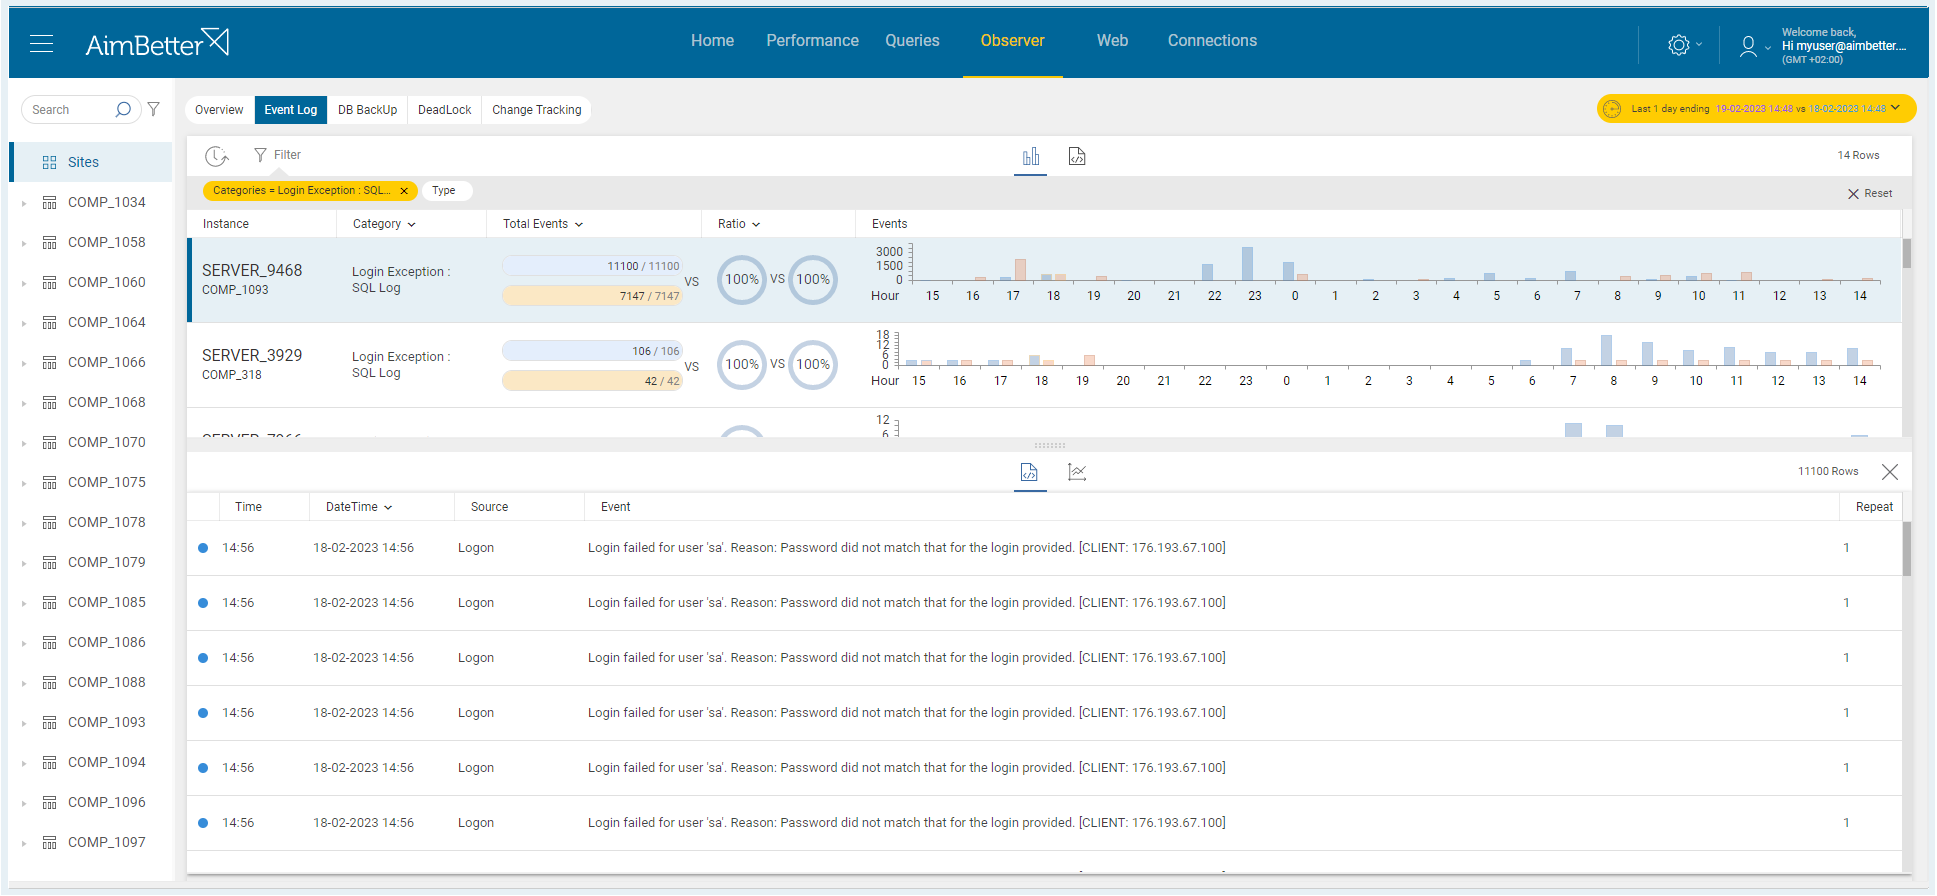
✓ View all the exceptions in both OS and SQL levels with details of when they happened, who was the user, and their description
✓ Recognize abnormal behavior such as login attempts that may pose a serious security breach
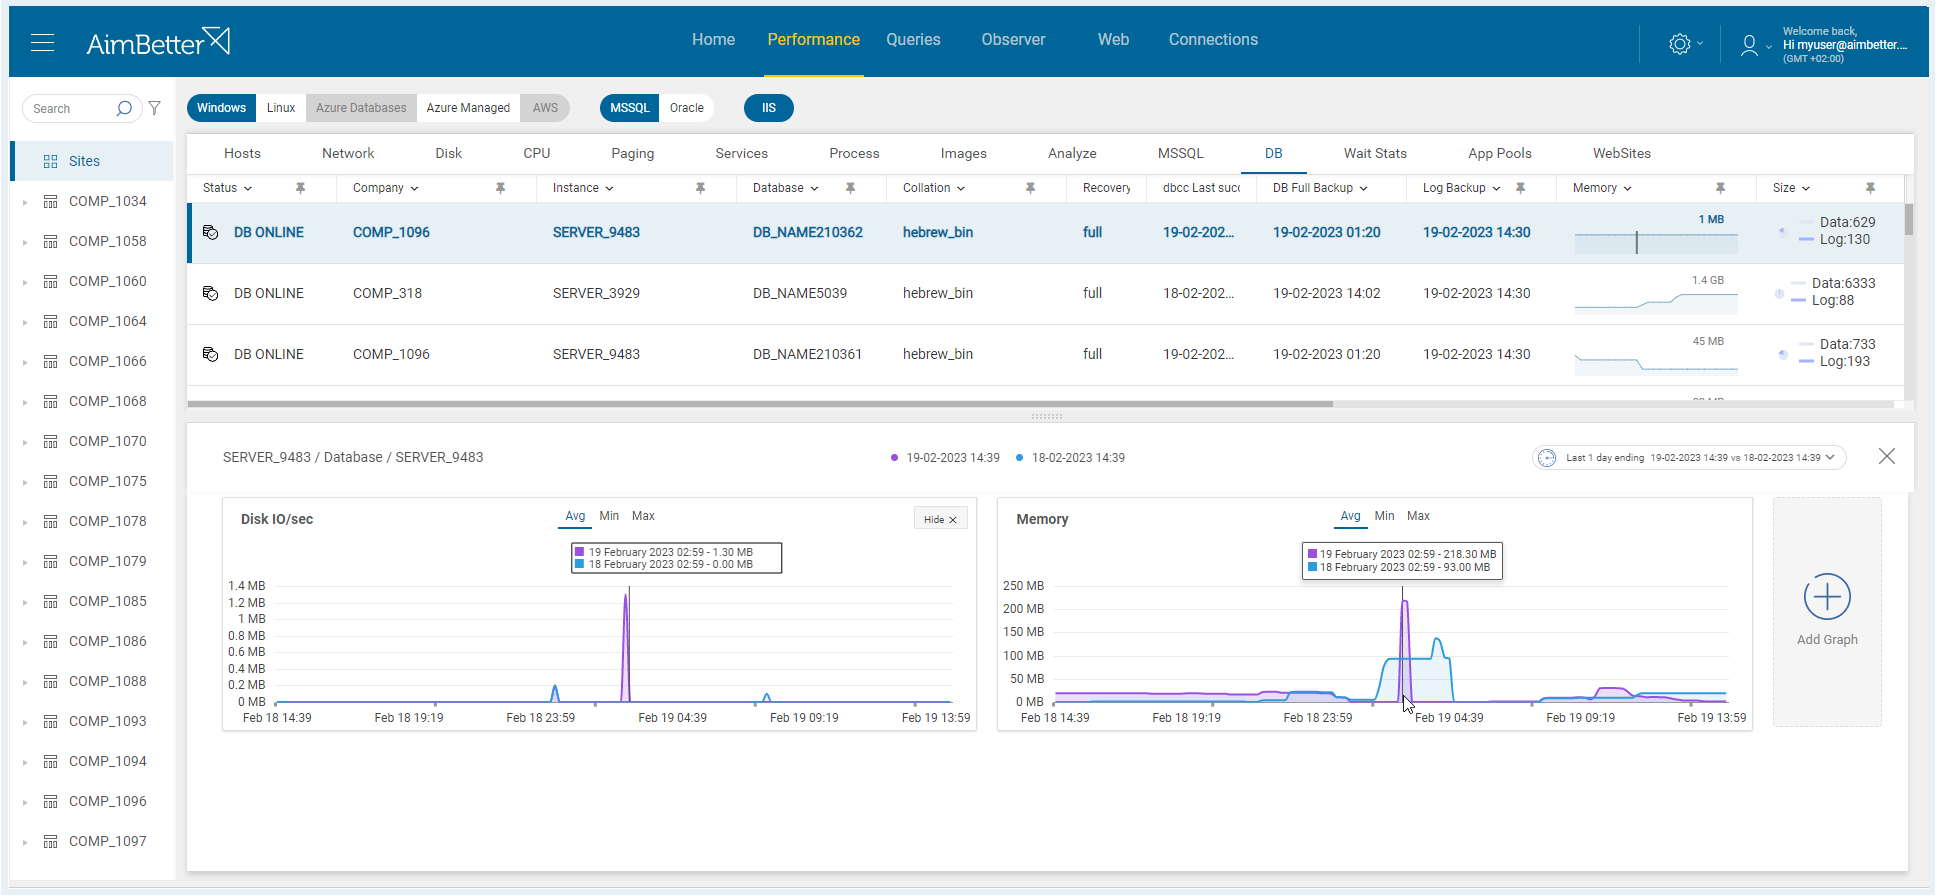
✓ Be aware of the Database backup initiatives and their rightful execution
✓ Understand all the causes and victims from deadlocks
Real-Time Diagnosis
✓ Sys-DB-App-Client Cross-information analysis
✓ Pinpoints the root cause in real-time
✓ Proactive smart notifications
✓ Shortens the Troubleshooting time
✓ ML continuous improvement
✓ Automatically detects code, security, data loss issues, and much more
Powerful DBA Capabilities
✓ Millions of queries/minute
✓ Execution plan analysis and download
✓ Plan improvement recommendations
✓ Missing index suggestions
✓ Top resource-consuming queries
✓ Followup on DB growth and Backups for optimal maintenance
Seamless Integration
✓ 5-minute Installation
✓ Friendly & Intuitive for all the IT Team
✓ Ready to Use Solution
✓ 100% SaaS, no System Overhead
✓ Hundreds of Built-in Metrics
✓ Scalable, great for Enterprise and SMBs


