Among AimBetter’s comprehensive toolset for optimizing database performance, the QAnalyze tab stands out as a powerful tool for efficiently identifying and addressing performance bottlenecks.
Designed to highlight the most resource-intensive queries within a specified timeframe, the QAnalyze is a central component of AimBetter’s suite. Whether it’s excessive CPU consumption, frequent executions, or intensive I/O operations, this tab provides a detailed breakdown of the queries exerting the greatest strain on the database system.
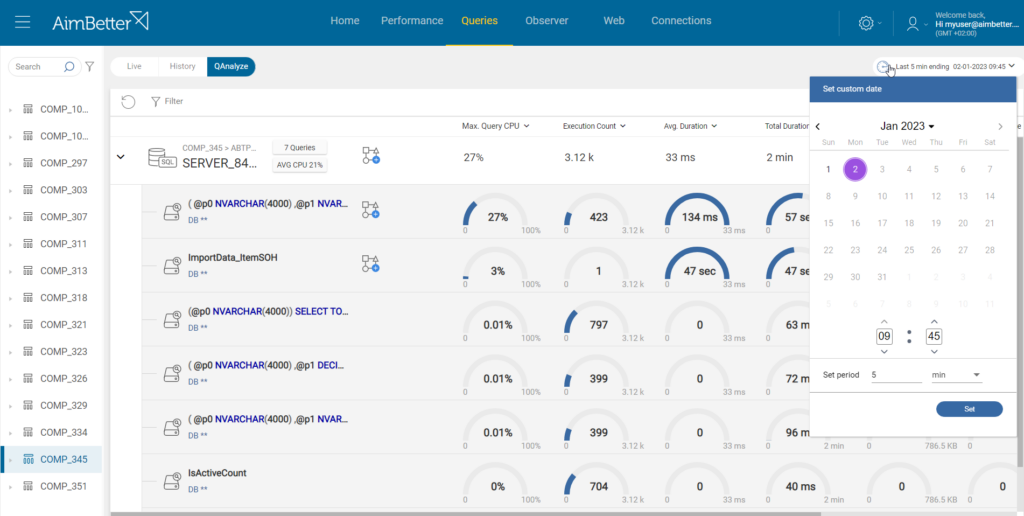
By default, it showcases the most impactful queries over the last five minutes, allowing database administrators to pinpoint areas of concern quickly. However, users have the flexibility to adjust the timeframe using the intuitive “Calendar Bar,” tailoring the analysis to specific intervals of interest.
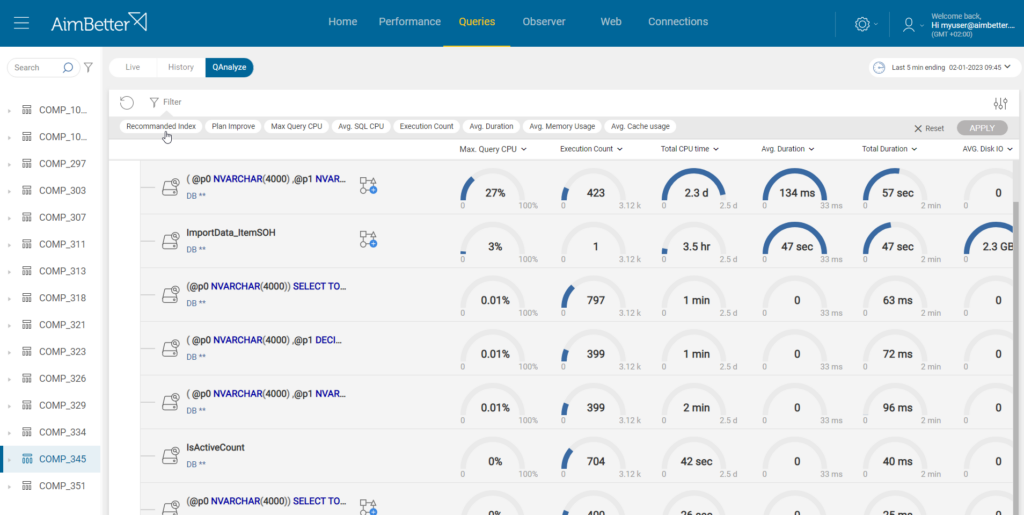
Key performance indicators displayed for each query include maximum CPU consumption, execution count, average duration, total disk usage, total rows affected, total duration, average cache usage, total CPU time, average disk I/O, and total cache usage. This granular insight enables administrators to assess the overall impact of individual queries on system resources.
Moreover, the QAnalyze tab goes beyond mere observation by offering actionable recommendations for query optimization. Users can access plan improvement suggestions, index recommendations, and detailed execution plans directly within the interface. Armed with this information, administrators can devise targeted strategies to enhance query efficiency and overall database performance.
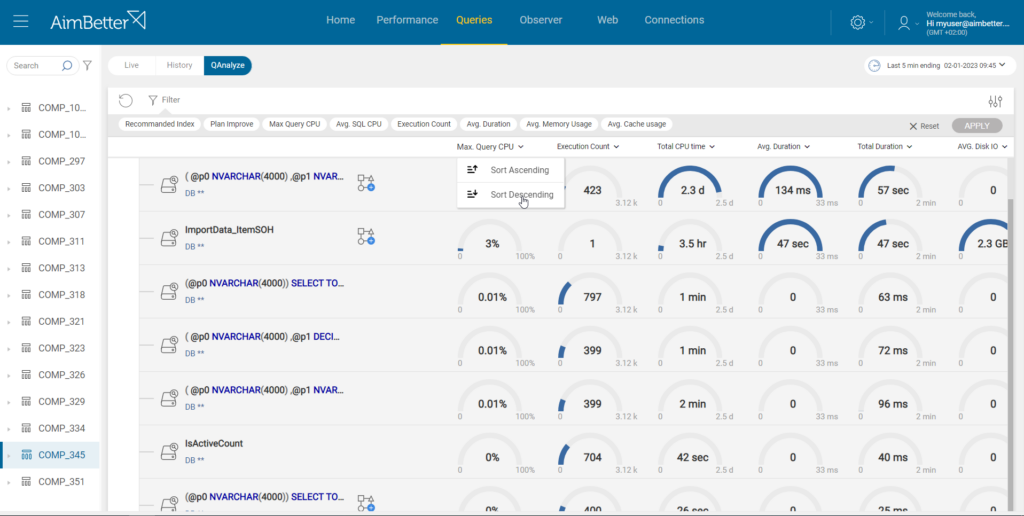
Navigating through the QAnalyze tab is intuitive, with options to filter queries based on specific conditions such as recommended indexes, plan improvement recommendations, or execution count thresholds. This allows administrators to focus their attention on queries that warrant immediate attention, streamlining the optimization process.
Furthermore, the tab’s interactive interface facilitates the dynamic exploration of query data. Users can sort columns with a simple click, enabling quick identification of top offenders based on criteria such as maximum CPU usage. This interactive functionality enhances usability and accelerates the troubleshooting process.
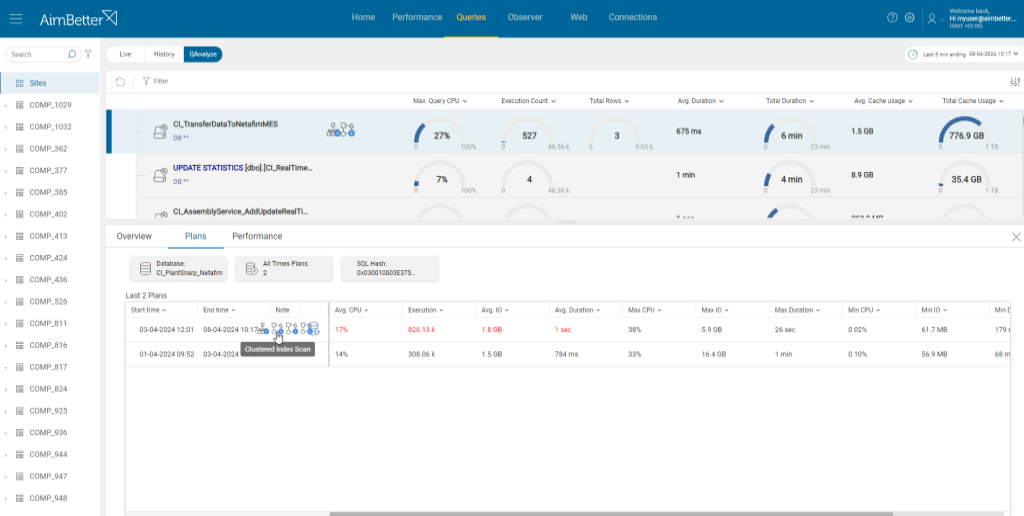
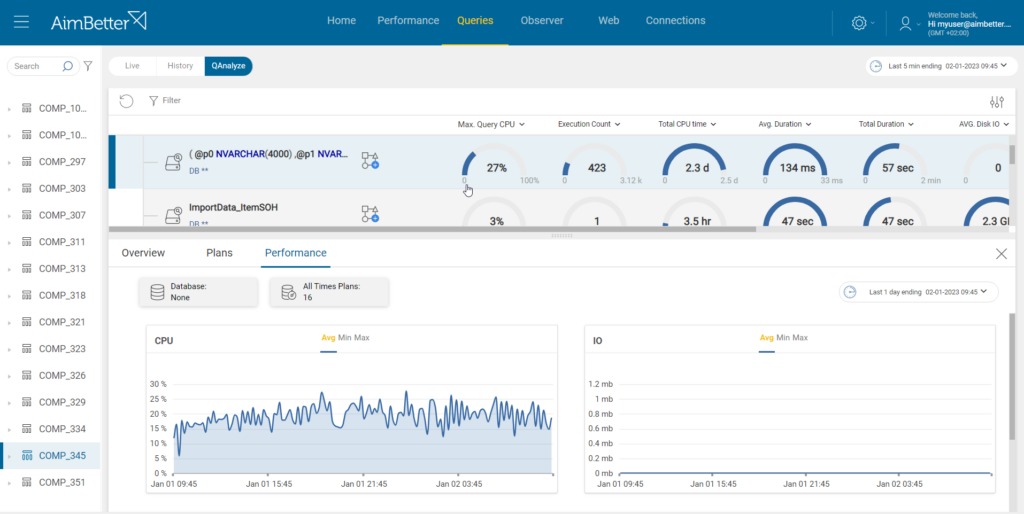
One notable feature of the QAnalyze tab is its ability to provide historical performance trends for individual queries. By clicking on a specific query, users can access a detailed window displaying the query script, execution plans, and performance metrics over time. This historical perspective is invaluable for identifying recurring issues and monitoring the effectiveness of optimization efforts.
The AimBetter’s QAnalyze tab empowers database administrators with the insights and tools needed to maximize database performance. By highlighting resource-intensive queries, offering actionable recommendations, and providing historical context, this feature facilitates proactive performance management and ensures the smooth operation of database systems. With the QAnalyze tab at their disposal, organizations can unlock the full potential of their databases while delivering optimal user experiences.