“AimBetter represents NextGen database monitoring – providing powerful cloud tools to identify problems on the spot.”
by Rony Shoshani, Operations Manager
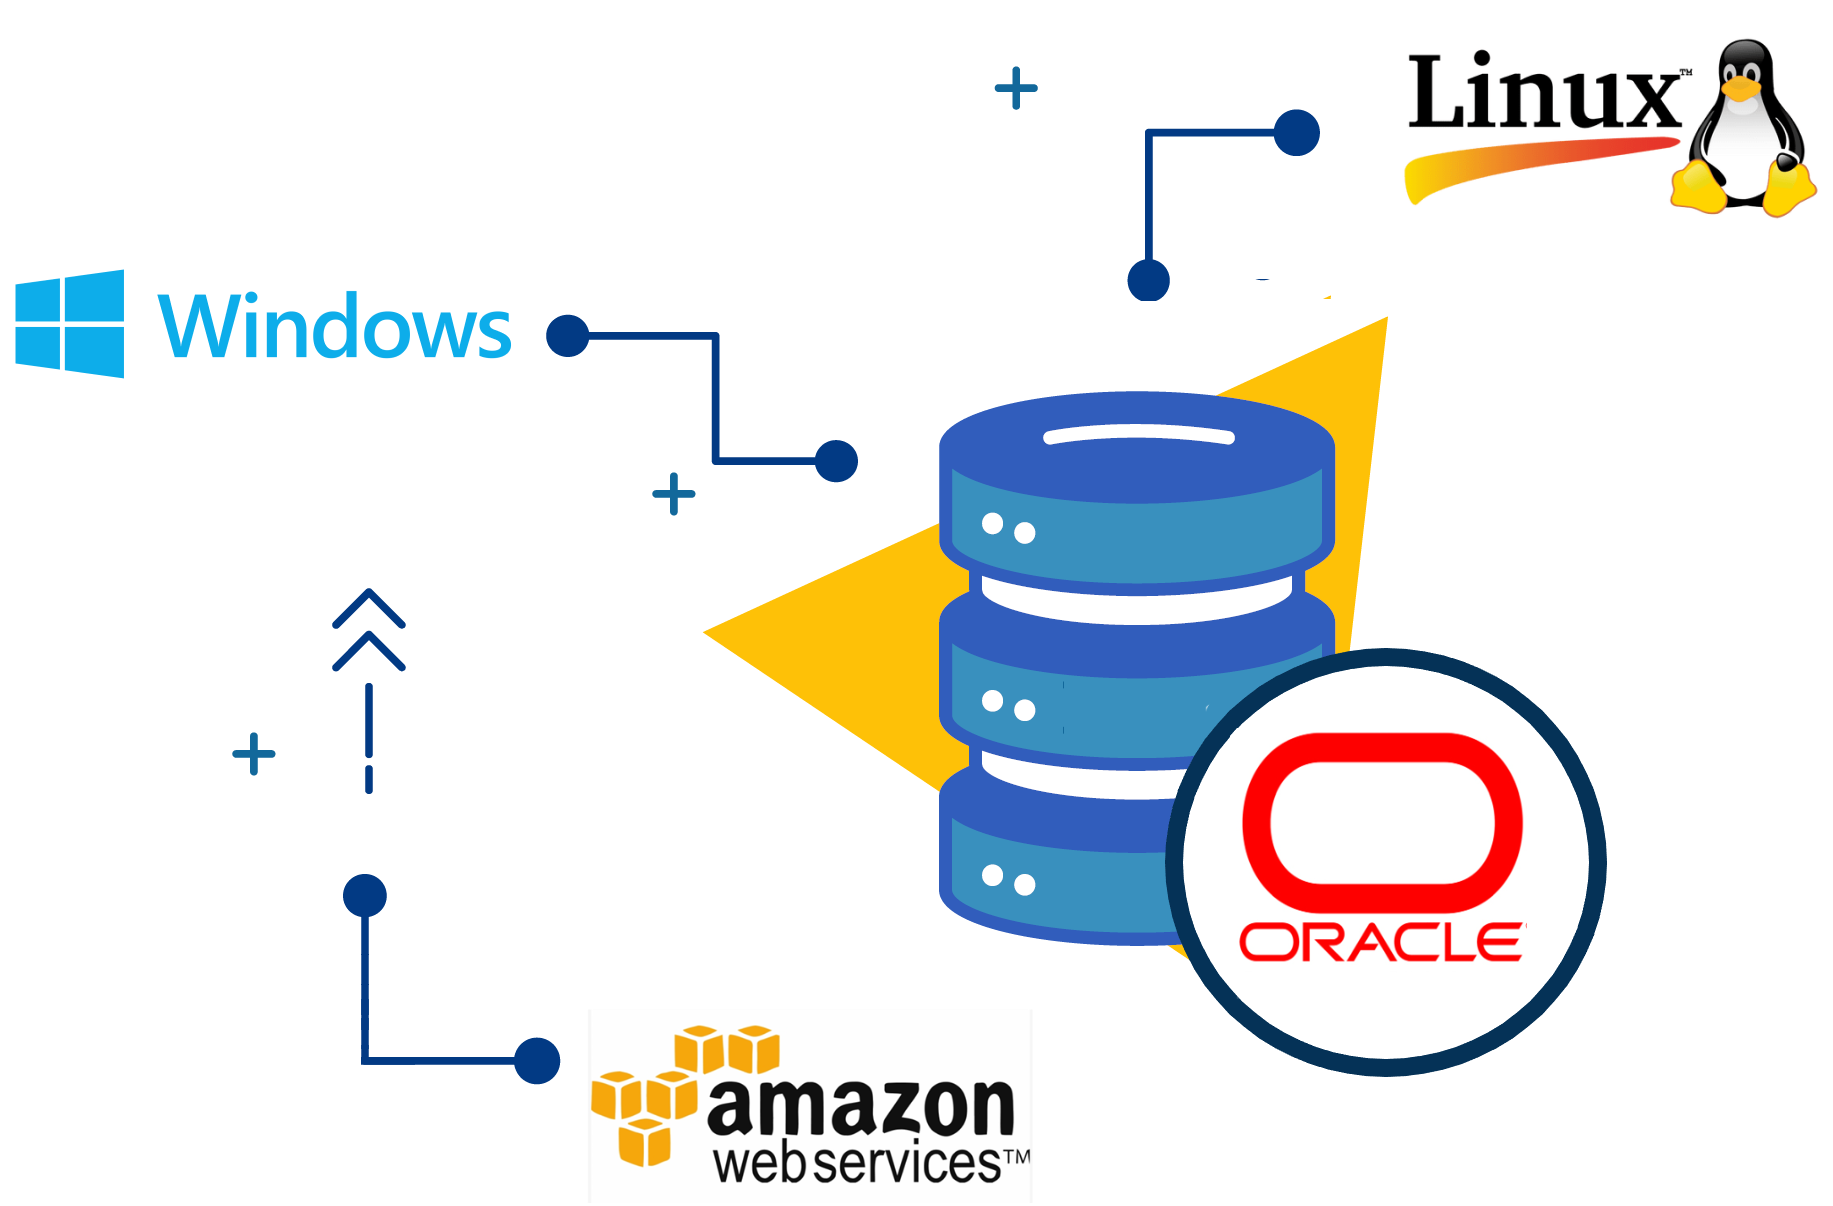
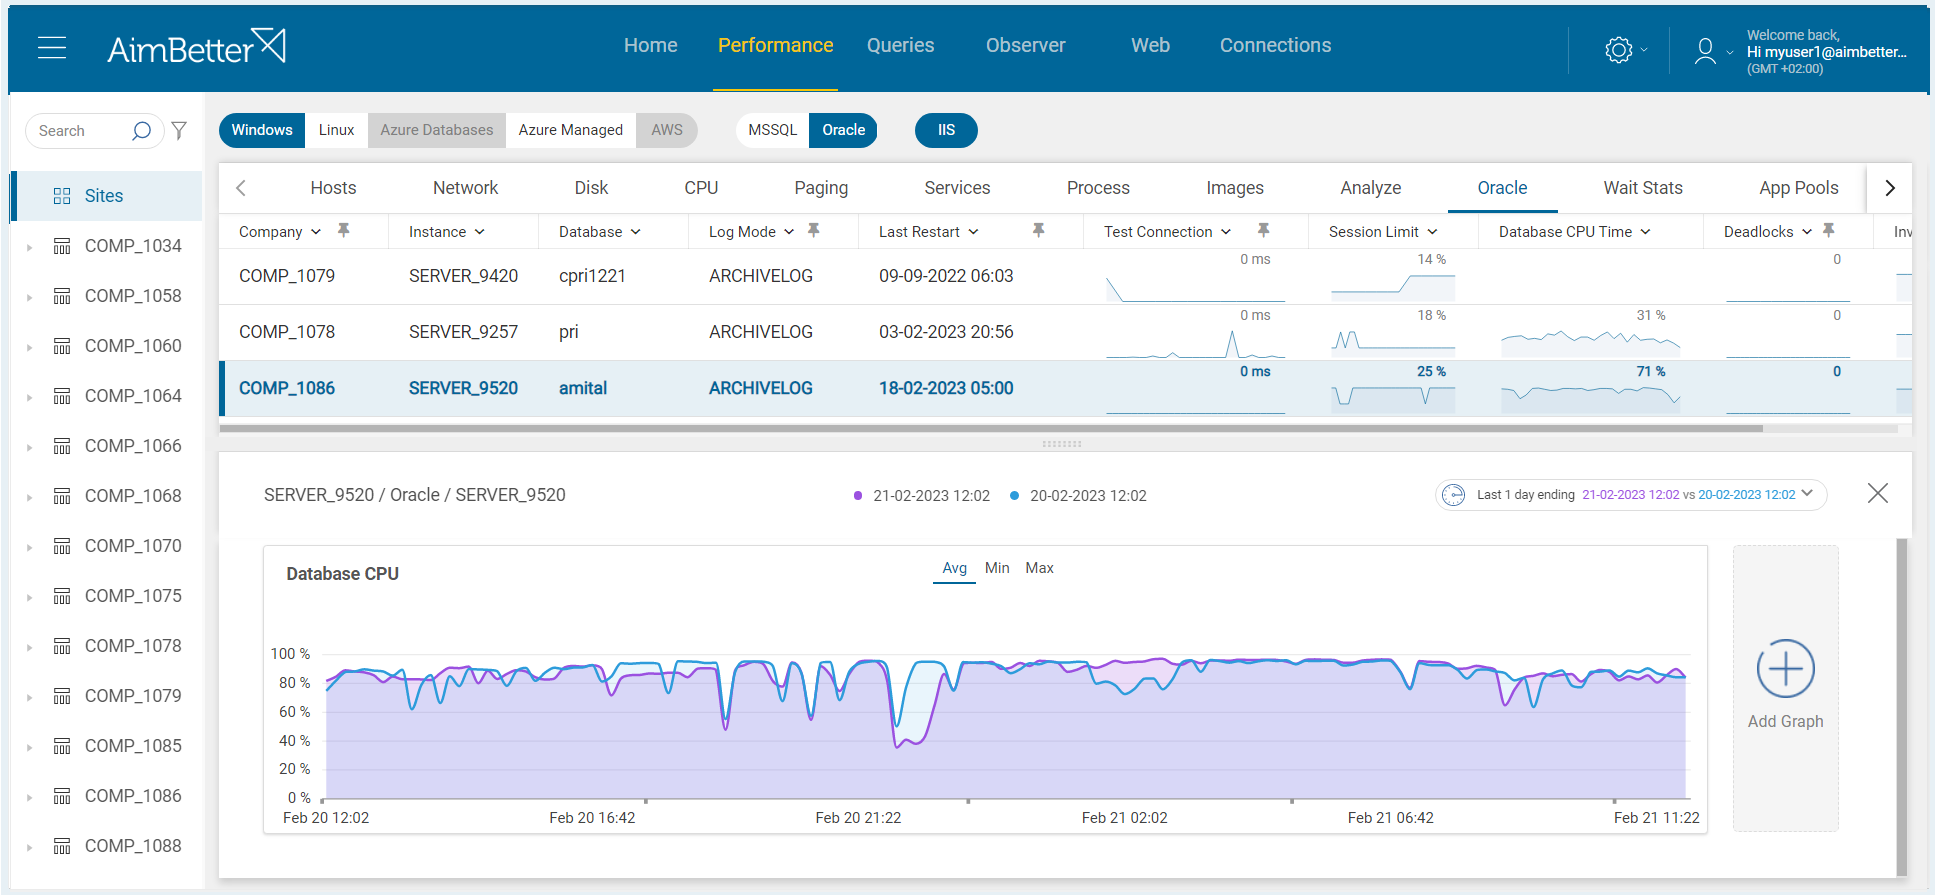
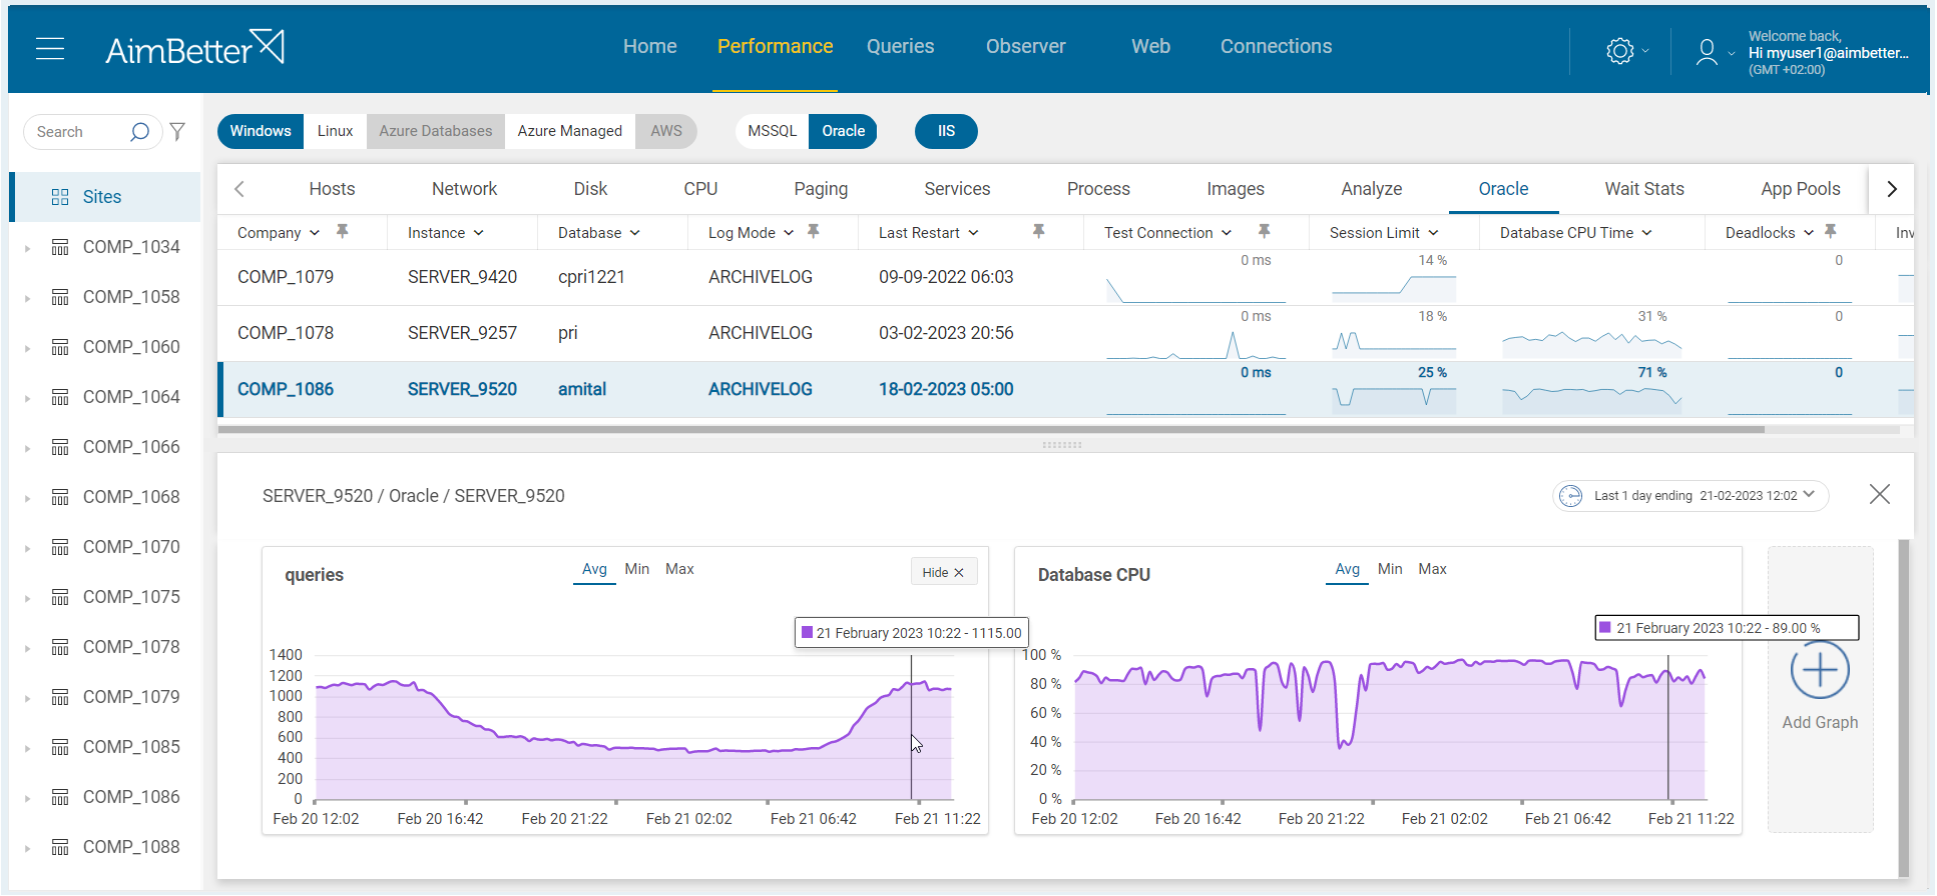
Gain complete visibility and control over your Oracle Database server environment. AimBetter Oracle RTPS delivers real-time performance insights that help you improve efficiency, maximize uptime, and make informed optimization decisions.
Easily identify the root cause of performance issues—whether originating from application code, inefficient execution plans, operating system limitations, or hardware constraints—saving valuable time and reducing operational costs.
AimBetter’s unique licensing model is flexible and cost-efficient.
You can tailor your costs based on data retention and analysis periods, up to 30 days, and switch between servers and plans anytime.
Contact us for more information.
1. System – The Operating System layer, Windows or Linux.
2. Resources – The server´s resources, including CPU, memory, hard disk, and network.
3. Oracle Database – The Oracle Database Management System.
4. Queries – the fourth layer is the queries that run in the Database System.
5. Processes – the fifth layer includes the interaction between the Database System with its clients (real users and system automation), through the processes initiated by these client applications.
6. Exceptions – the sixth layer refers to the exception mechanism used by the other layers that communicate events and errors occurring constantly on the system.
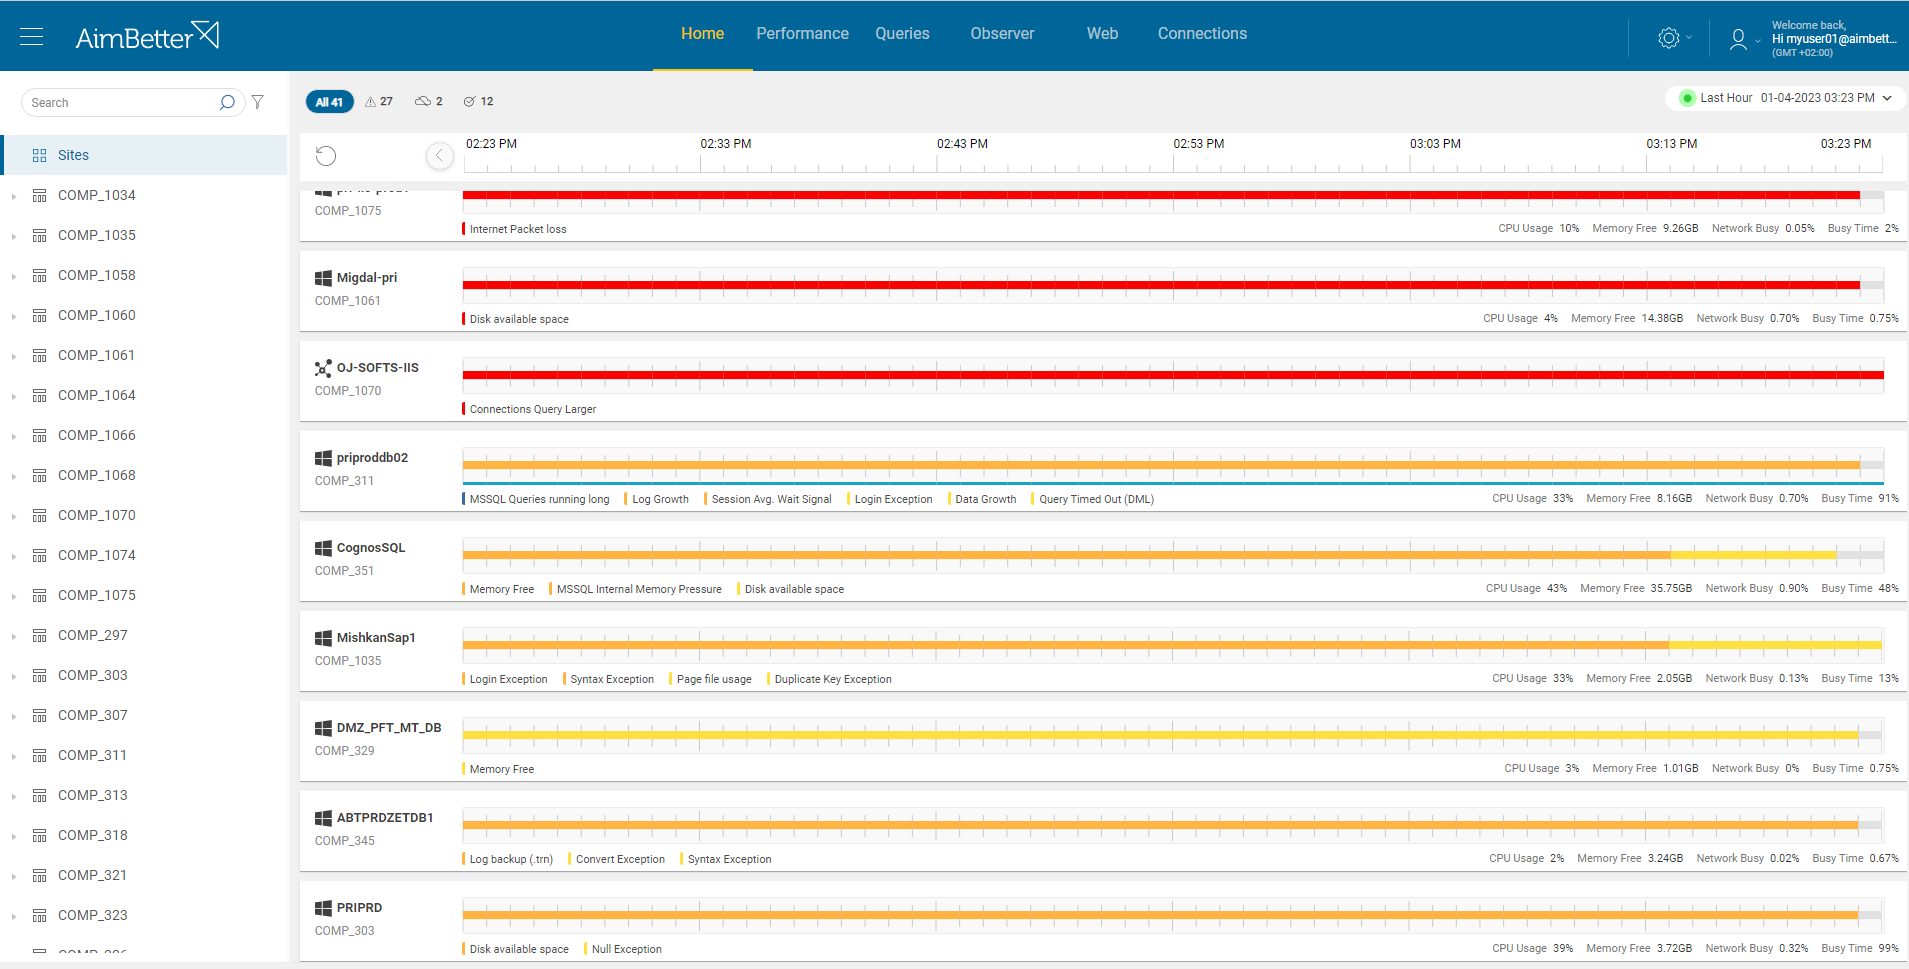
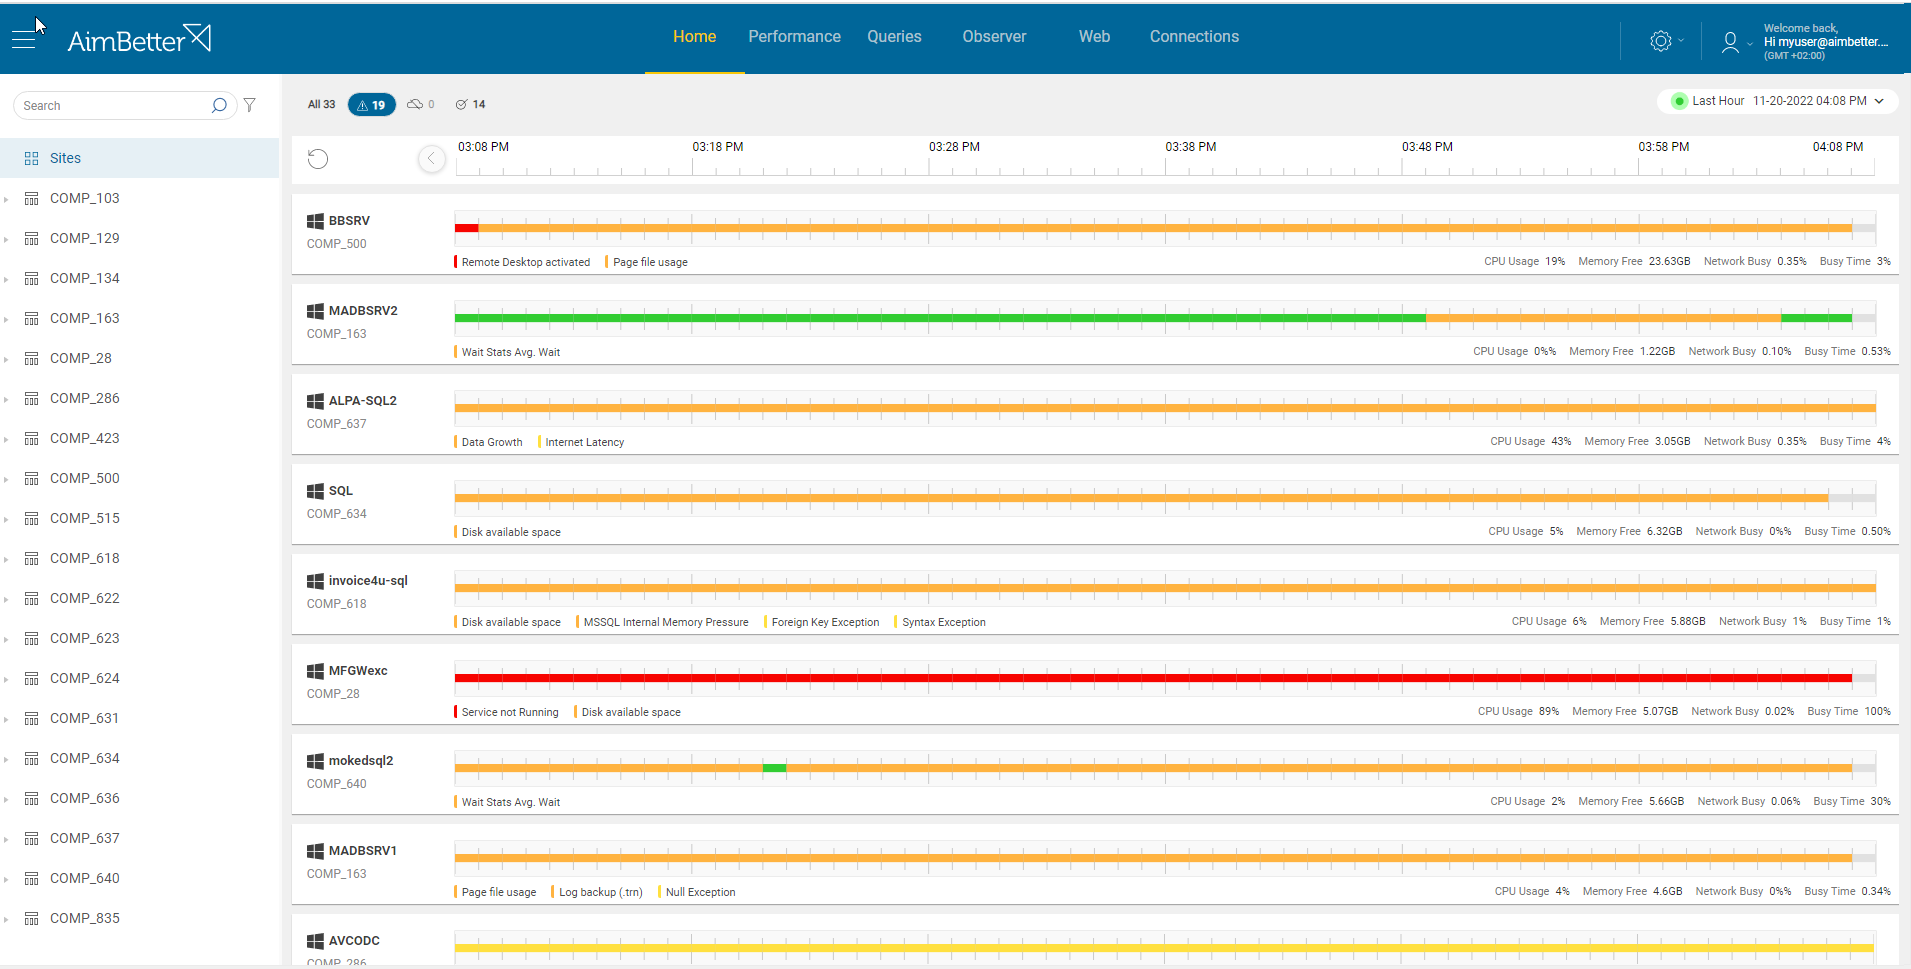
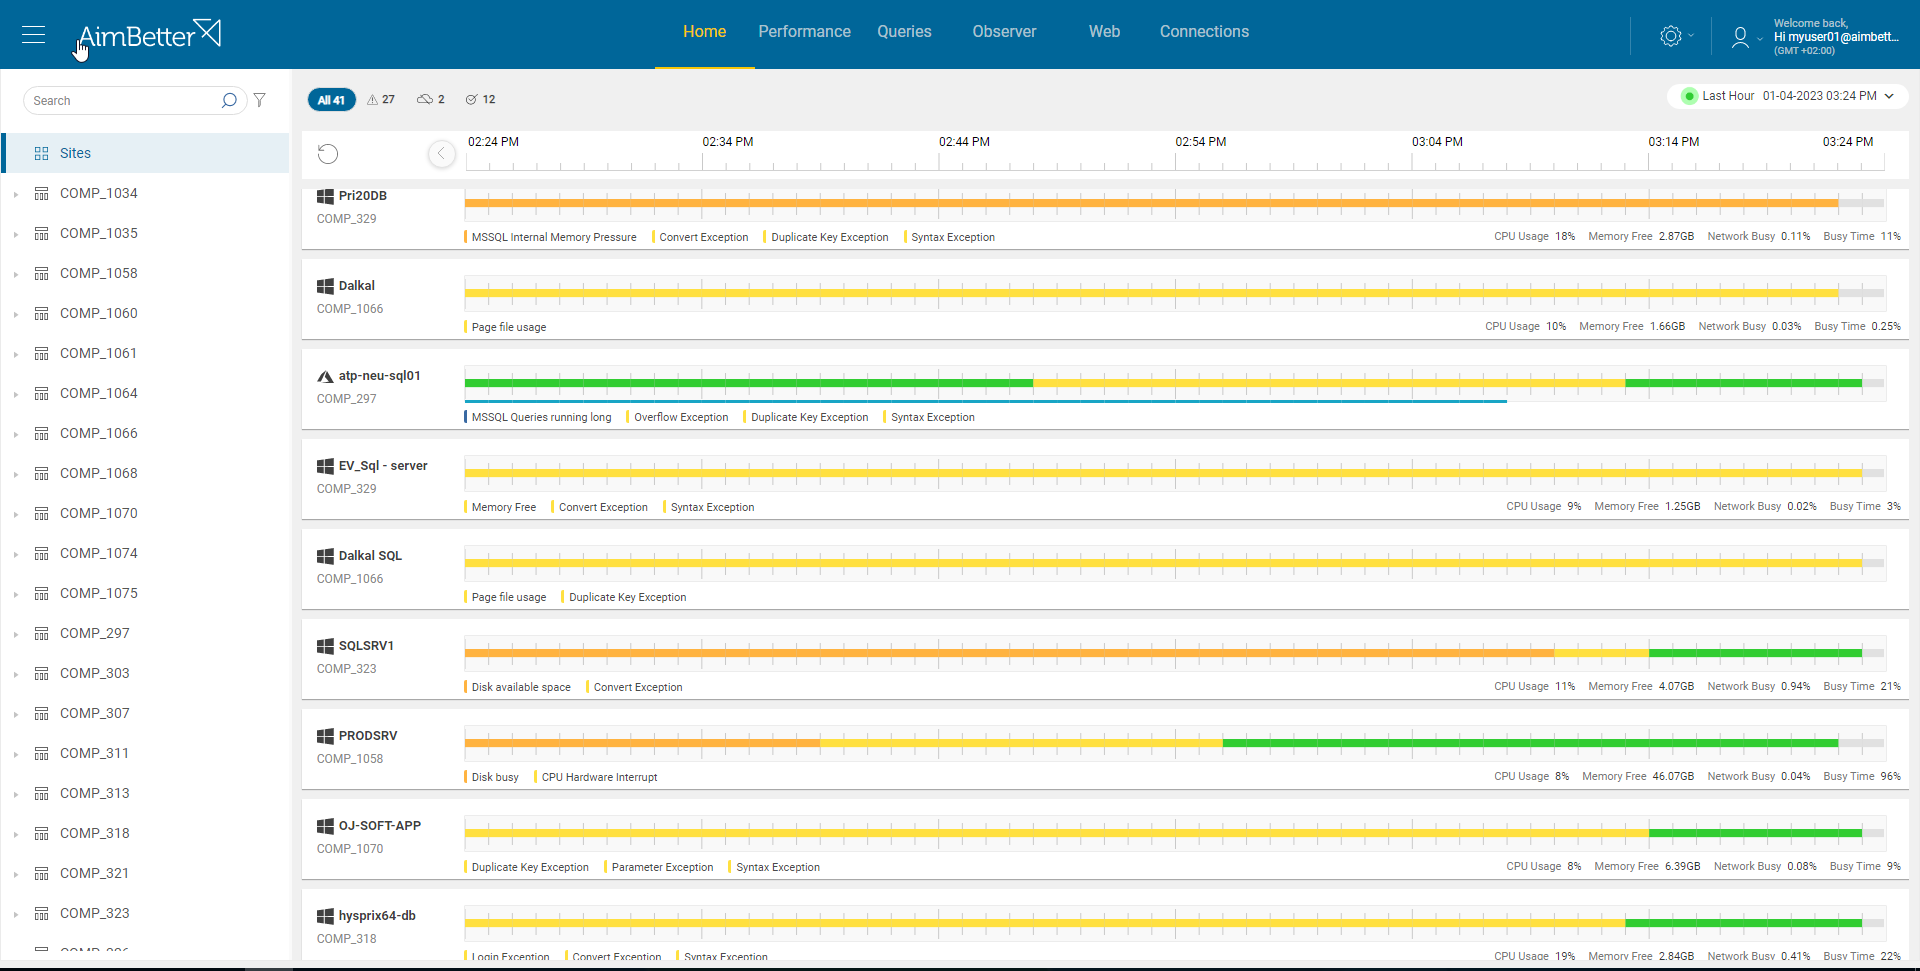
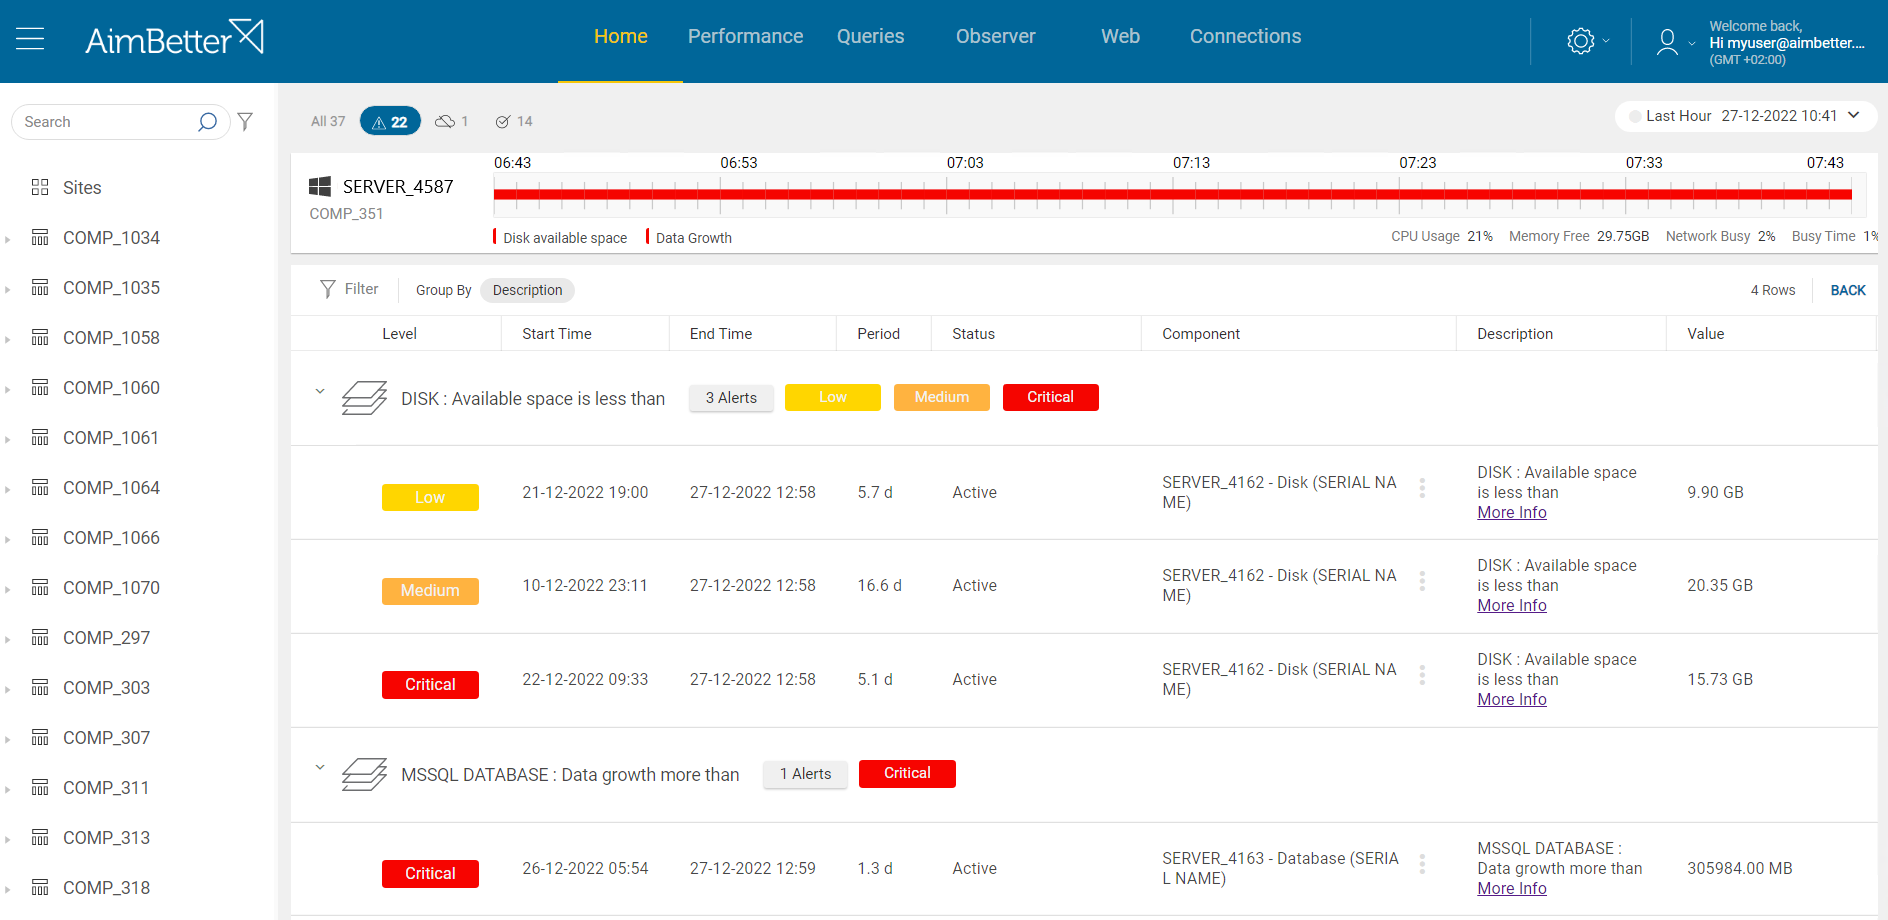
✓ Quickly identify and address the most urgent cases.
✓ Scroll over the bars and discover the current challenges to be addressed
✓ Choose which servers to focus on by selecting the hierarchical layer (All, Company, Host, or Server)
✓ Get details in seconds by clicking on the status bar
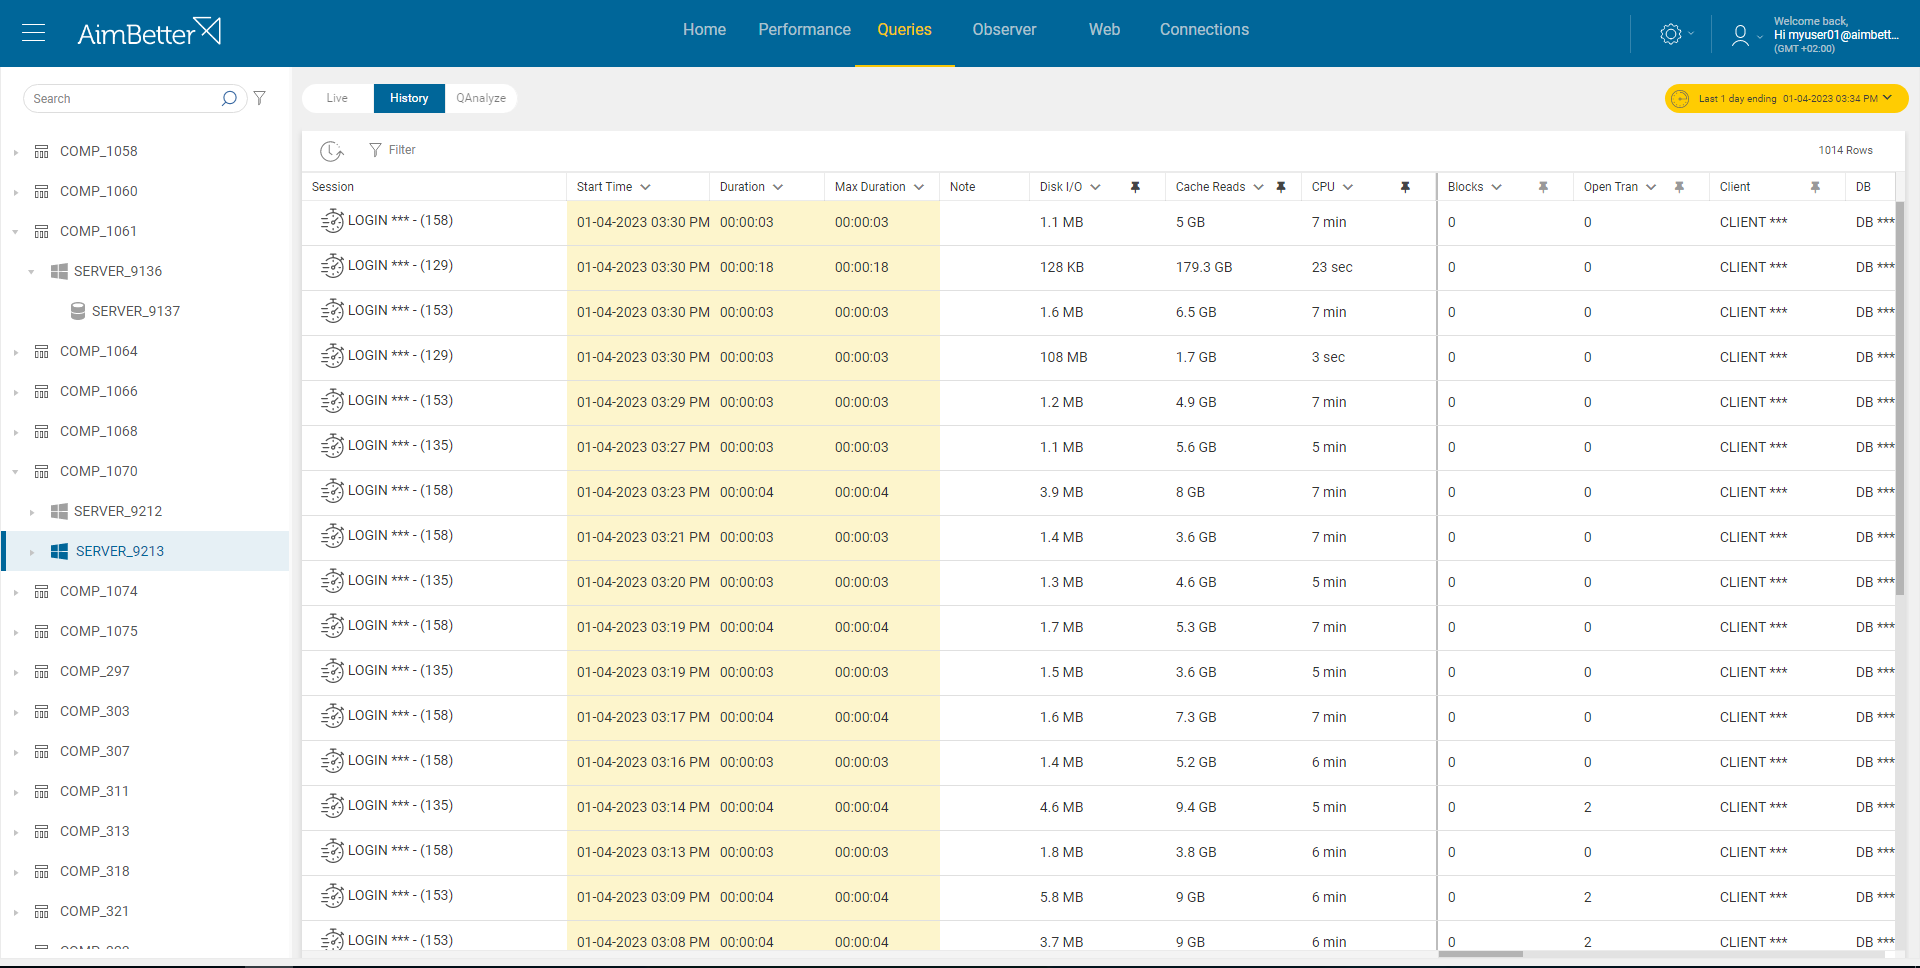
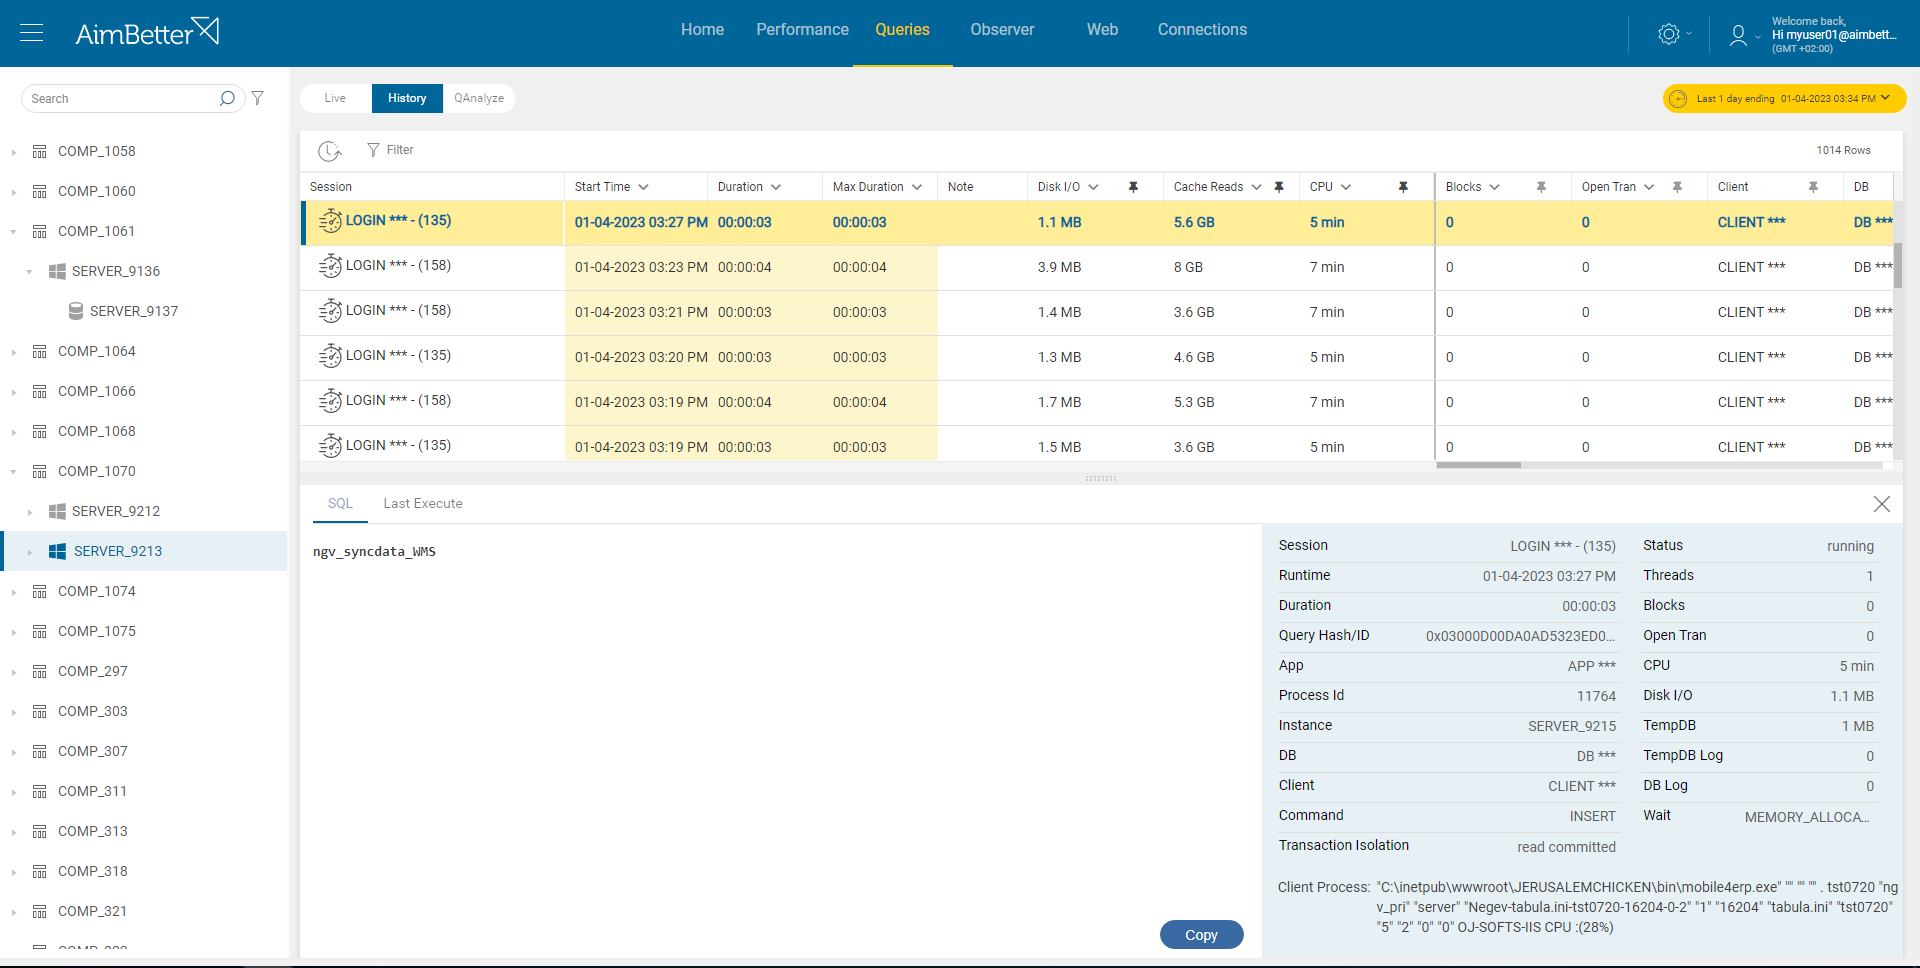
✓ Real-time comprehensive analysis of all queries
✓ Identify blocking queries with users’ details
✓ Multiple filtering options (duration, code, alert type, and more)
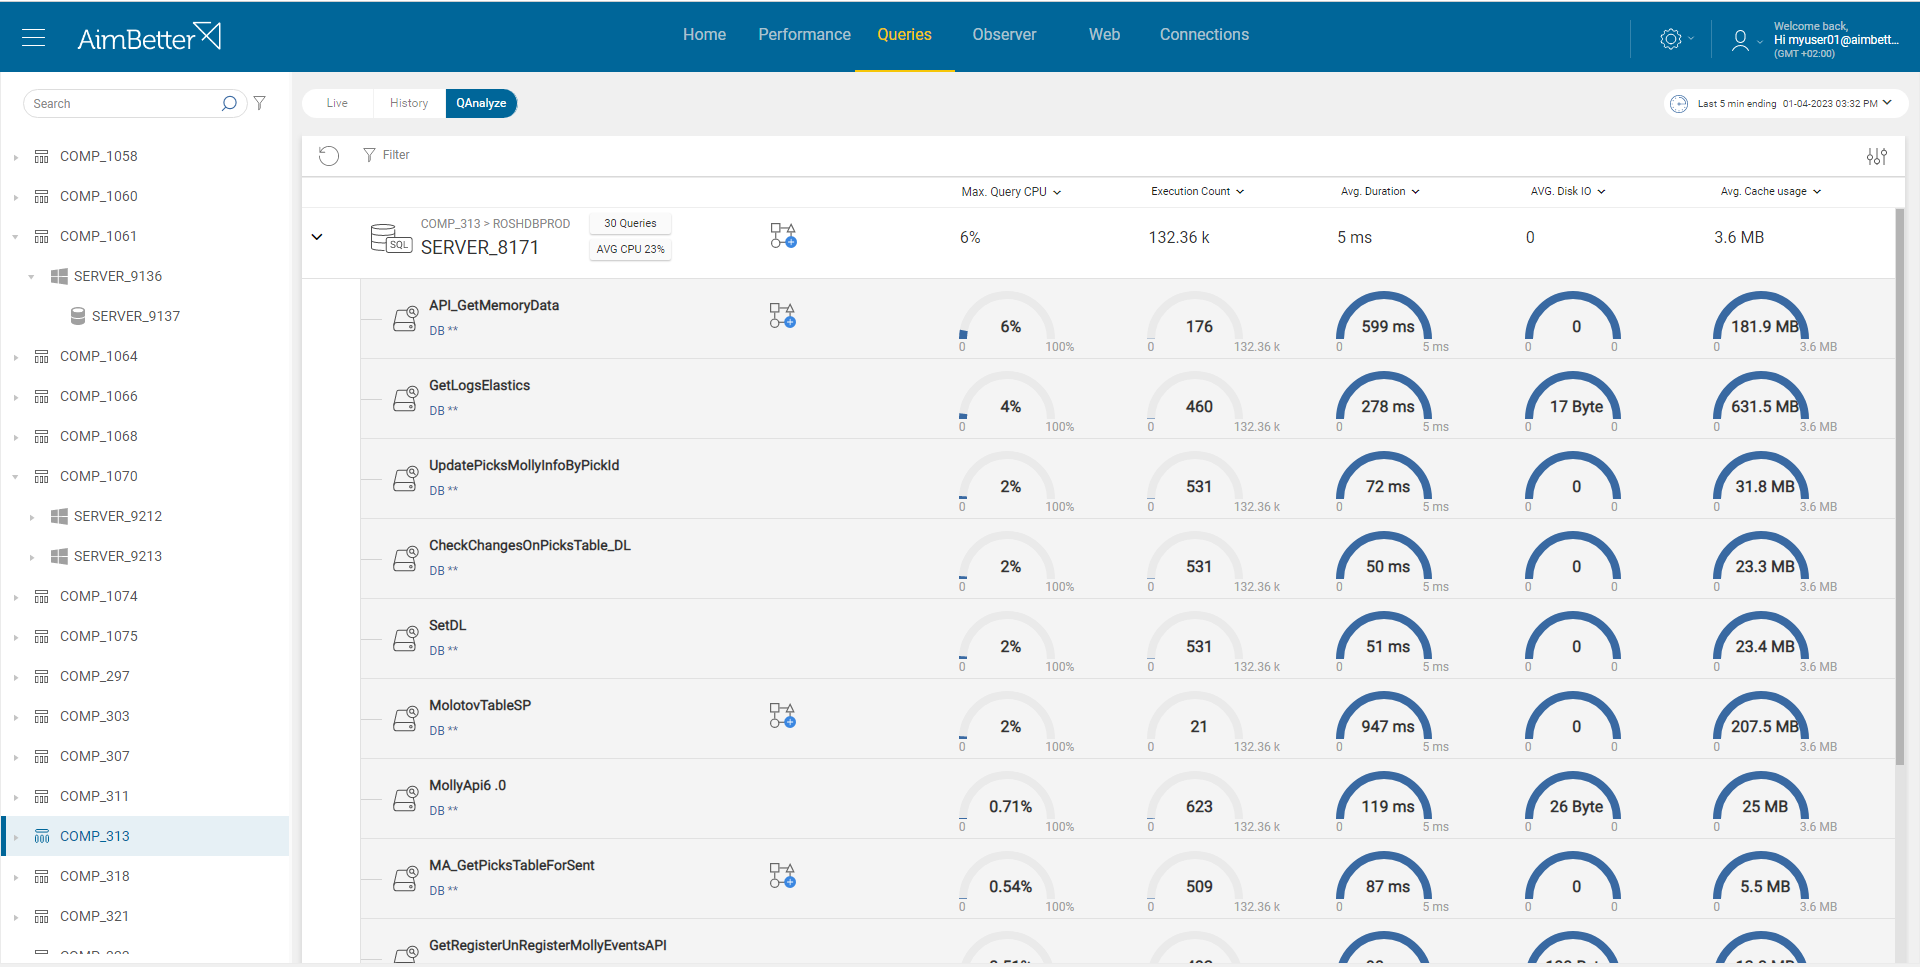
✓ Recommendations for missing index and plan improvements
✓ Queries’ execution plans deep analysis
✓ Resource usage analysis (CPU, memory, execution count, Disk I/O, and Cache).
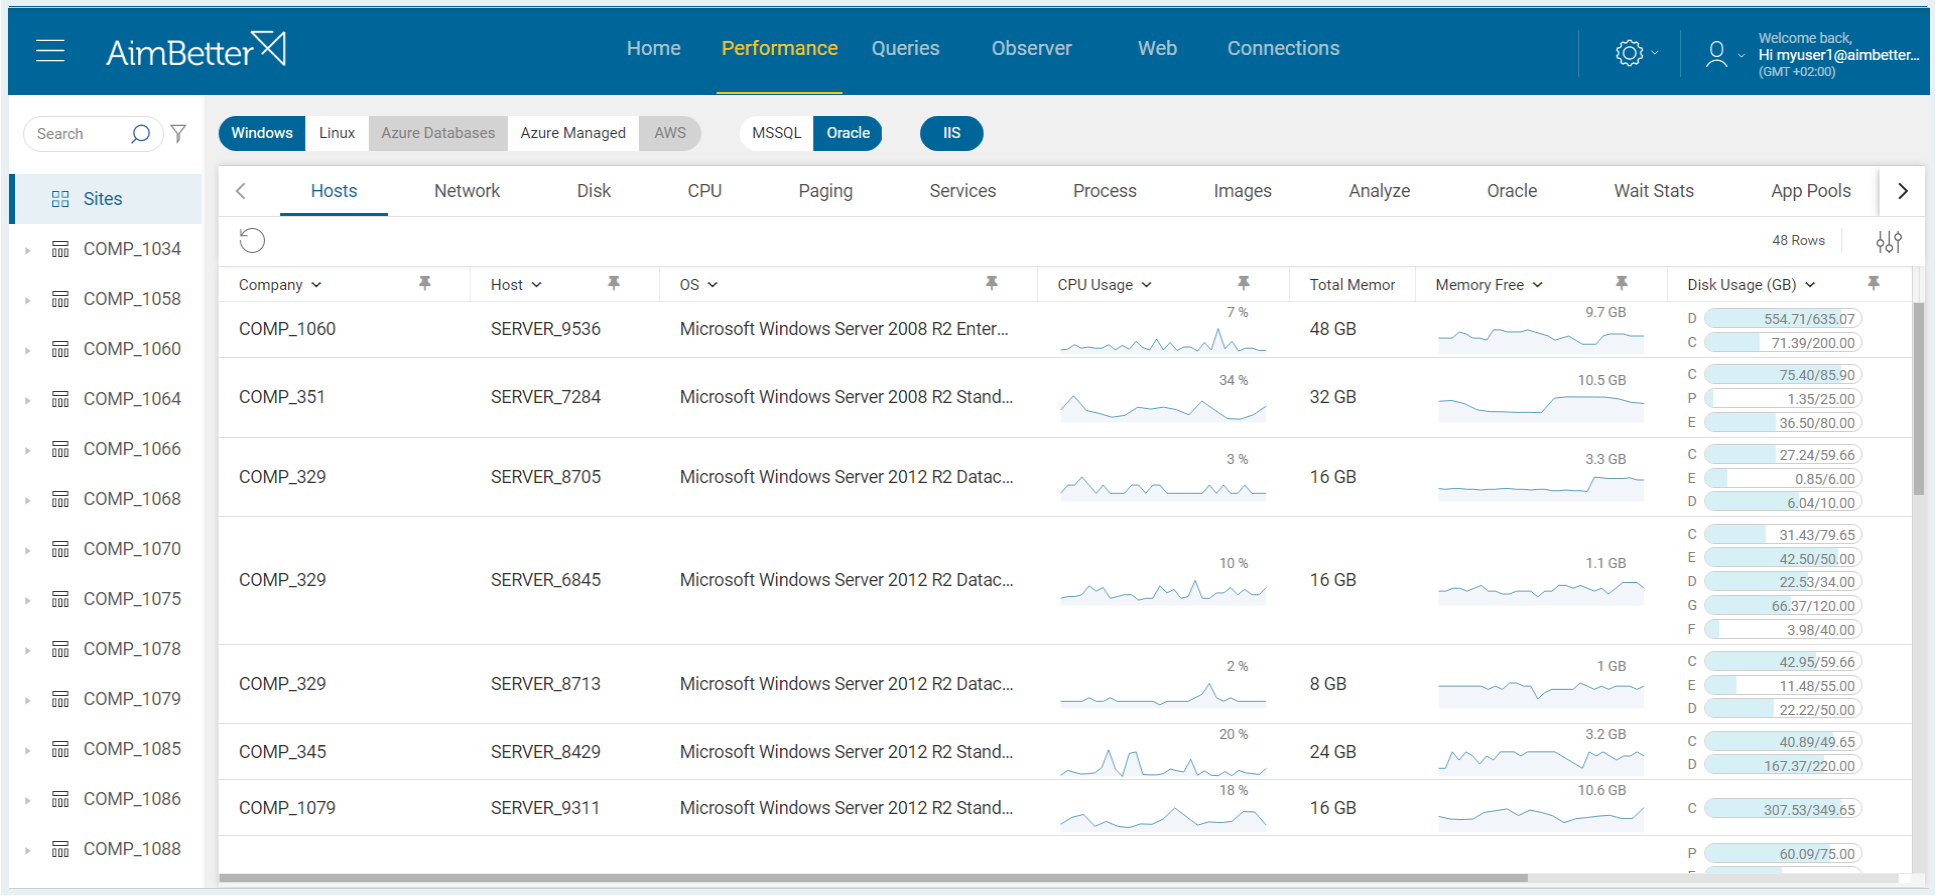
✓ Real-time alerts 24/7
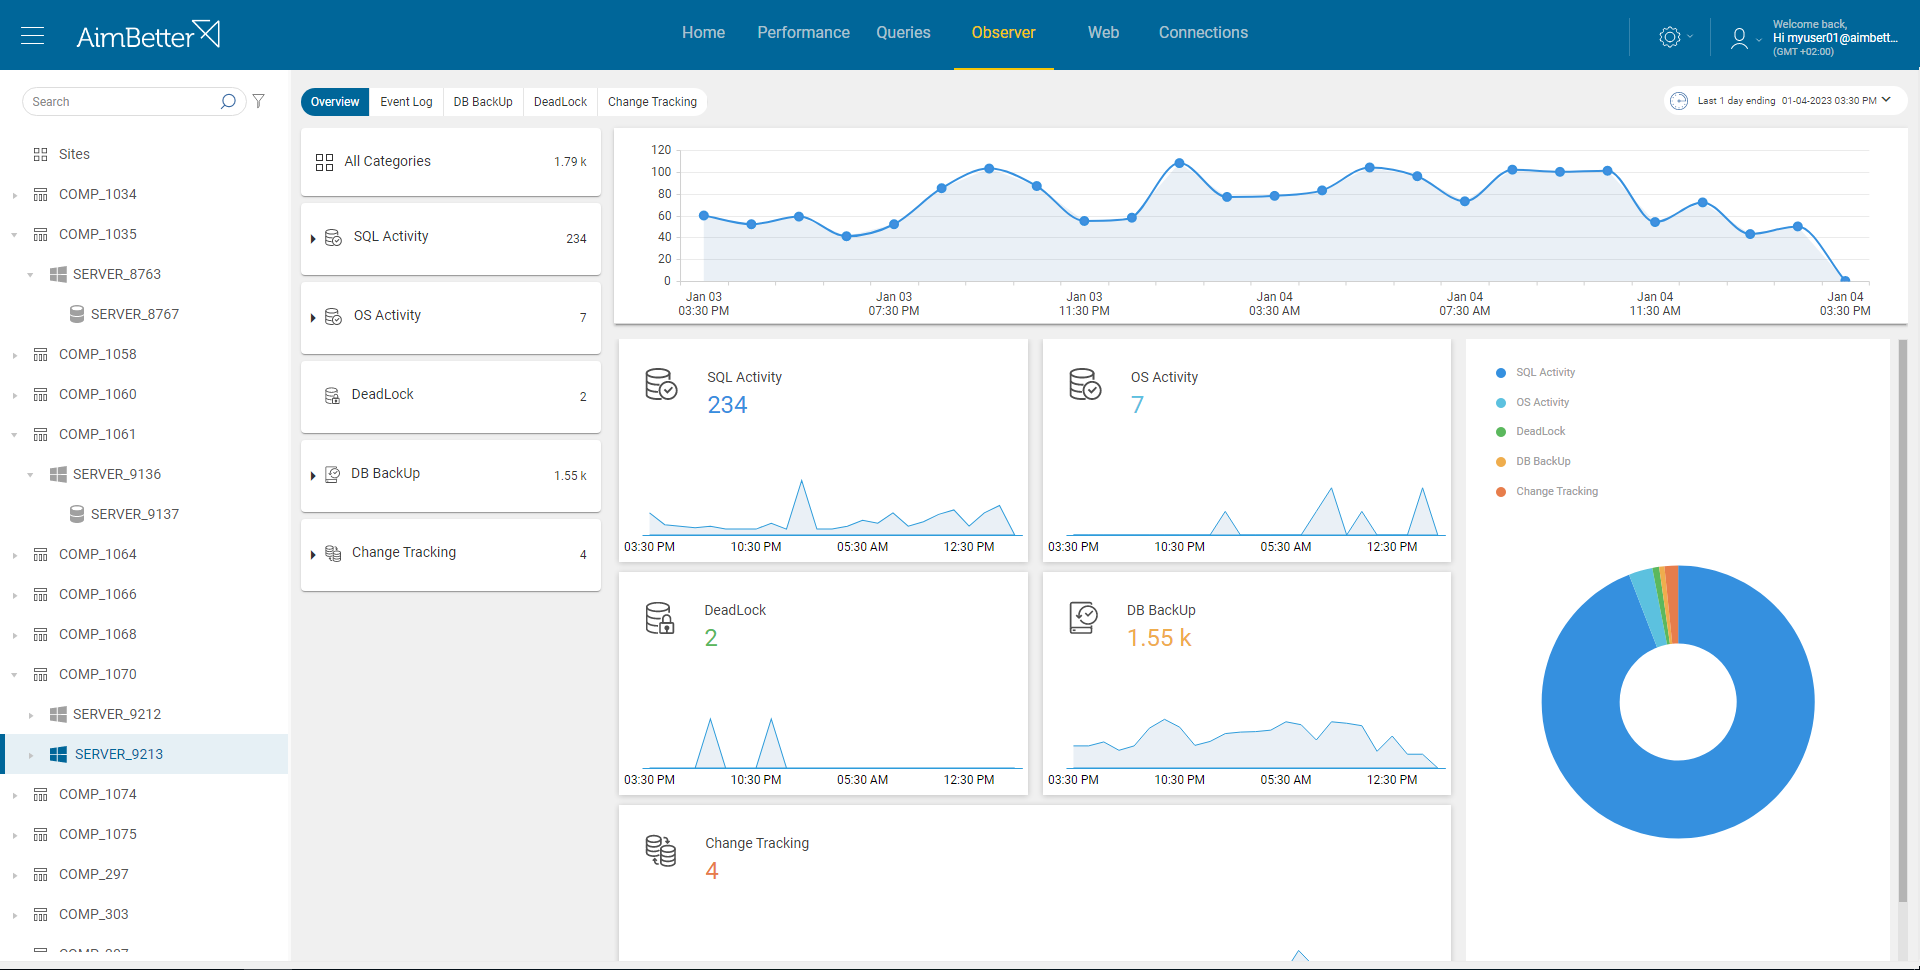
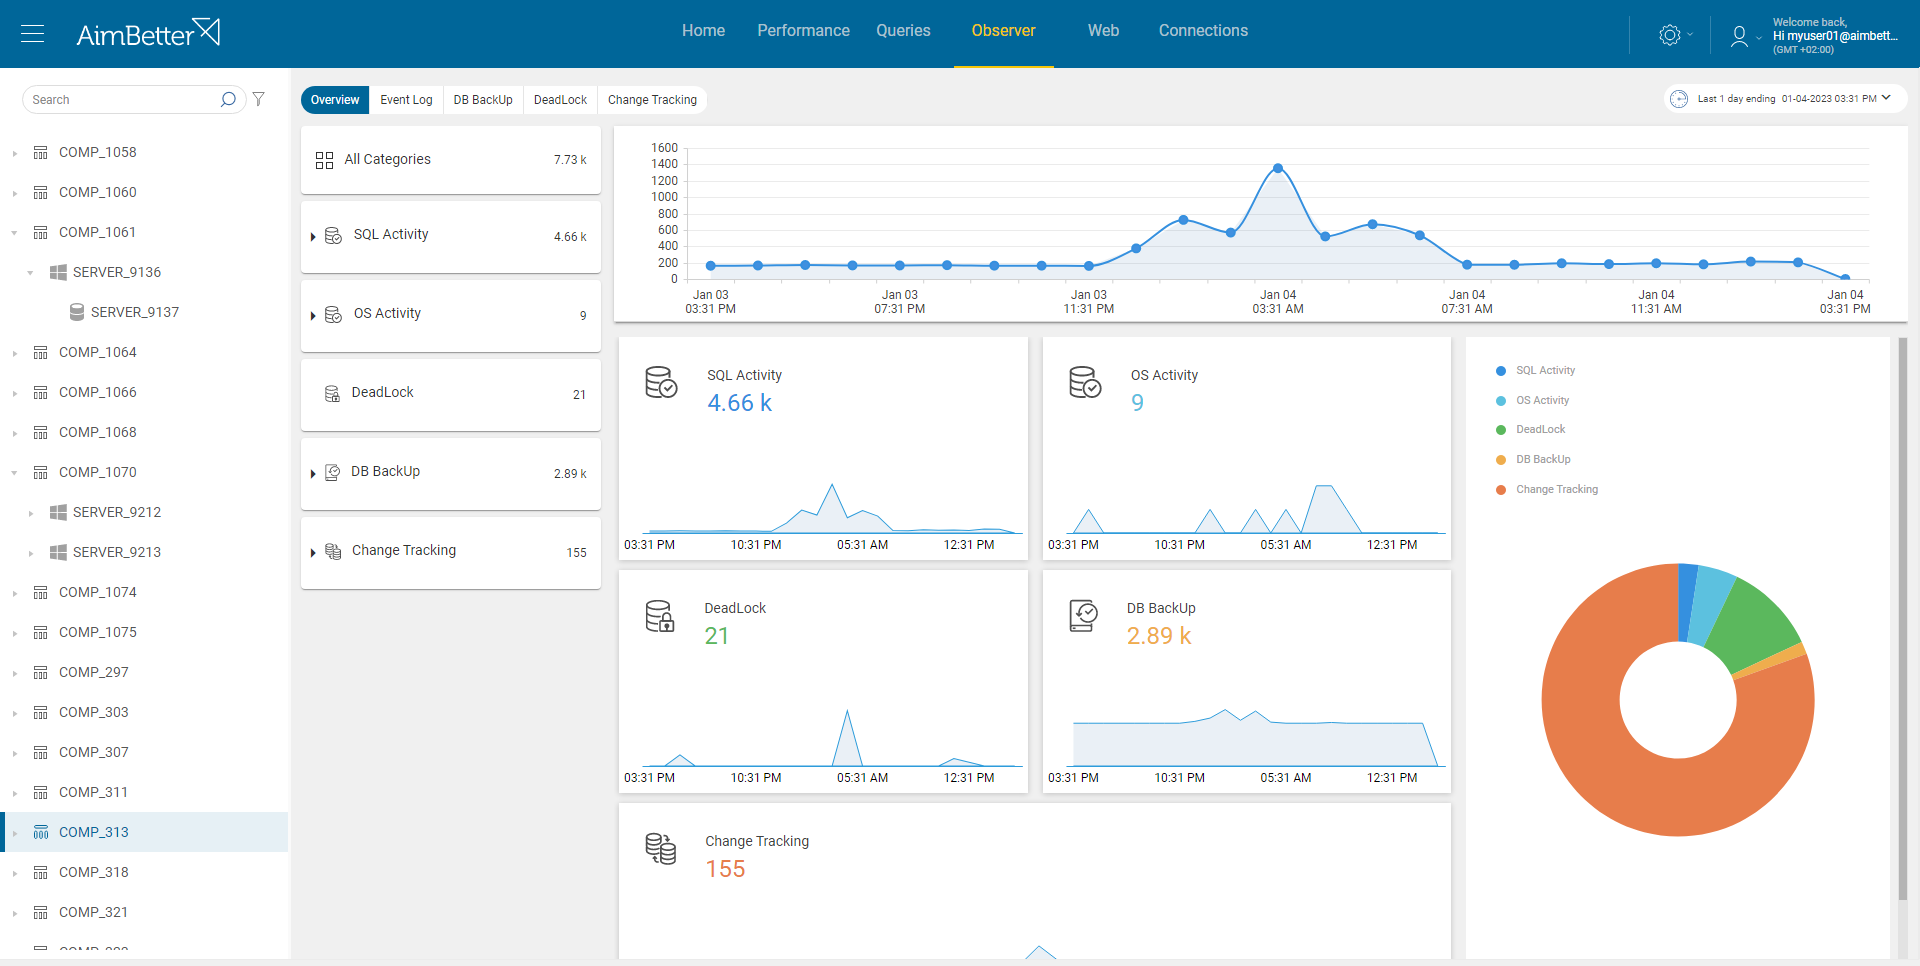
✓ Understand all the SQL Server environment health through over 300 critical system metrics
✓ Investigate resource consumption going back to any specific time
✓ Easily compare metrics during different periods
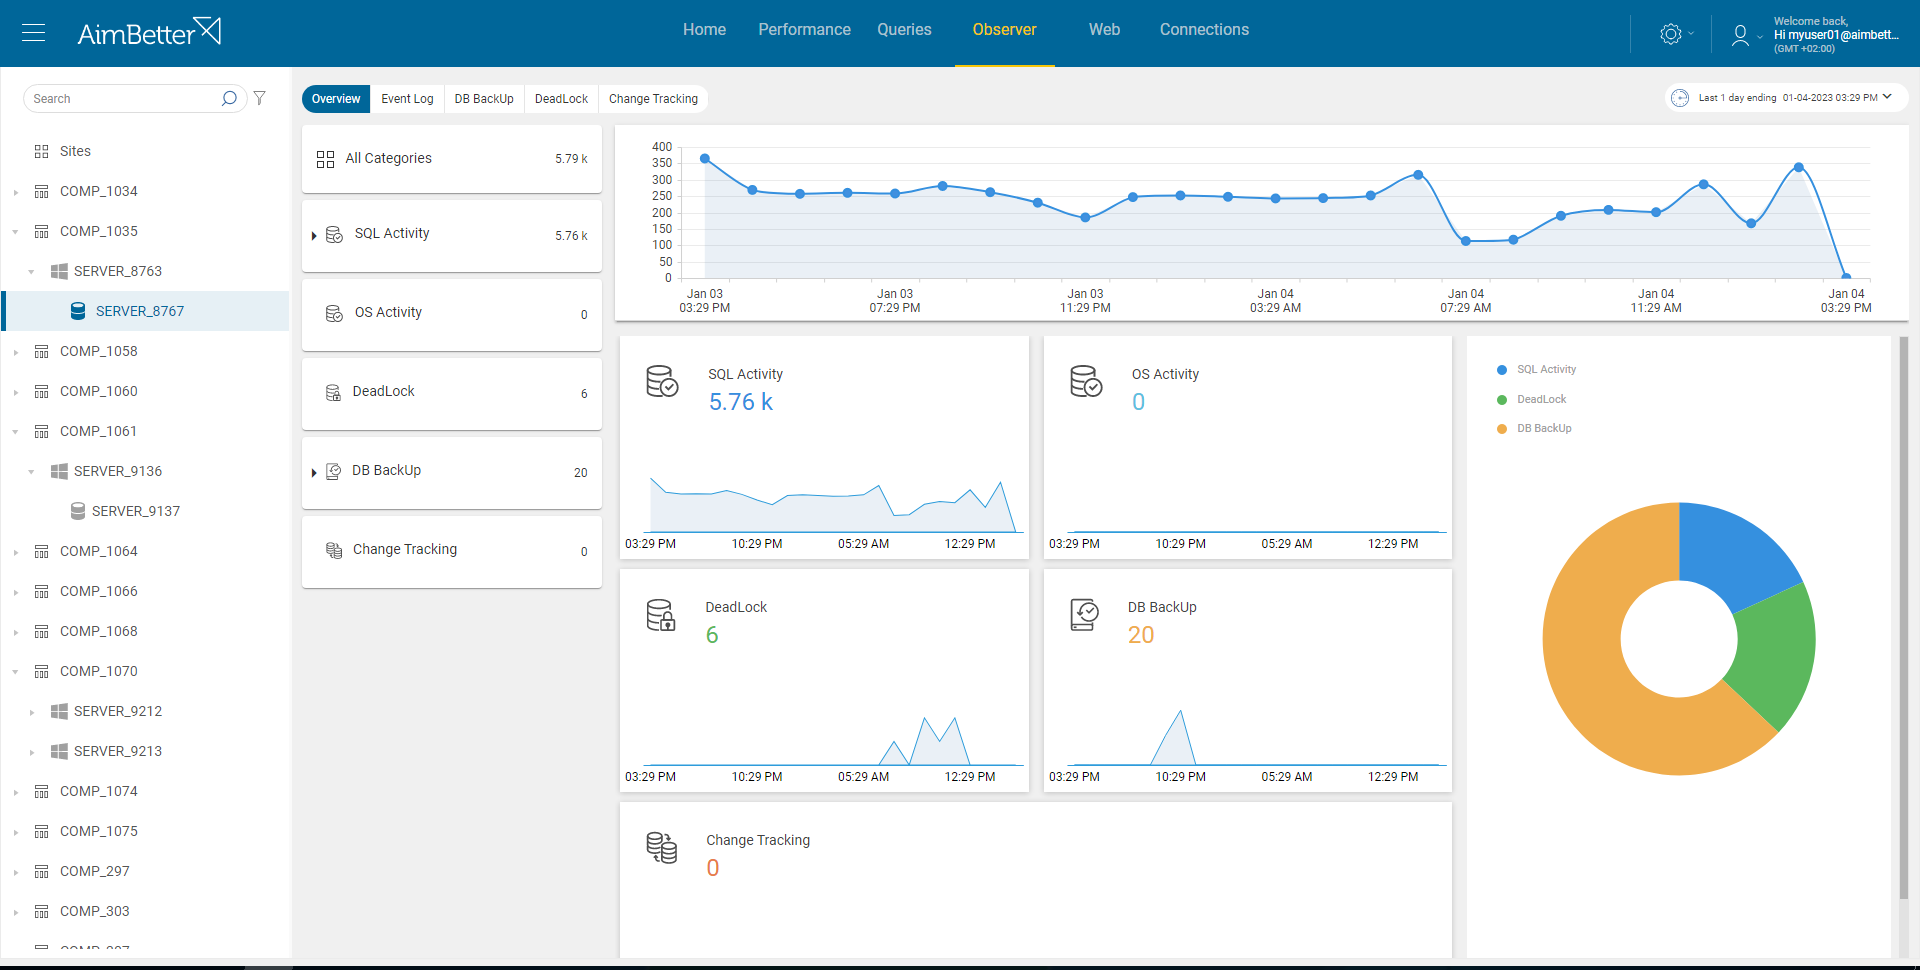
✓ Keep updated on any changes like software installation and updates, database creation, service status changes, and more
✓ View all the exceptions in both OS and SQL levels with details of when they happened, who was the user, and their description
✓ Recognize abnormal behavior, such as login attempts, that may pose a serious security breach
✓ Follow up Database backups and their rightful execution
✓ Understand all the causes and victims of deadlocks
Real-Time Diagnosis
✓ Sys-DB-App-Client Cross-information analysis
✓ Pinpoints the root cause in real-time
✓ Proactive smart notifications
✓ Shortens the Troubleshooting time
✓ ML continuous improvement
✓ Automatically detects code, security, data loss issues, and much more
Powerful DBA Capabilities
✓ Millions of queries analysis/minute
✓ Execution plan analysis and download
✓ Plan improvement recommendations
✓ Index recommendations
✓ Top resource-consuming queries
✓ Optimal maintenance of DB Growth & Backups
Seamless Integration
✓ 5-minute Installation
✓ Friendly & Intuitive for all the IT Team
✓ Ready to Use Solution
✓ 100% SaaS, no System Overhead
✓ Hundreds of Built-in Metrics
✓ Scalable, great for Enterprise and SMBs


