Deadlocks – detection and prevention with AimBetter monitor
by Yehuda Lasri

Deadlocks in SQL Server databases are one of the most common and complex situations which could result in a serious degradation in both performance and data integrity and almost always require the attention of skilled and experienced DBA personnel to resolve.
A deadlock occurs when two or more sessions inside the database engine end up waiting for access to resources that have been locked by each other. In a deadlock situation, none of the sessions can continue to execute until one of those sessions releases its locks, so allowing the other session(s) access to the locked resource. SQL Server is designed to detect and resolve deadlocks automatically through the use of the Lock Monitor process that runs in the background for every SQL Server Instance. Lock Monitor arbitrarily designates one of the two processes as the “victim” and rolls it back, advising the user that initiated it to resubmit. It is extremely important to understand that it is almost impossible to investigate and solve the specific instance of the deadlock that has been reported. This is because Lock Monitor operates quickly to intervene and, in so doing, removes the victim’s footprint. The main purpose of deadlock handling then becomes trying to prevent re-occurrences of the lock. Without sophisticated tools, this can only be done by locating details inside the SQL logs through a detailed examination of the past event.
The main danger of deadlocks is that in complex actions, the rollback process may result in situations where data can be lost. Furthermore, deadlocks are almost always a result of poor database design, lack of indexing, poorly designed queries, inappropriate isolation levels, etc.; therefore, when deadlocks are reported, the DBA must investigate their cause immediately.
The prevalence of deadlocks in frequency and complexity has led to a wide range of published guides to problem resolution using standard Microsoft management tools. We have appended at the end of this article a summary of the common methods that can be used, to illustrate just how difficult and time-consuming deadlock resolution can be. But with AimBetter, the emphasis is on ease of use, even for personnel who are not highly experienced in database administration.
The AimBetter way
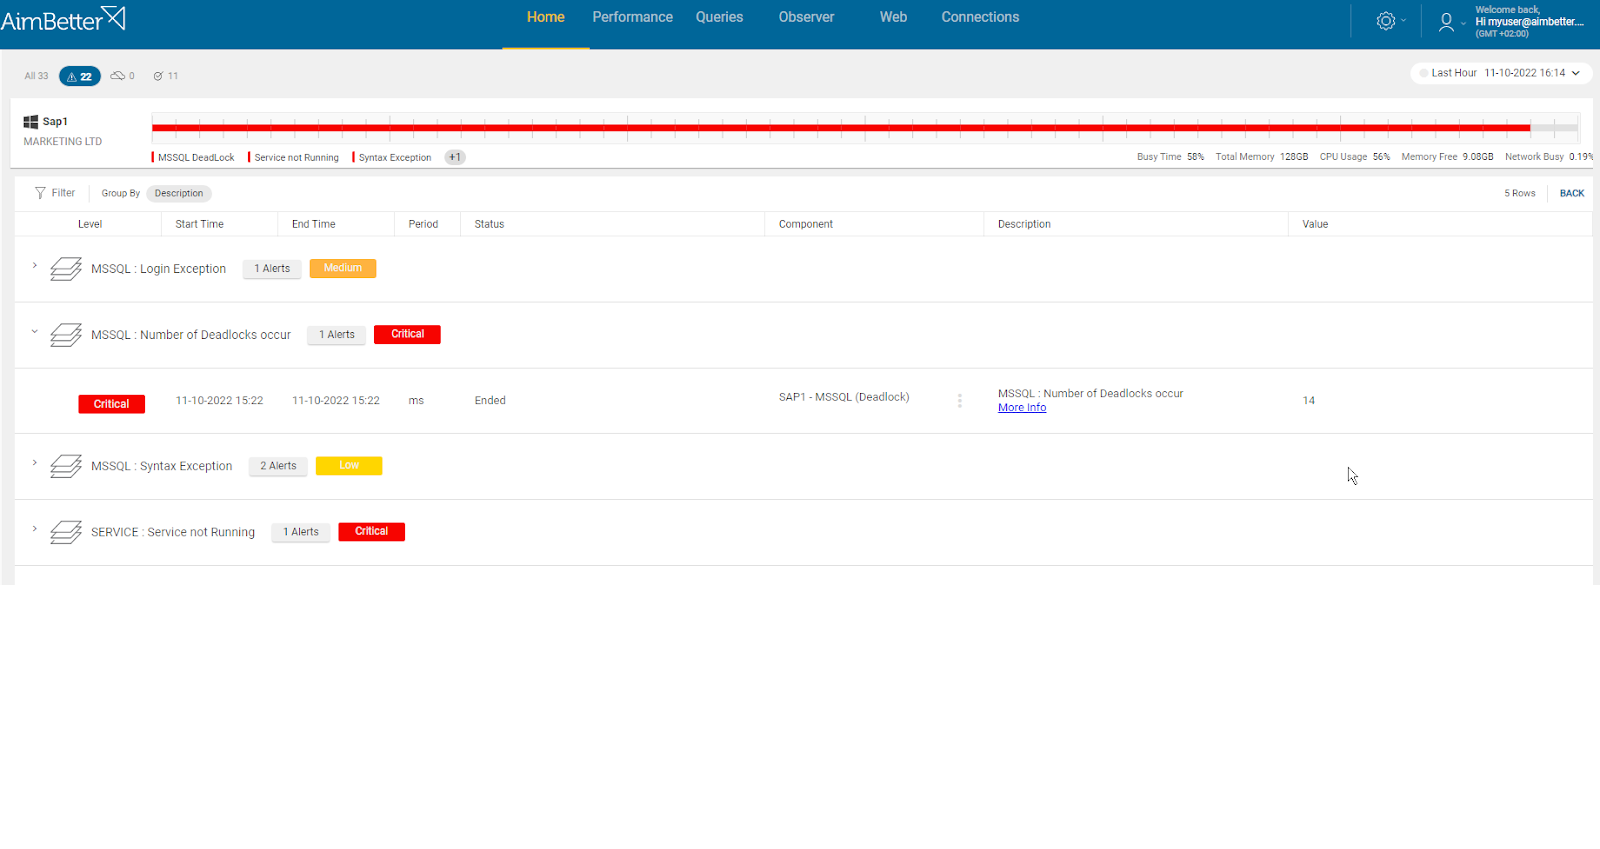
It is no longer necessary to wait for a user to be warned of a deadlock, by which time pinning down the exact details may have been made difficult due to the function of Lock Monitor in arbitrarily rolling back one of the actions. The occurrence of deadlocks is immediately visible in the central AimBetter Alert monitor, as illustrated here, and from that point, analysis and investigation can be performed on the historical data gathered by AimBetter at the time of the lock, regardless of the action subsequently taken by SQL Server to close down the problem.
Now it is easy to find the deadlock victims and also see the deadlock survivors in the Queries drill-down screen. The most important pieces of information required to understand the root cause of the deadlock, and the best solutions, can be summarized in the following snapshot. These are:
- Identify the locked element (in this snapshot, ‘MA.dba.index’)
- Identify the victim chosen by Lock Monitor, and the survivor
- Display the respective details of the two processes
- Display the last step taken by each process before the lock. The most important information relates to the step on the victim that failed (which is the one being rolled back), and AimBetter highlights this in plain view.
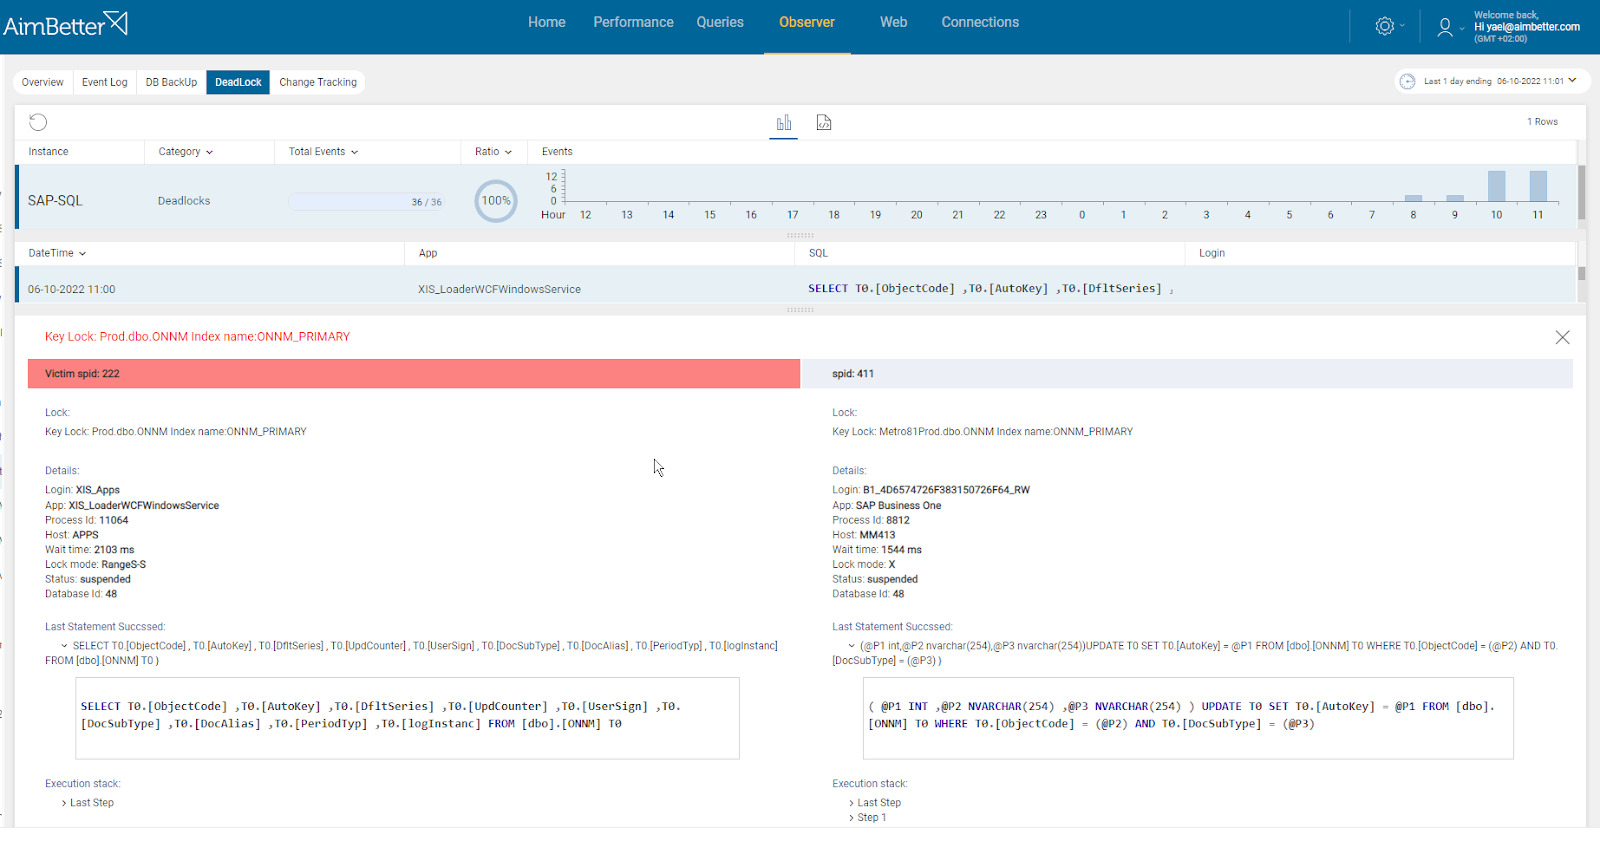
Basically, in this single monitor display, you will have access to all the information needed to pinpoint the cause of this deadlock, and by this means to take the required steps to correct any deficiencies in database structure, code, or indexing and thereby prevent future occurrences. It will also be possible to directly validate the rollback’s efficiency to ensure no data has been compromised.
It is vital to understand that getting to this display requires just a few simple and logical steps, clicking through sequential relevant screens to get to the fundamentals. This is in stark contrast to other methods, which require multiple parallel queries, deep knowledge of how the diagnostic tools work, and extensive experience in SQL administration. Since AimBetter lets you view and edit the offending code directly, you won’t need the try-and-catch blocks – you’ll find all of this is already built-in, providing you with a ‘virtual DBA’ experience that takes you straight to the answer.
Another great thing is that you don’t need to reproduce the issue because, with AimBetter, all deadlocks are logged and stored in the cloud for analysis of the specific relevant data. Therefore it saves you the effort of reproducing the issue and trying to analyze it with Profiler while not being able to get all the details about what happened from it. As well, unlike the conventional way, you can easily see historical deadlocks and analyze your system for long-term trends. Therefore, you could see the effects of your deadlocks handling policy.
Summary
This article has covered how to detect and solve SQL Server deadlocks in the shortest possible time. Most often, deadlocks are the result of a design problem in the database or code that can be fixed to prevent the deadlock from occurring. However, when changes to the database are not possible to resolve the deadlock, adding appropriate error handling in the application code reduces the impact caused by a deadlock occurrence. The information included in this article should allow rapid and efficient troubleshooting of most deadlocks in SQL Server.
How AimBetter delivers.
AimBetter brings a host of special features and benefits that are specially designed to make the management of SQL databases more efficient and simplify the work of database administrators.
The particular features that worked in favor of our customers, in this case, can be summarized as follows:
- Immediately raises alerts to any unexpected behavior
- Identifies all current queries elements
- Allows query selection on specific criteria
- Displays all live Queries statistics
- Enables historical display of queries
- Retrieves full query syntax
- Retrieves details for both queries involved in the deadlock
- Monitors core SQL database performance
- Reports on SQL Exceptions
- Enables comparison of current with historical metrics
- Displays in a single comprehensive dashboard
Putting all these features into a single package and then having the results at the fingertips of both our experts and the customers’ own database managers was the key element that allowed for this happy ending.
AimBetter is the best tool in the market that helps you handle deadlocks and doesn’t require you to use complex code in order to troubleshoot. Additionally, it monitors all of your database operations for you automatically. Therefore, it saves you a lot of time and effort and is the best practice for your DB maintenance.
Appendix – the standard methods
In fact, our introduction to the detection of deadlocks was a simplification. In reality, deadlocks are not always directly caused by specific user actions, and the first indication of a deadlock may be signs that performance is degrading, and only when examining the SQL Server for a cause will the deadlocks become evident. In these cases, it will only show up in the log in a general entry along the lines of “Transaction (Process ID xxx) was deadlocked on resources with another process and has been chosen as the deadlock victim.” This offers even less information than the user notice – no idea of which resources, which step in the victim was pending, which competing event was released and so on. All of this makes the job of deadlock resolution even more difficult.
Much has been written in official SQL Server help documentation and by Microsoft SQL database administration gurus to point the way to handle deadlocks. In brief, ‘best practices’ are described here.
Firstly, it is important to know that all these methods will only work if preliminary steps have been taken to enable deadlock logging, and in production environments, they will usually be disabled since they consume considerable resources. This means that dealing with the past deadlock isn’t possible – it will either have to be re-created, or you will have to wait for the next time.
Deadlocks can be traced by turning on two specific flags: dbcc traceon (1204, 3605, -1) and dbcc tracestatus(-1). Then, when the following deadlock occurs, the information will be captured in the SQL Server Error Log. This log contains a level of raw data, which has to be examined to extract meaningful information:

First option – once logging has been enabled, SQL Profiler can be configured to save the deadlock graphs separately into XDL files. These can then be viewed graphically., but locating the specific file requires a detailed examination of the log to identify the relevant file. Looking at a sample of the XDL output, it is quite apparent that this needs a lot of skill to interpret – quite unlike the simple AimBetter visual representation of the same incident.
Second option – if you prefer to work directly with server-side traces, removing the overhead of the Profiler client, then you must first use the SP_TRACE_* set of system-stored procedures so that you can capture the deadlock graph information directly from your scripts. In this case, the captured graphs will be written to a SQL Trace file on the SQL Server. This requires generating a script for a server-side trace in SQL Profiler, and then export it to a script. The end result is the same output, which requires extensive work.
The third option is to get the same information from the SYSTEM_HEALTH extended events trace and files, which runs continuously (meaning the disadvantages to the first two methods are overcome). However, this takes many more steps, summarized here:
- Expand the Management subtree in Object Explorer for the server connection you wish to view.
- Expand the system_health session.
- Right-click the event_file and select View Target Data
- Apply a filter for xml_deadlock_report.
So whichever method is used, each one of which involves multiple steps of varied complexity, you will end up with a cryptic graphic than now needs considerable work to produce meaningful information. Compare this to AimBetter’s simple ‘one-two-three’ process in one place, and the advantages are quite clear.