“AimBetter represents NextGen database monitoring – providing powerful cloud tools to identify problems on the spot.”
by Rony Shoshani, Operations Manager
AimBetter SQL Server Monitoring gives you complete visibility and control of the SQL Server environment empowering you to improve performance, efficiency, and uptime. With the insights gained from AimBetter SQL Server Monitoring, you can make informed decisions about how to optimize and enhance your databases.
AimBetter’s real-time monitoring capabilities enable you to quickly identify the source of performance issues, whether from application code error, non-optimal queries plan, operating systems, or hardware deficiency. That means significant time saving for you and cost savings for your company.
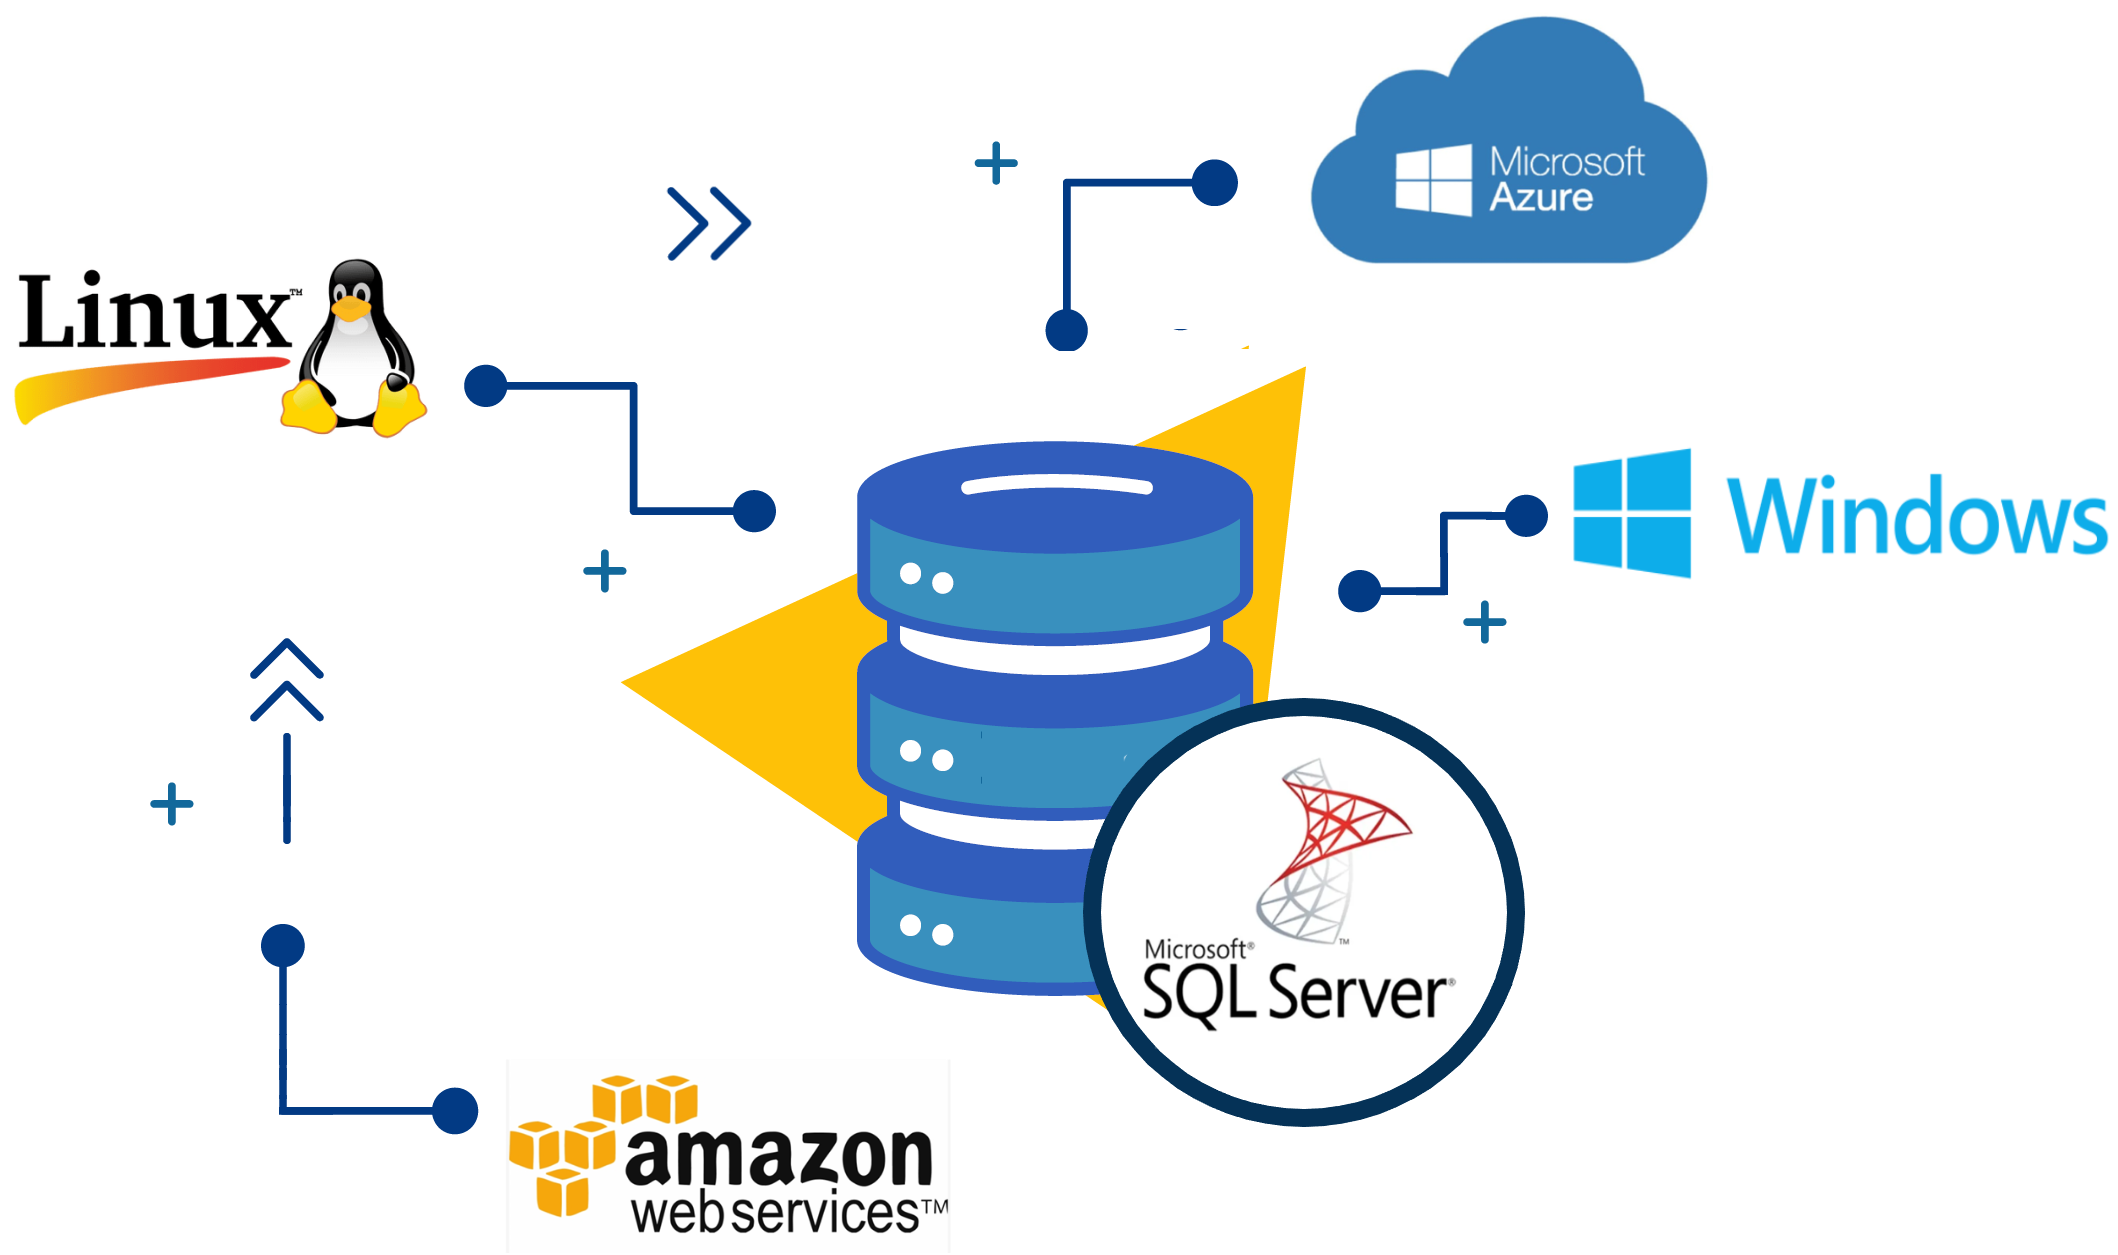
1. Hardware – the first layer of the SQL Server environment is the hardware layer. It includes the server’s CPU, memory, hard disk, and network.
2. Operating System – the second layer is the Operating System such as Windows or Linux.
3. SQL Server – the third layer is the SQL Server program (Database Management System) such as Microsoft SQL Server, Oracle SQL, MySQL, PostgreSQL, and MongoDB.

4. Queries – the fourth layer are the queries that run in the Database System.
5. Processes – the fifth layer includes the interaction between the Database System with its different types of clients (real users and system automation), through the processes initiated by these clients applications.
6. Exceptions – the sixth layer refers to the exception mechanism used by the other layers that communicate events and errors occurring constantly on the system.
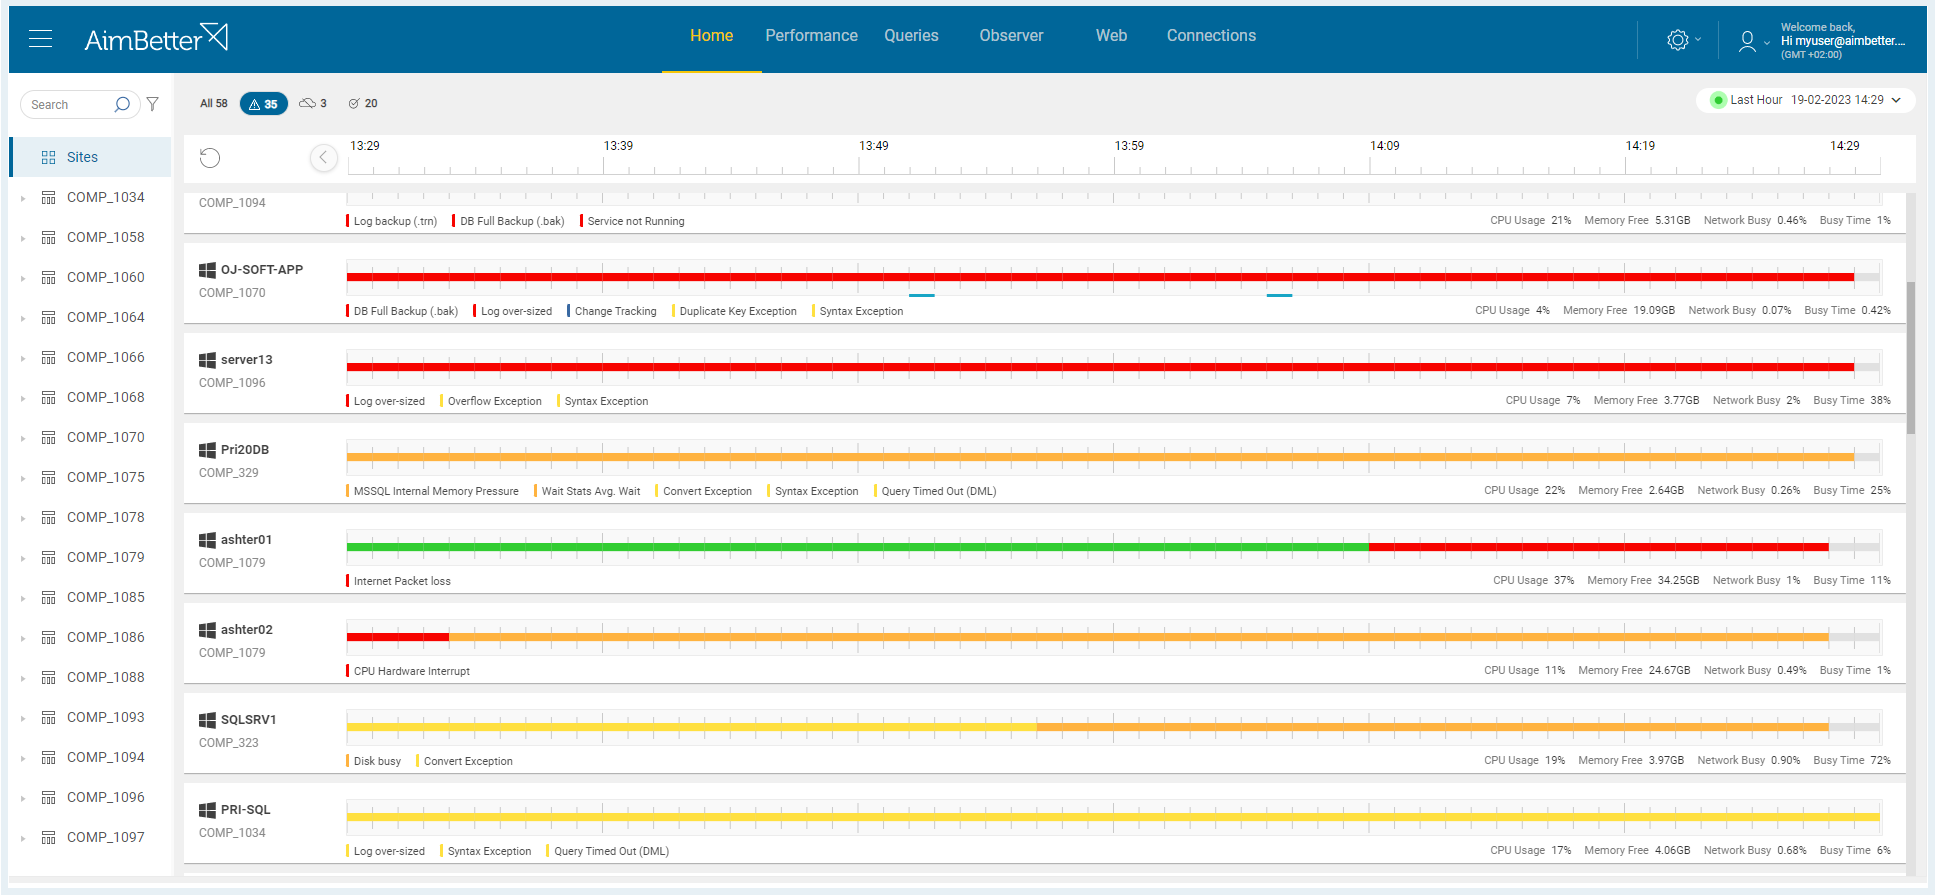
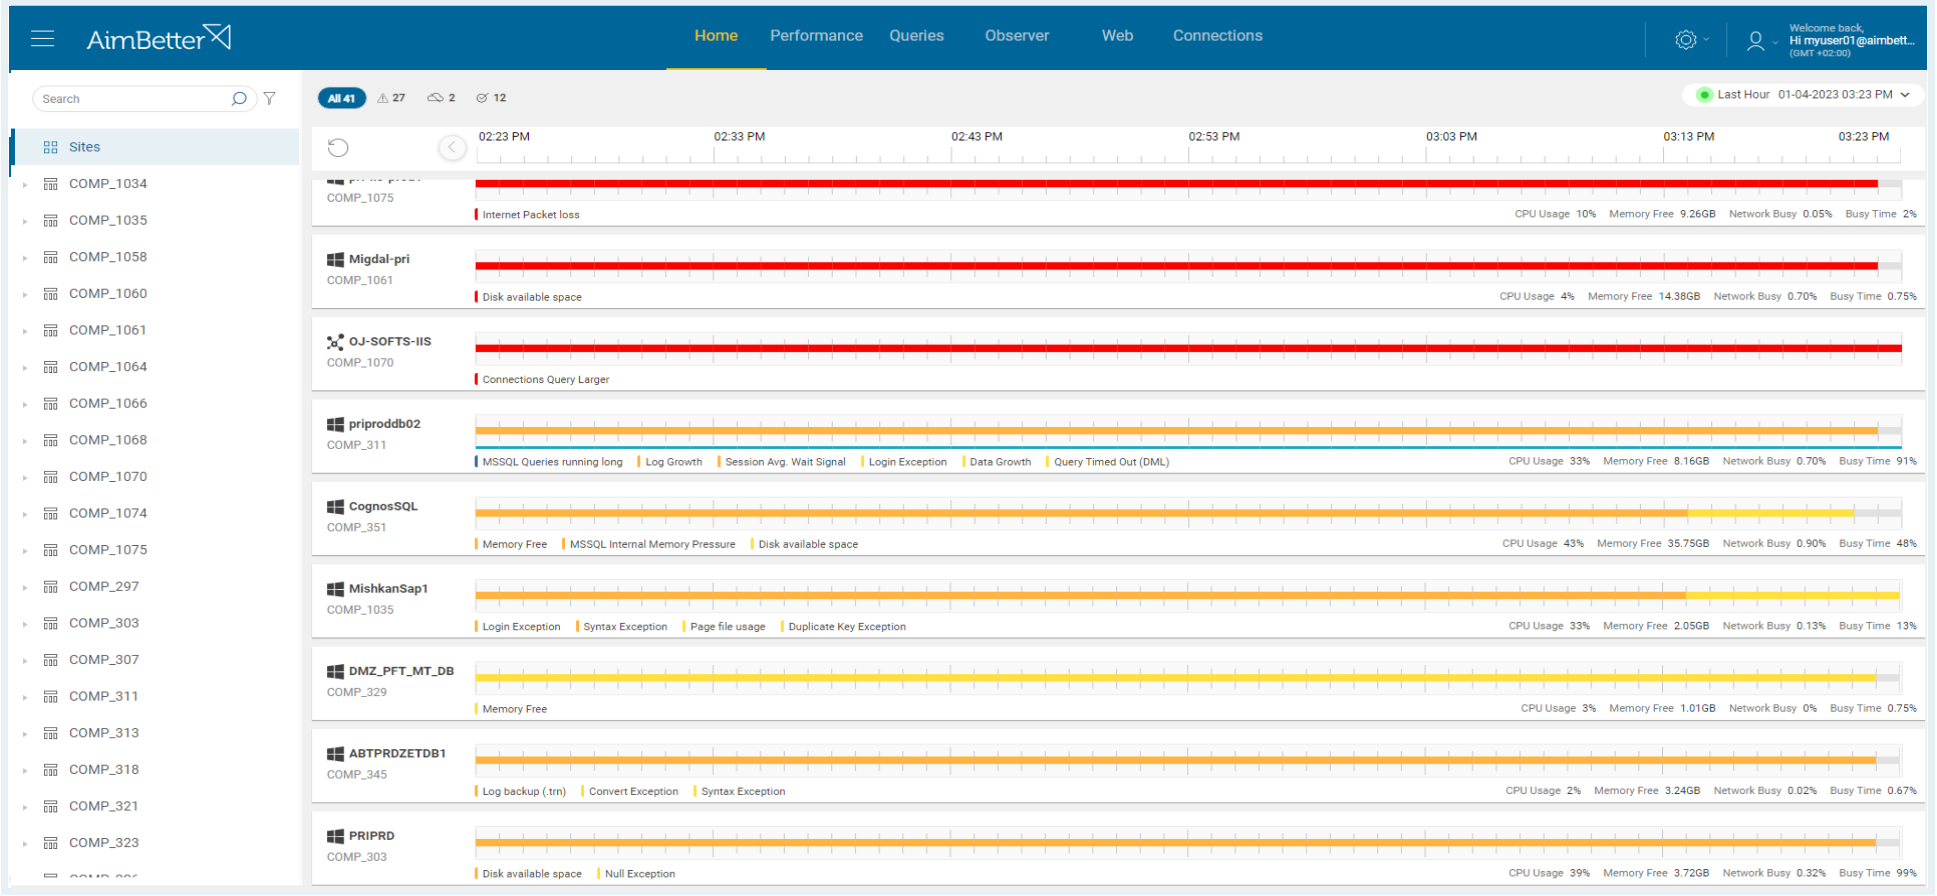
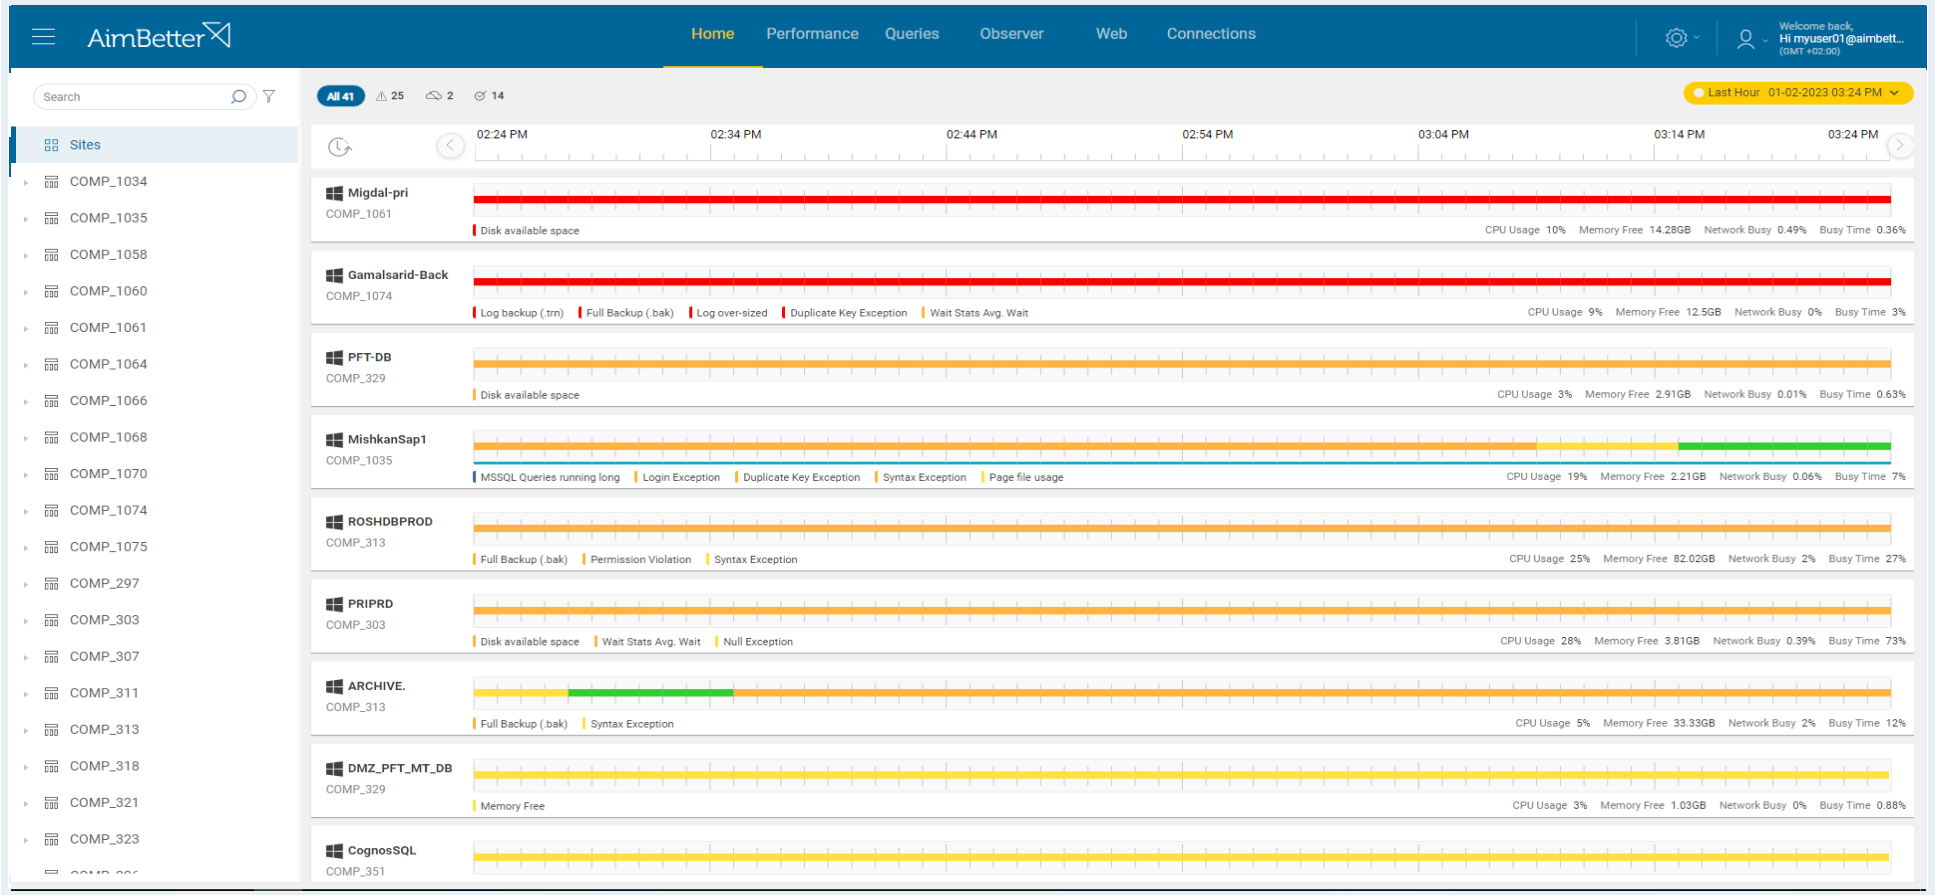
✓ Quickly identify and address the most urgent cases.
✓ Scroll over the bars and become aware of the present challenges through labels beneath the status bars
✓ Choose which servers to focus on by selecting the hierarchical layer (All, Company, Host, or Server)
✓ Get details in seconds by clicking on the status bar of a specific server
✓ Any issue is detected and notified immediately by email and mobile app
✓ From the first screen, you can see informative details about what’s going on
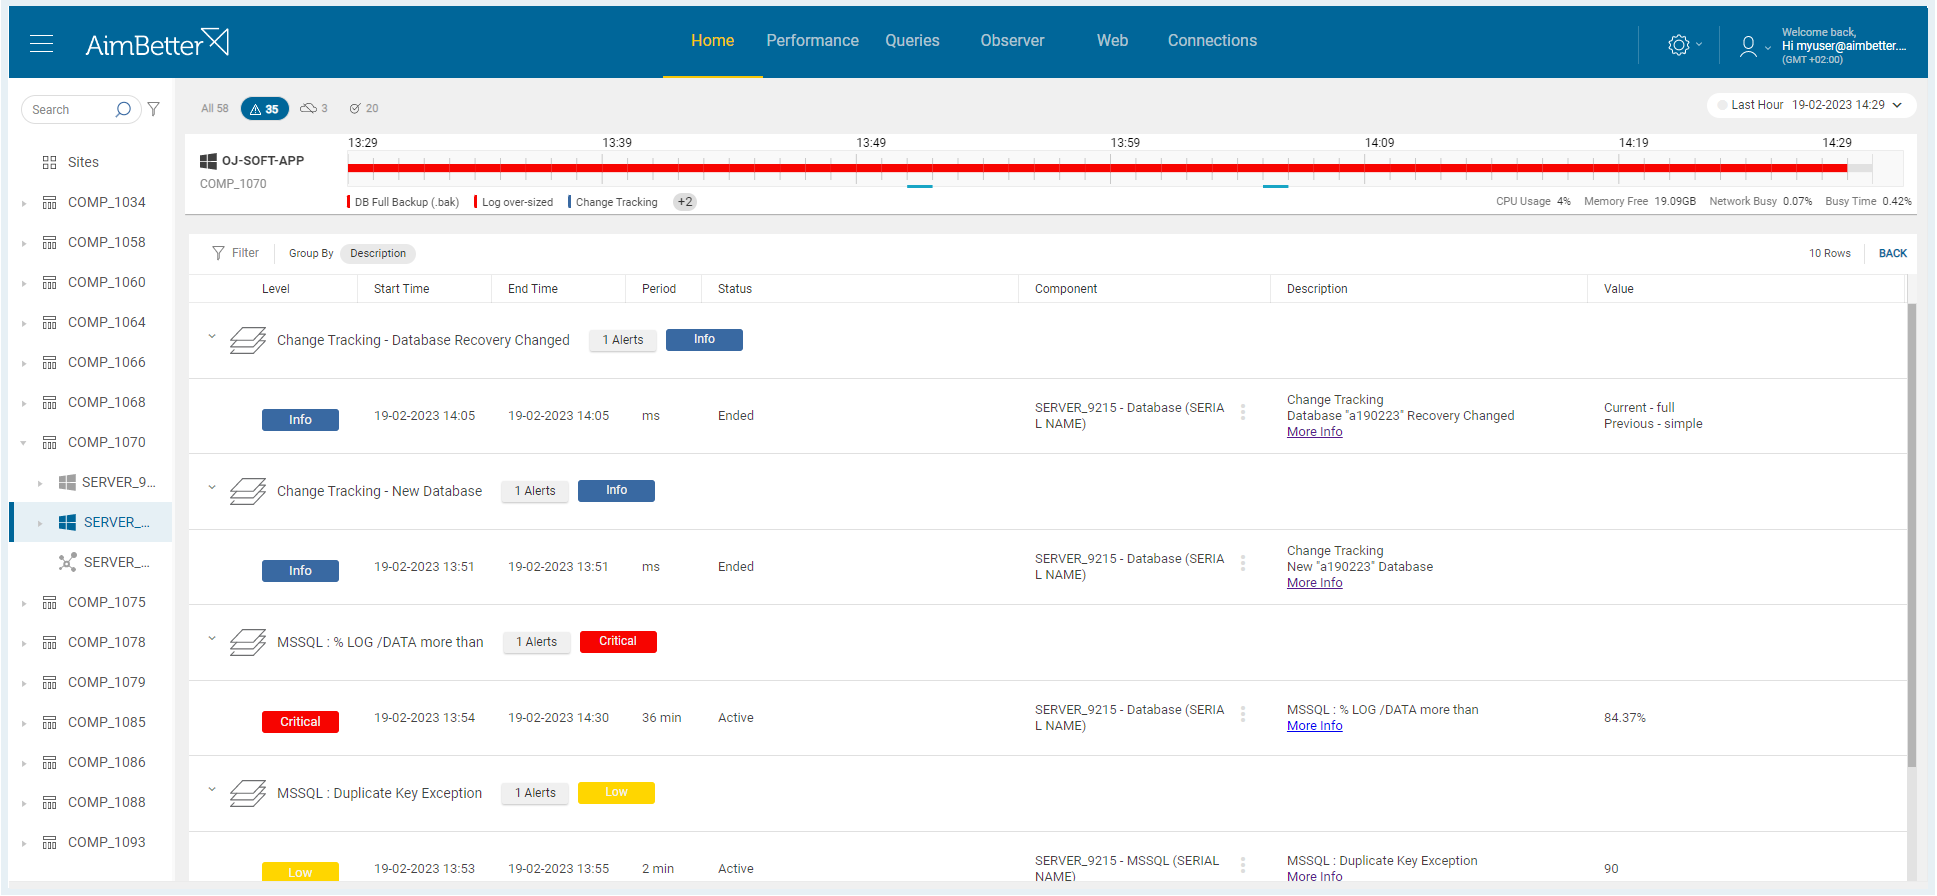
✓ Go back to the alerts of any desired hour
✓ Get more information about the meaning of any notification through “more info” links
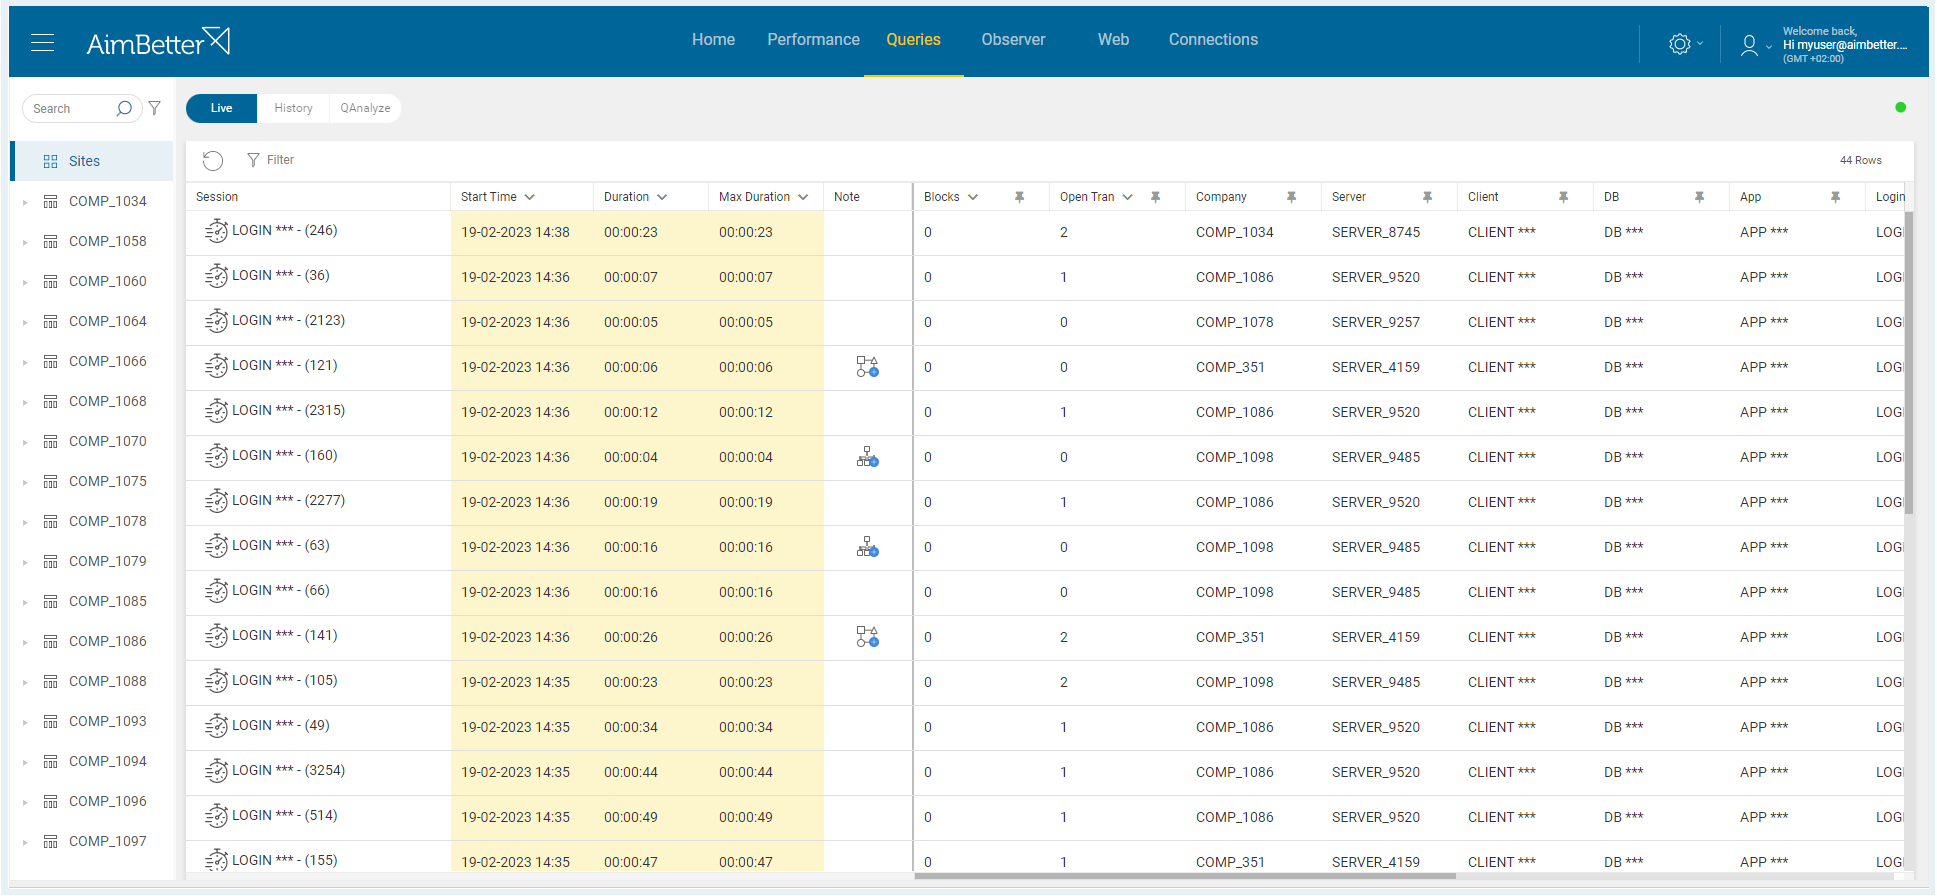
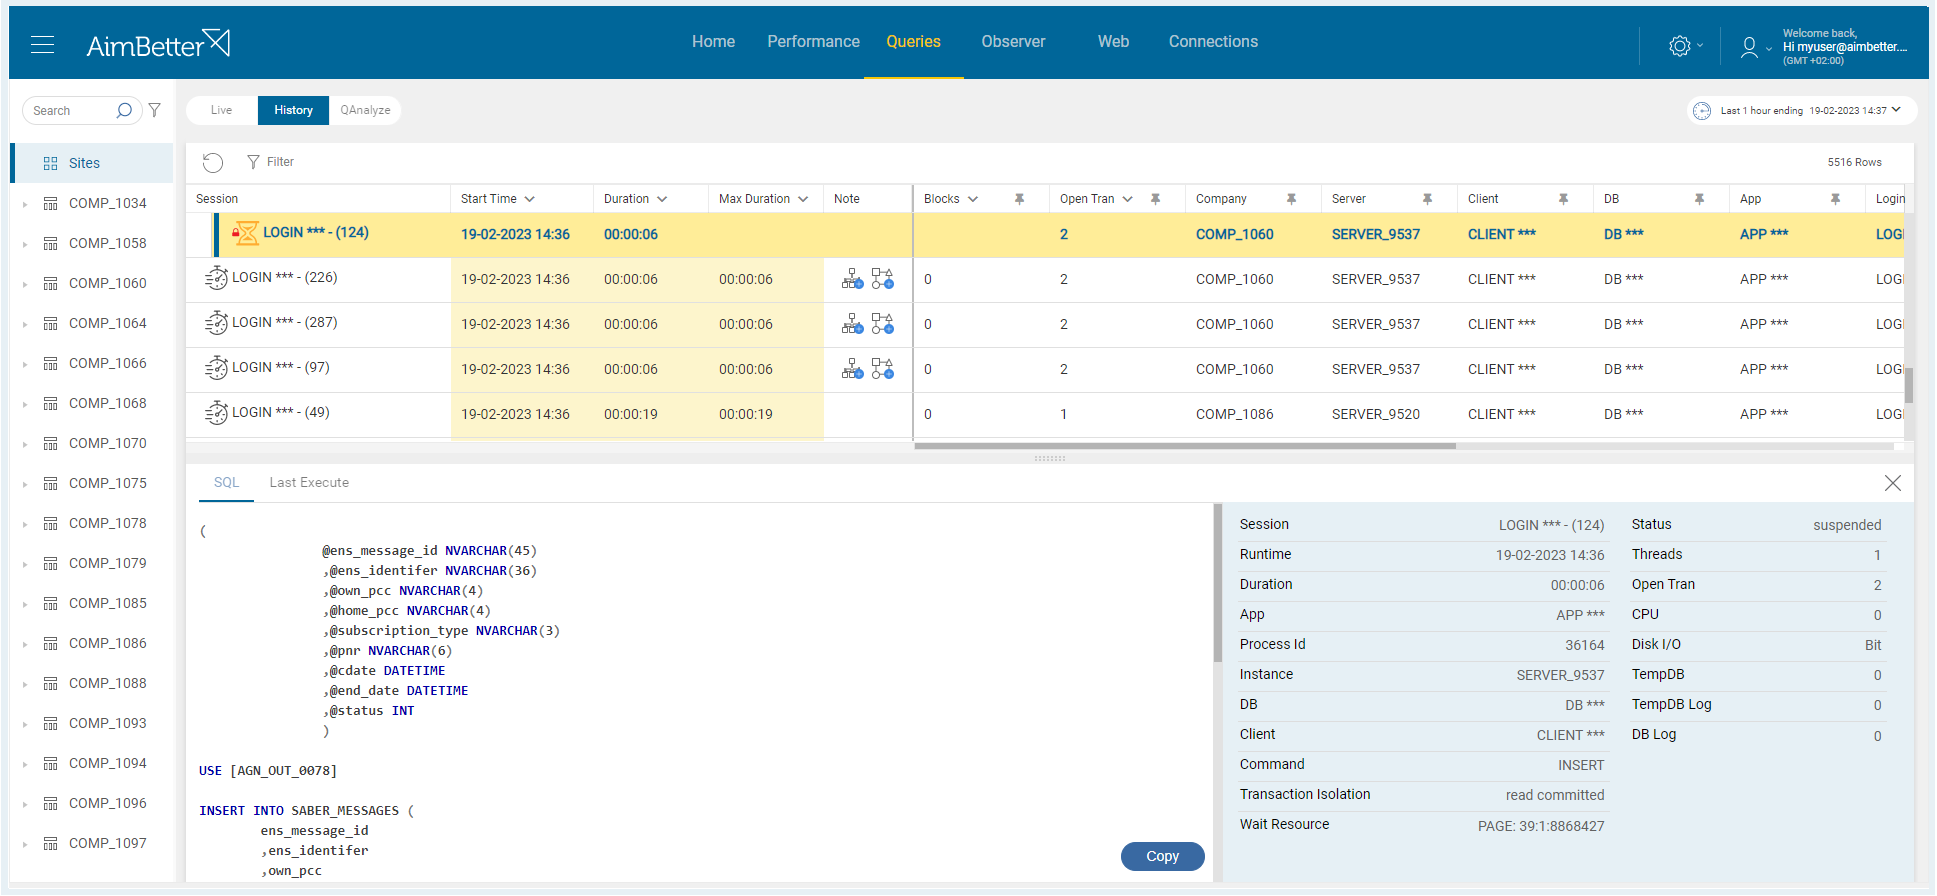
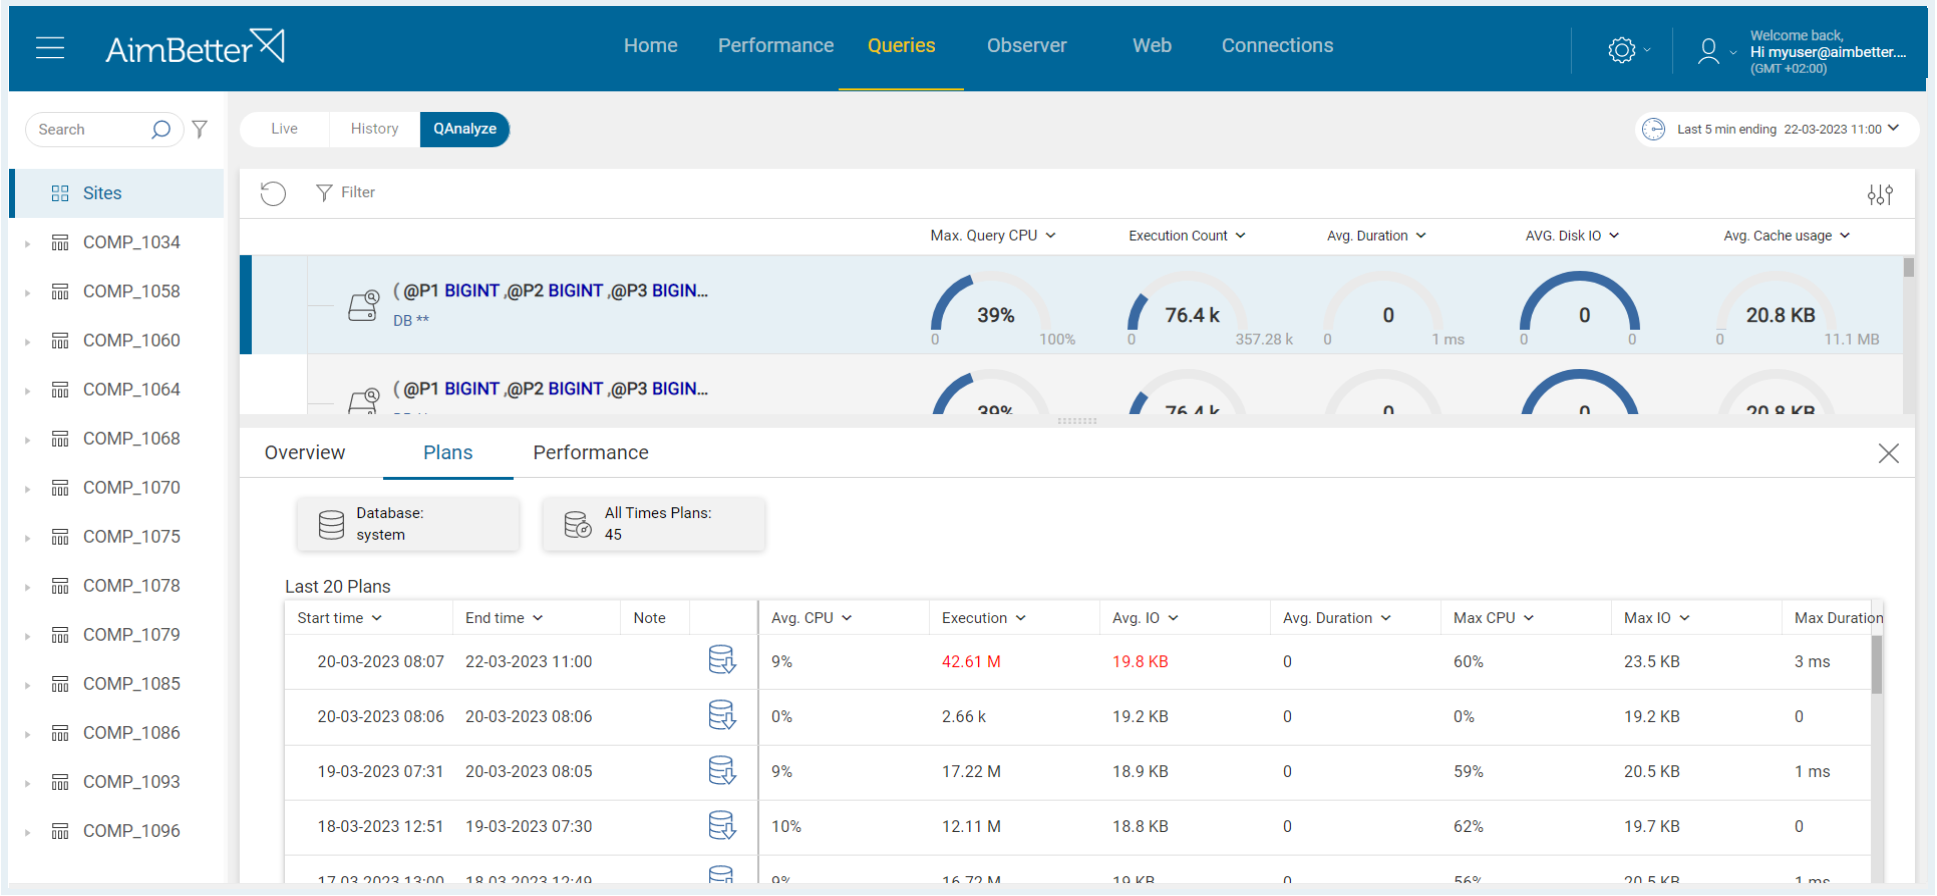
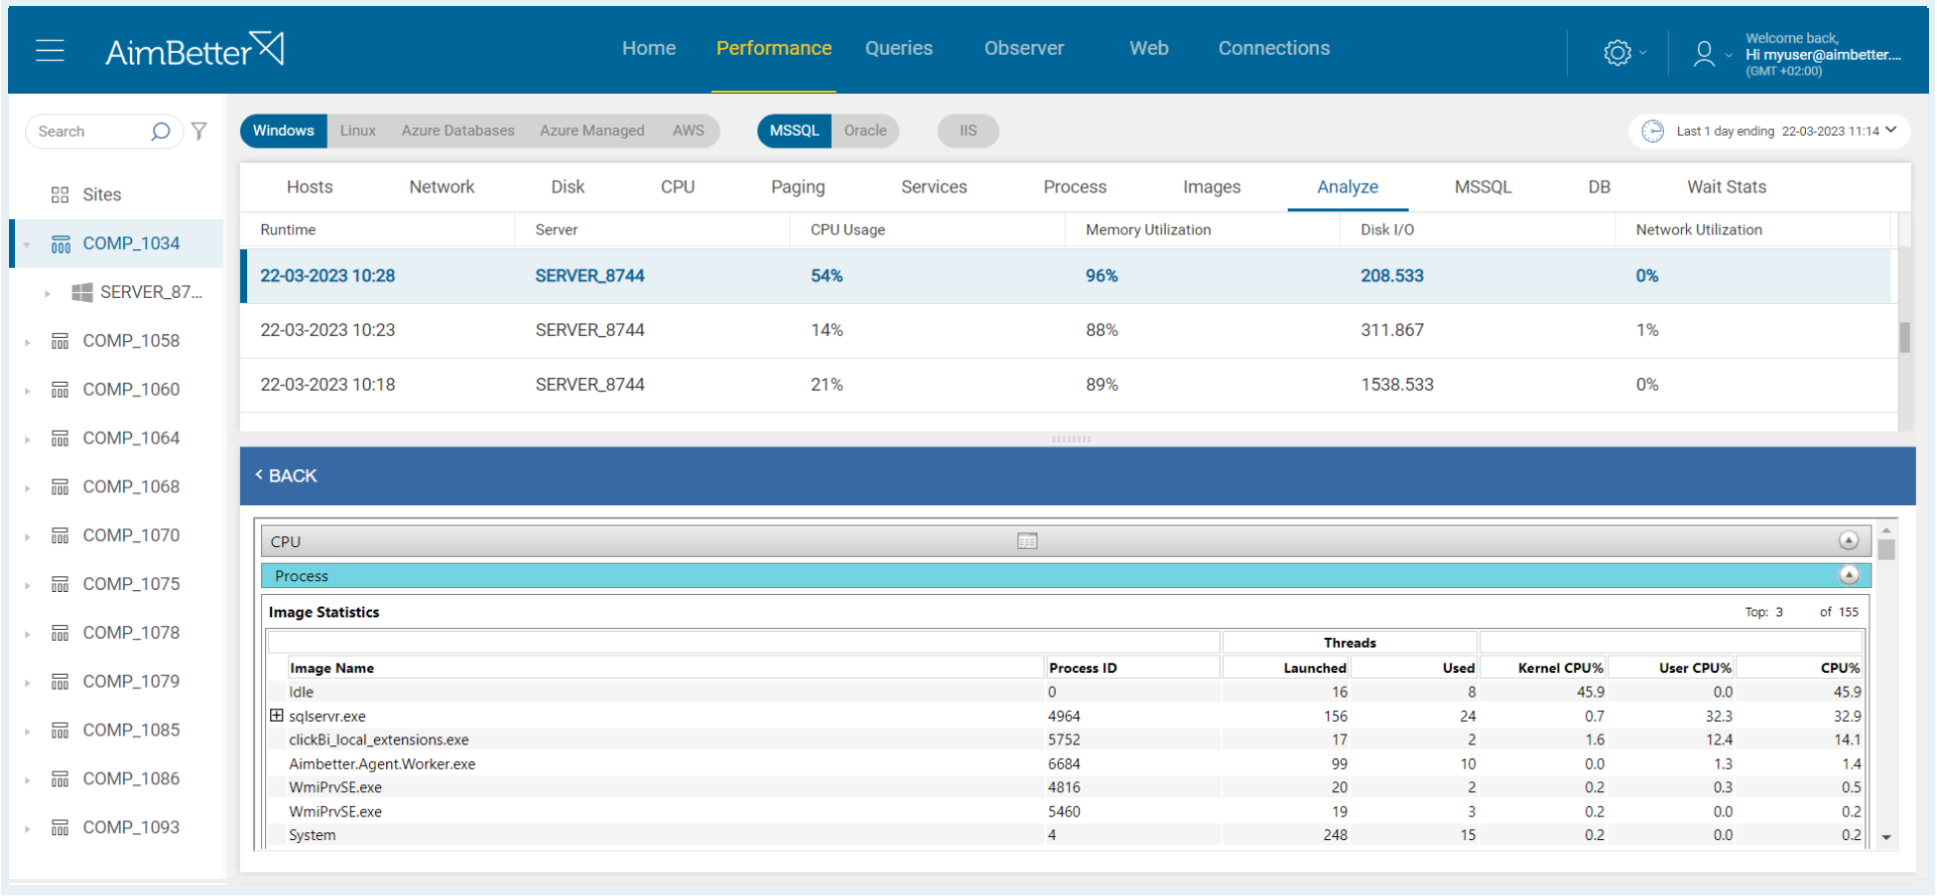
✓ Real-time comprehensive analysis of all queries
✓ Identify blocking queries with users’ details
✓ Multiple filtering options (duration, code, alert type, and more)
✓ Recommendations for missing index and plan improvements
✓ Download queries execution plan with a simple click
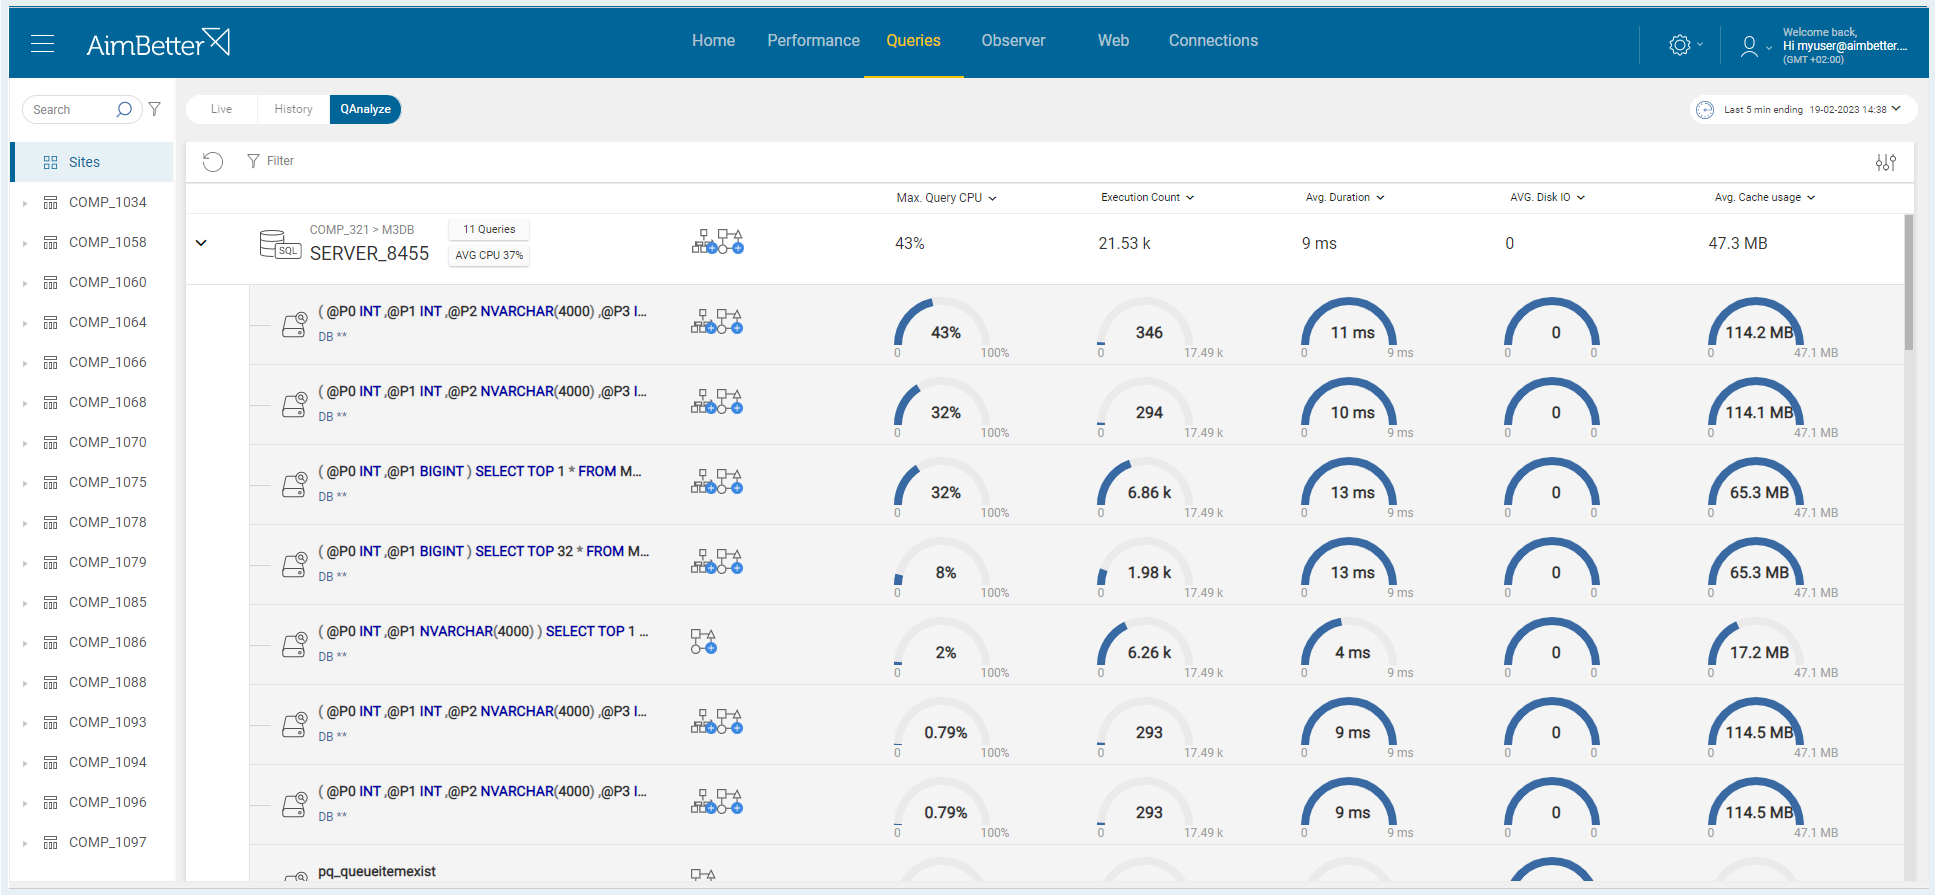
✓ Resource usage analysis (CPU, memory, execution count, Disk I/O, and Cache)
✓ Identify most “heavy” queries in seconds
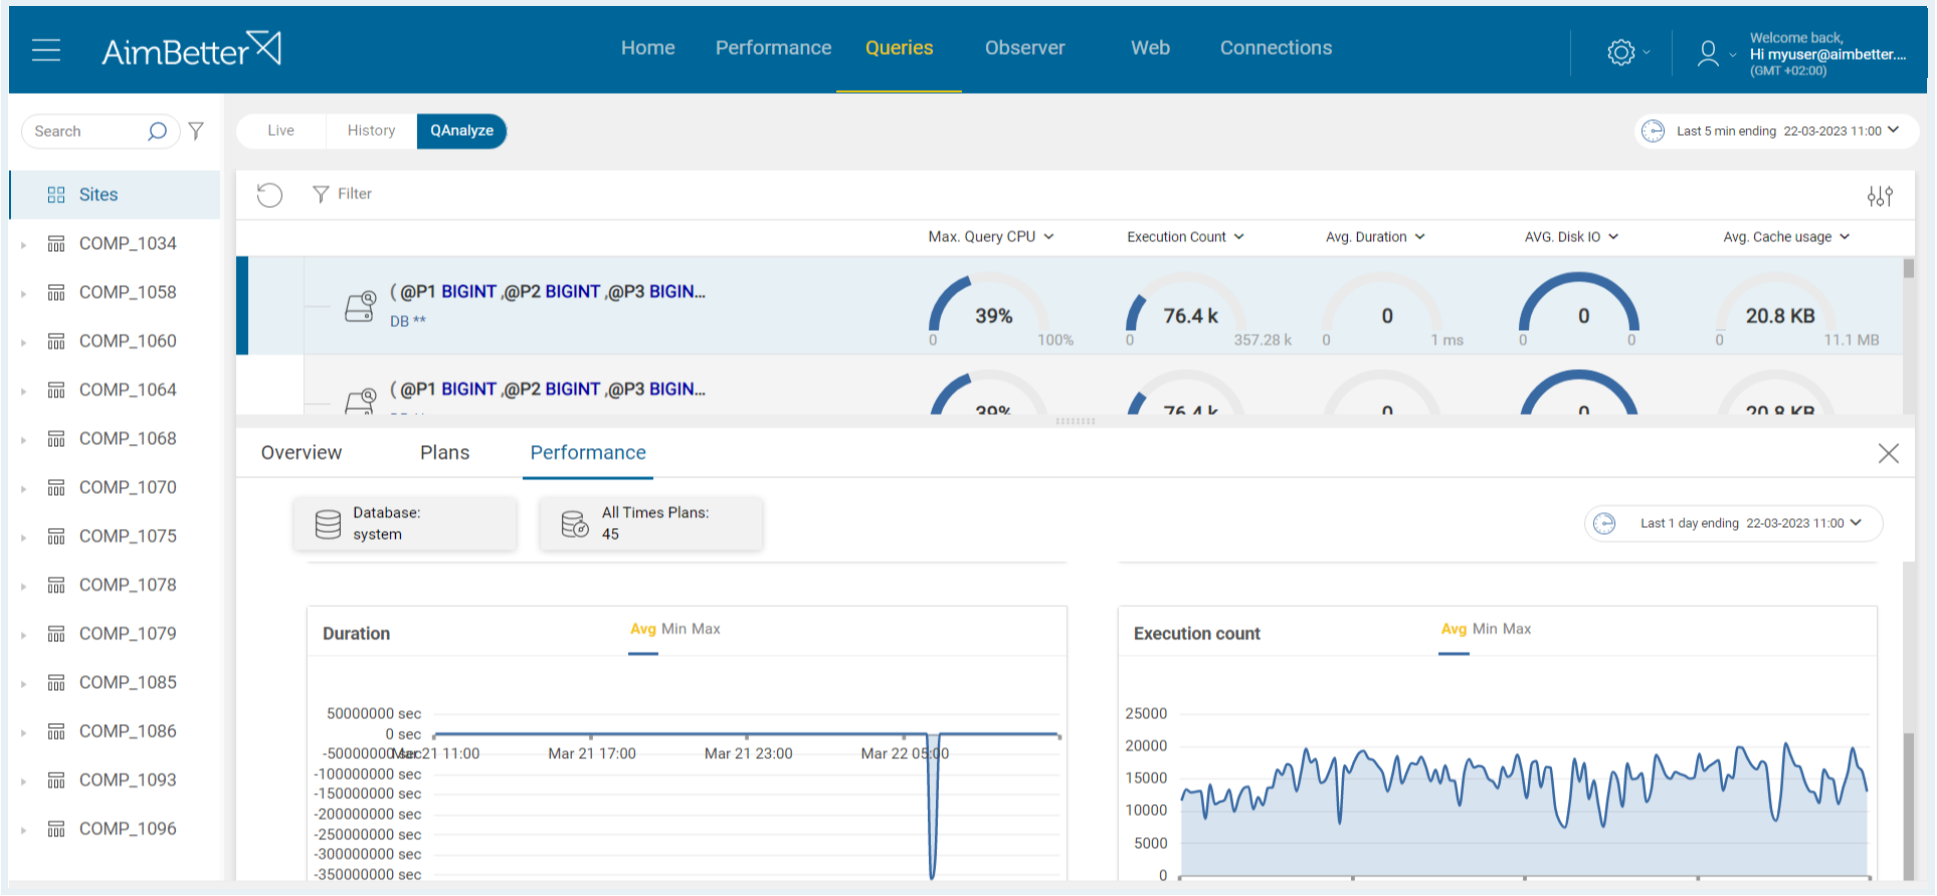
✓ Graphical view of any query performance over time
✓ See the execution plans changes over time with correspondent performance metrics
✓ Queries’ execution plan analysis
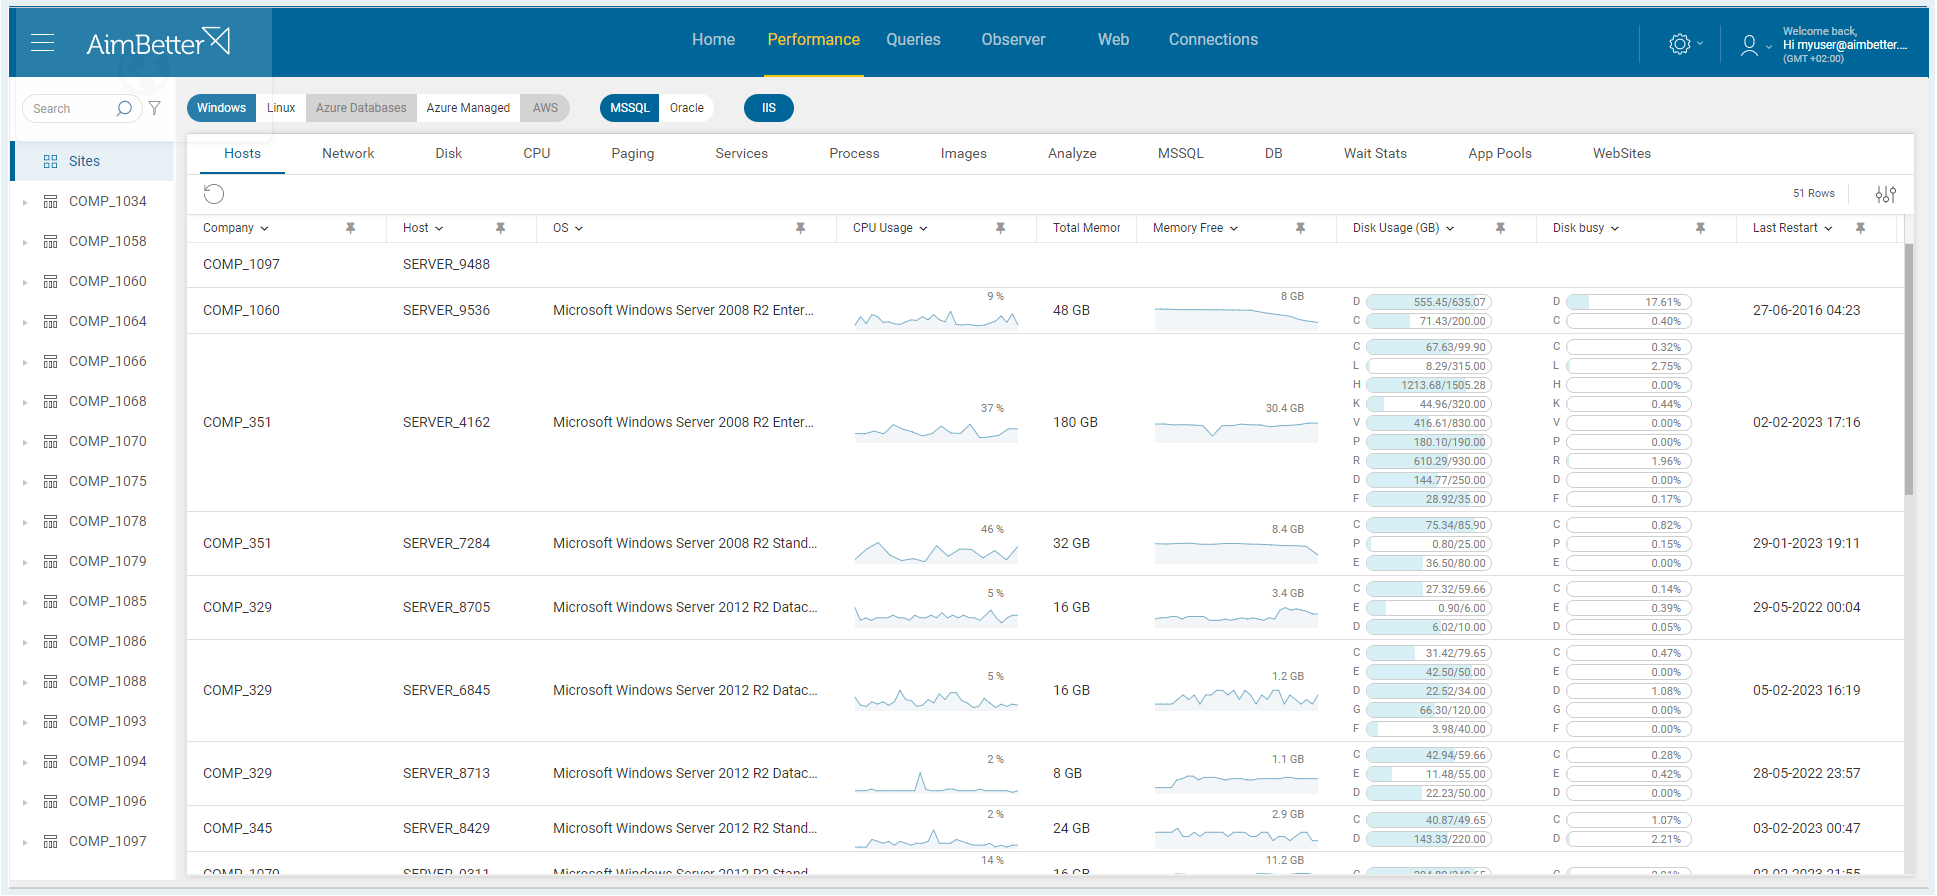
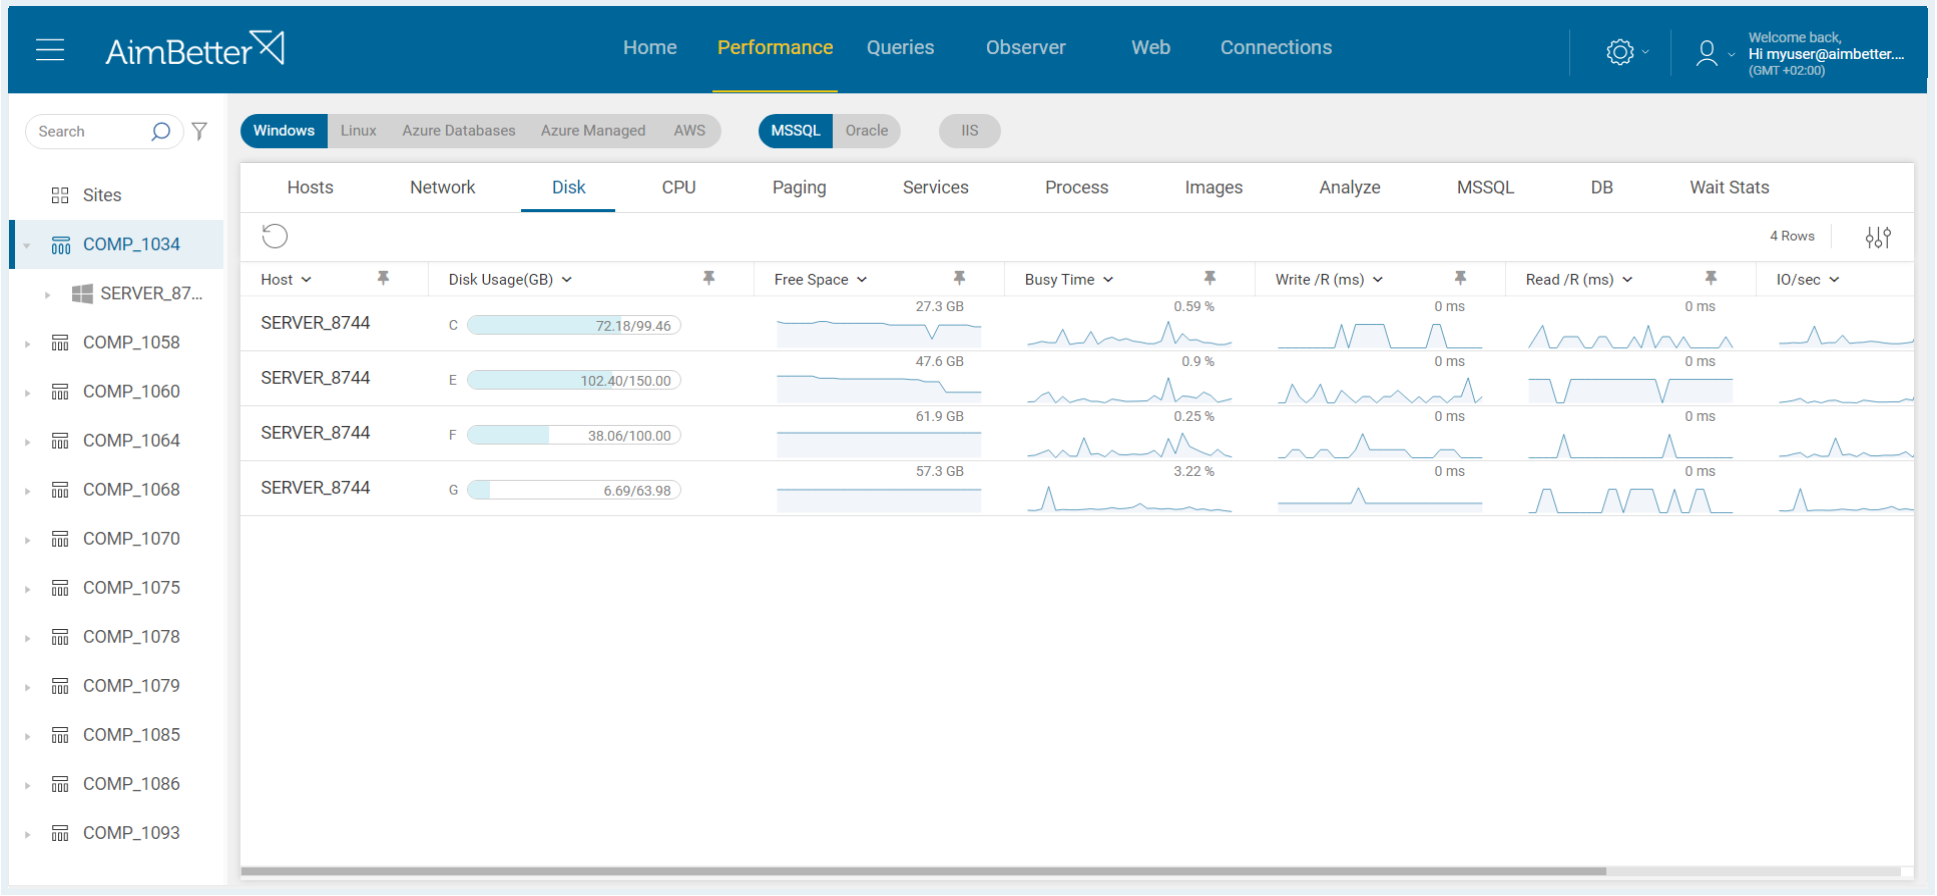
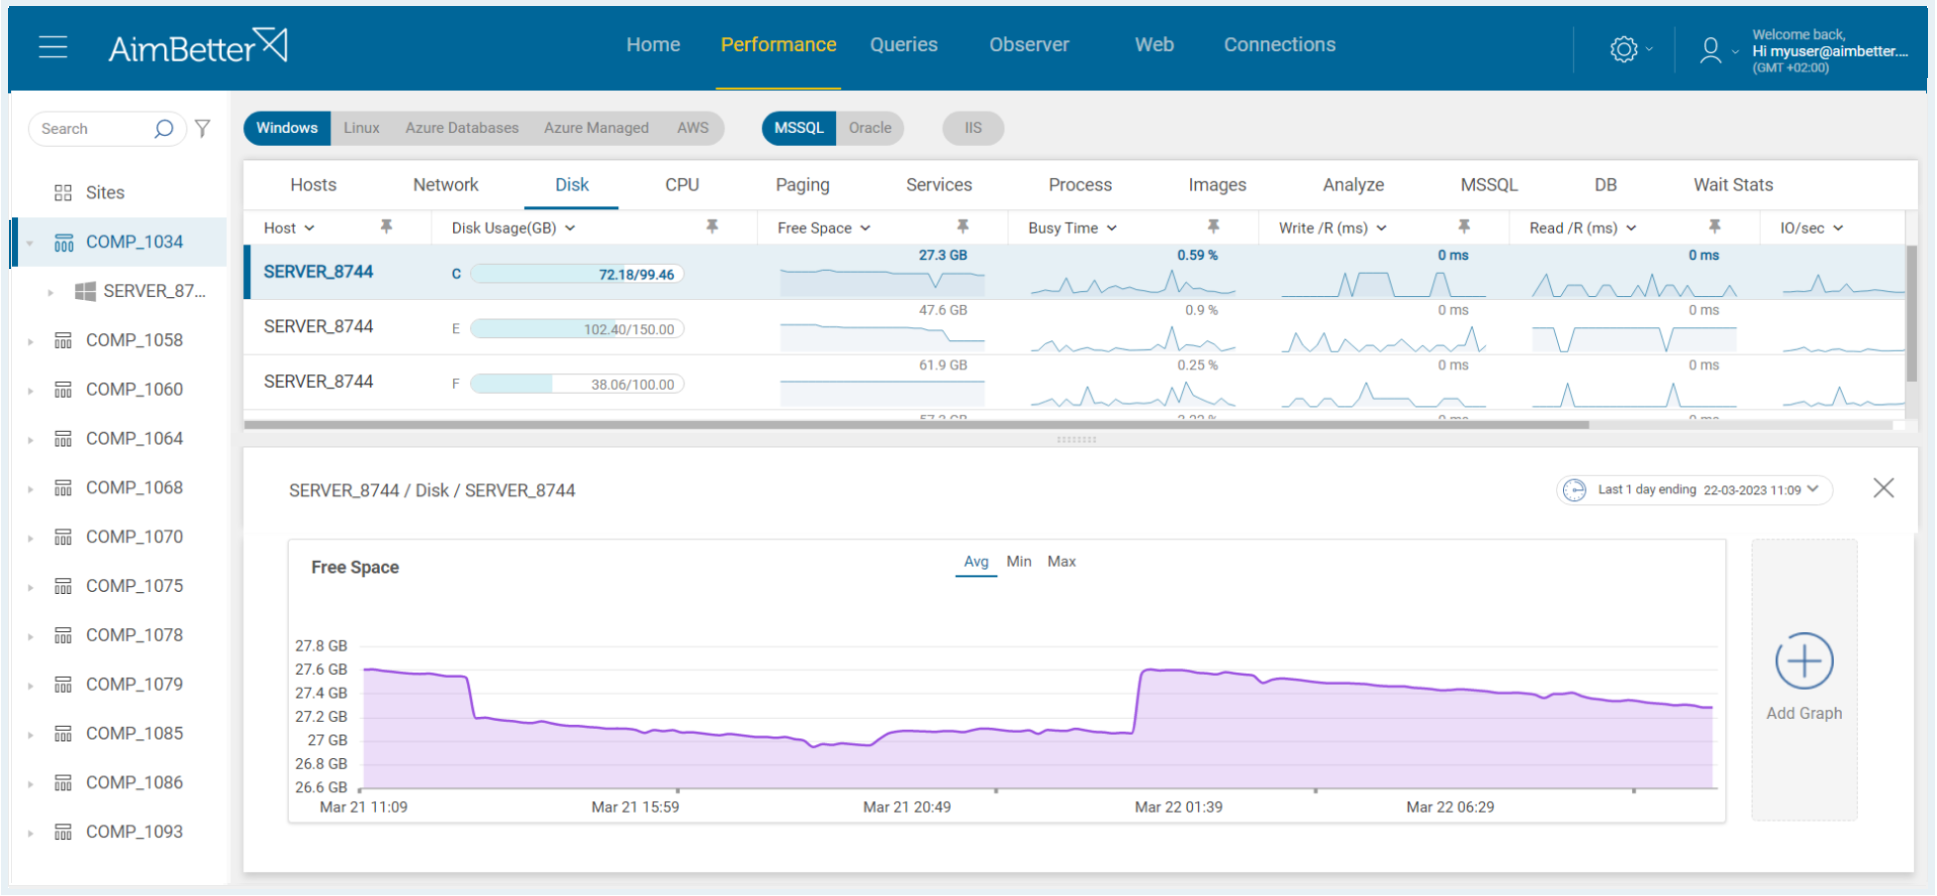
✓ More than 400 key performance indicators, such as CPU usage, disk space, and memory usage
✓ Get notified when any of these indicators exceed pre-defined thresholds
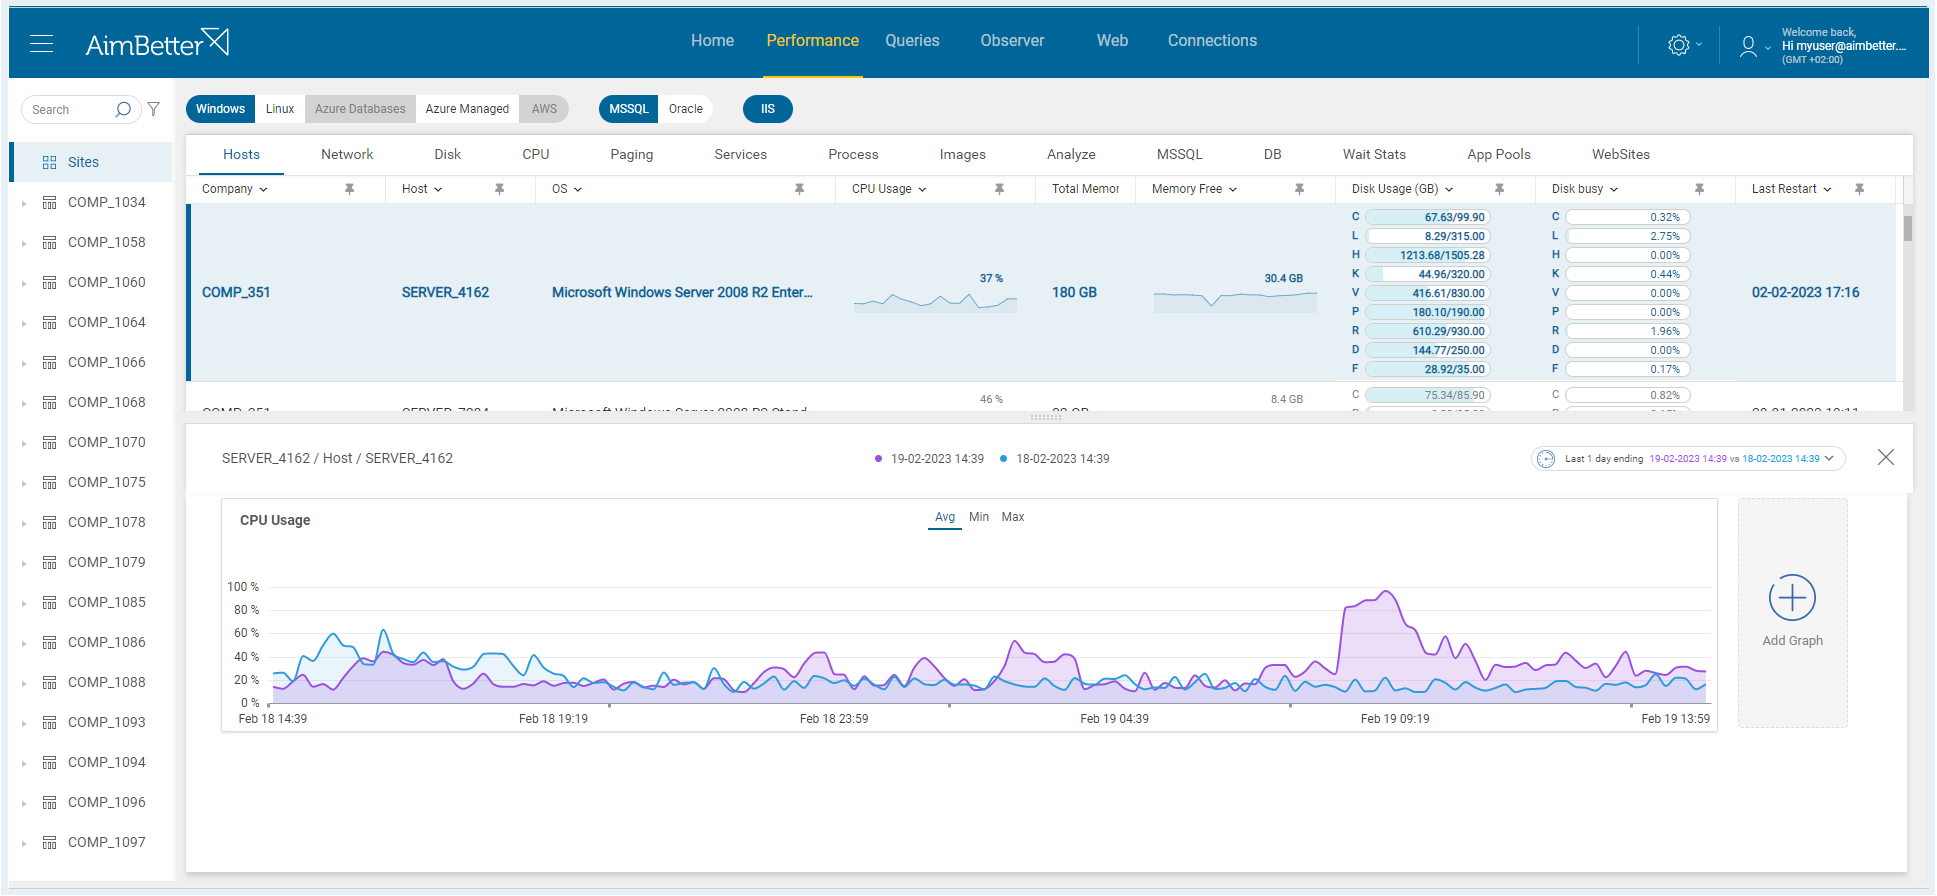
✓ Graphical display of these metrics over any desired period
✓ Sort and filter capabilities to easily identify the critical resource
✓ Investigate resource performance going back to any specific time
✓ Add multiple graphs of related performance metrics to better analysis
✓ Compare the performance of different periods in the same graph to easy anomaly detection
✓ Get 5-minute interval logs for any selected time to drill into which files and processes were involved in peak usage events
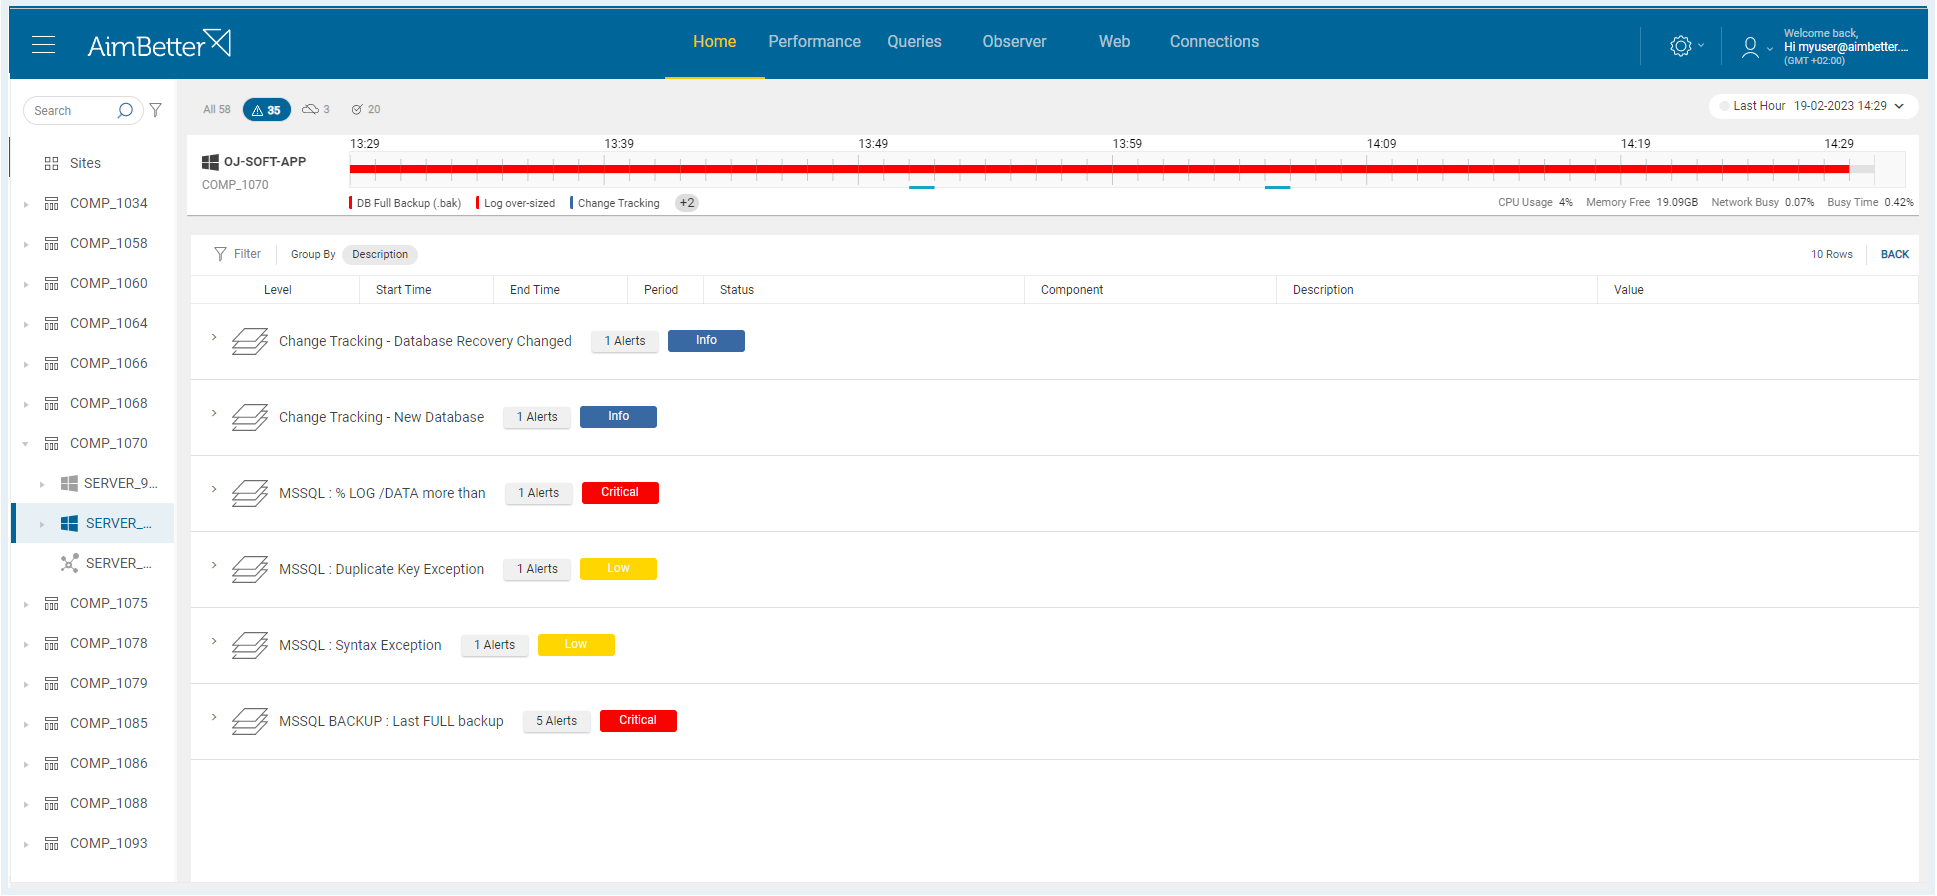
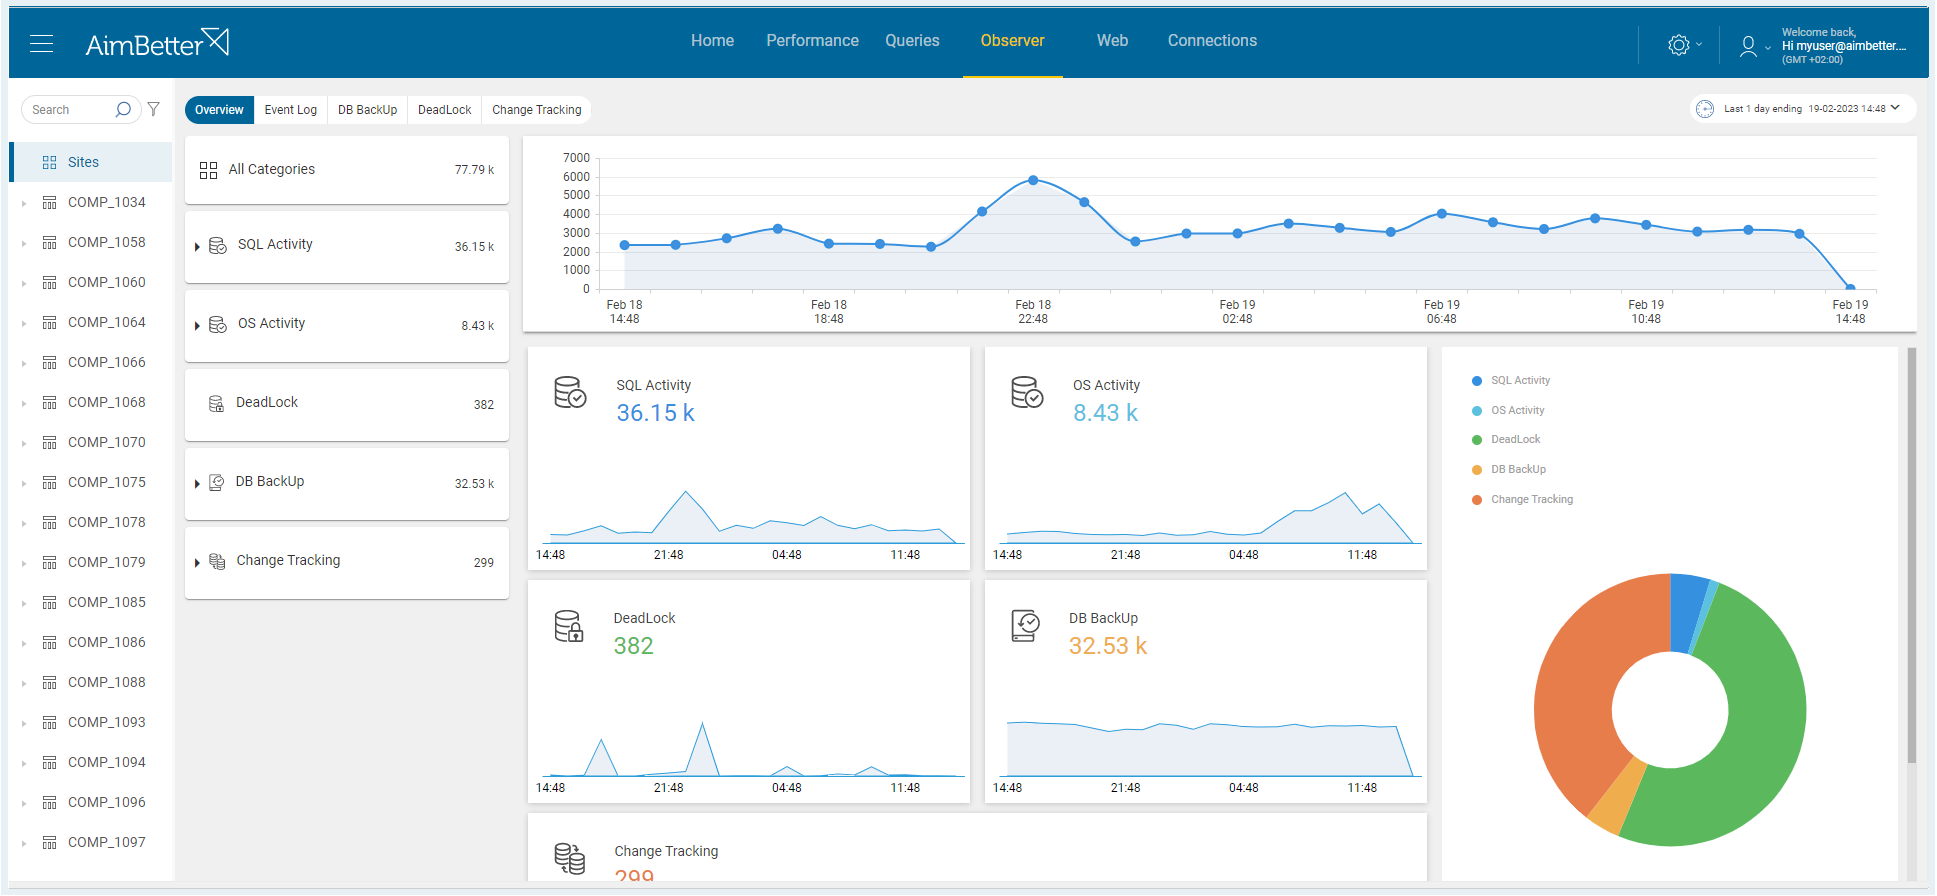
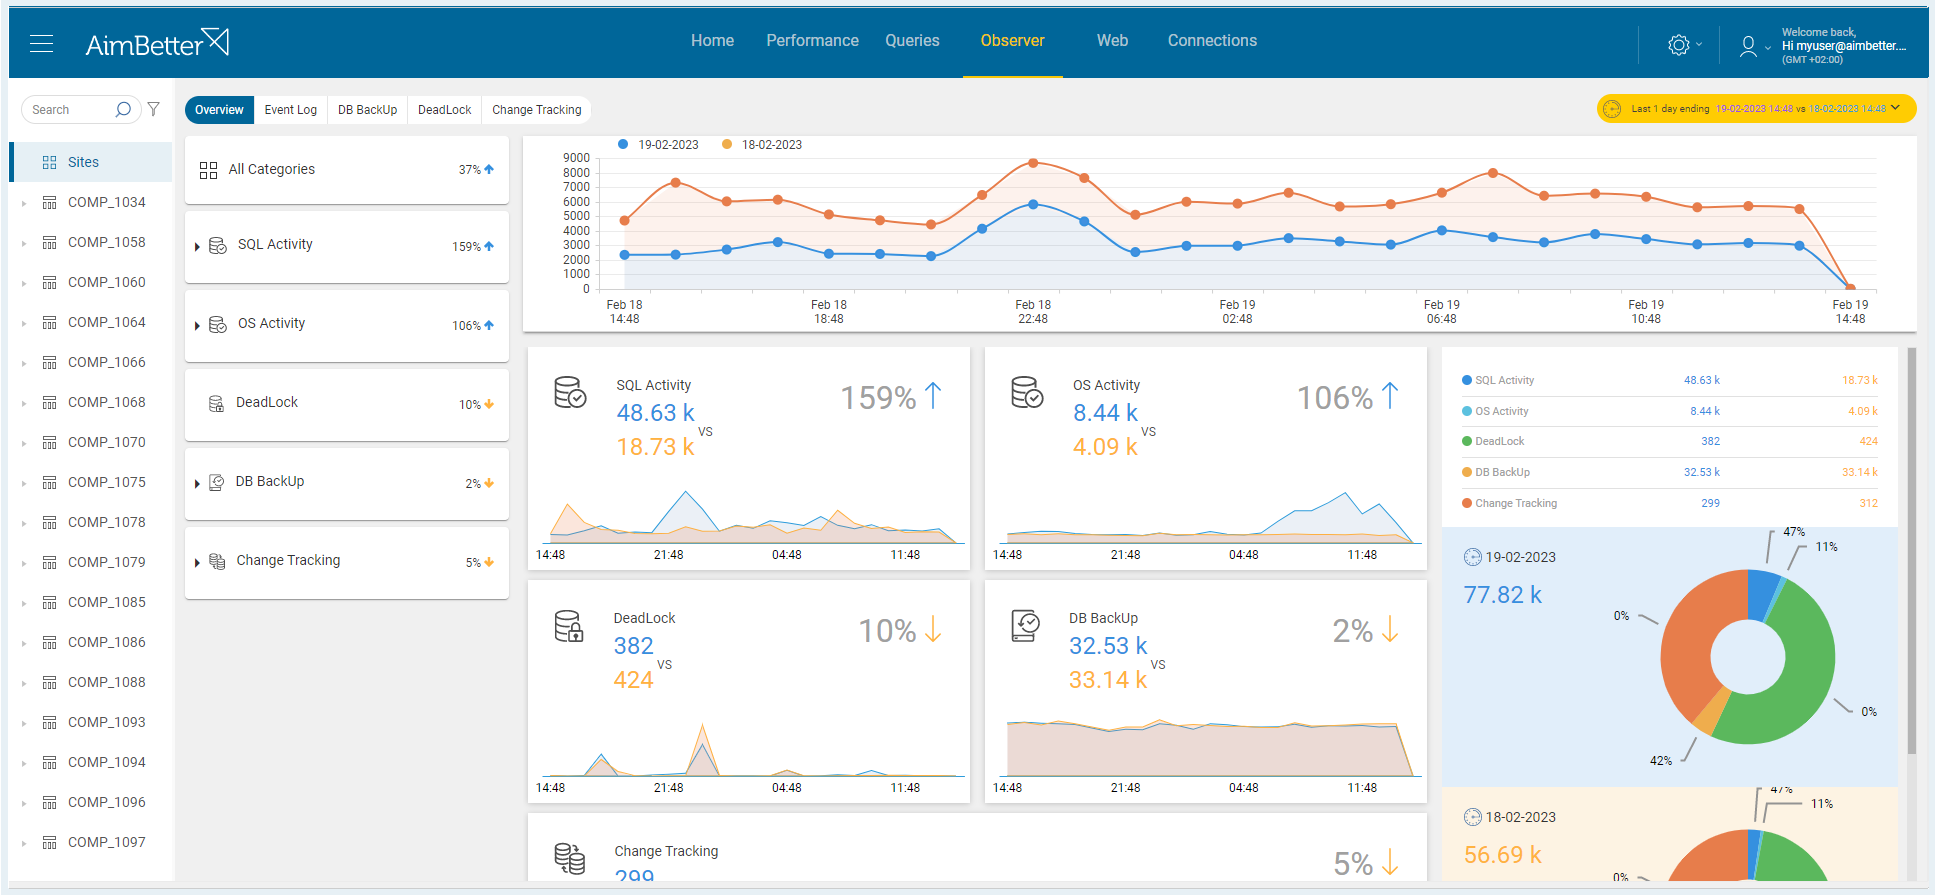
✓ Keep updated on any changes like software installation and updates, database creation, service status changes, and more
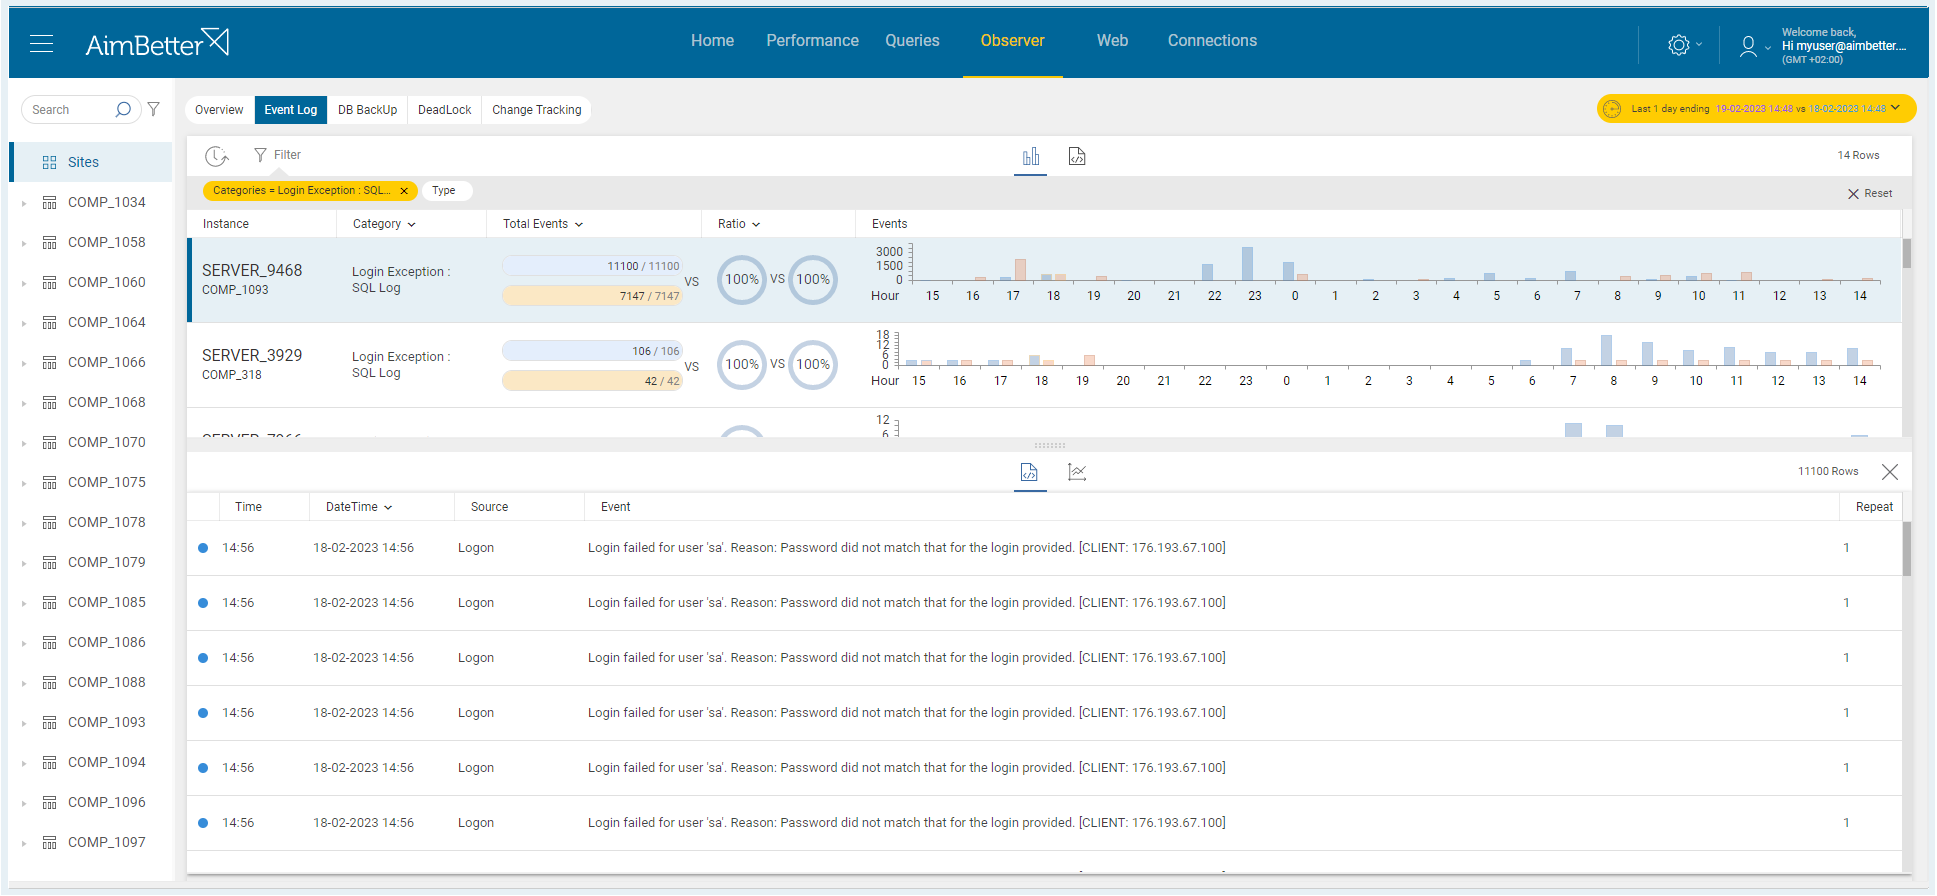
✓ View all the exceptions in both OS and SQL levels with details of when they happened, who was the user, and their description
✓ Recognize abnormal behavior, such as login attempts, that may pose a serious security breach
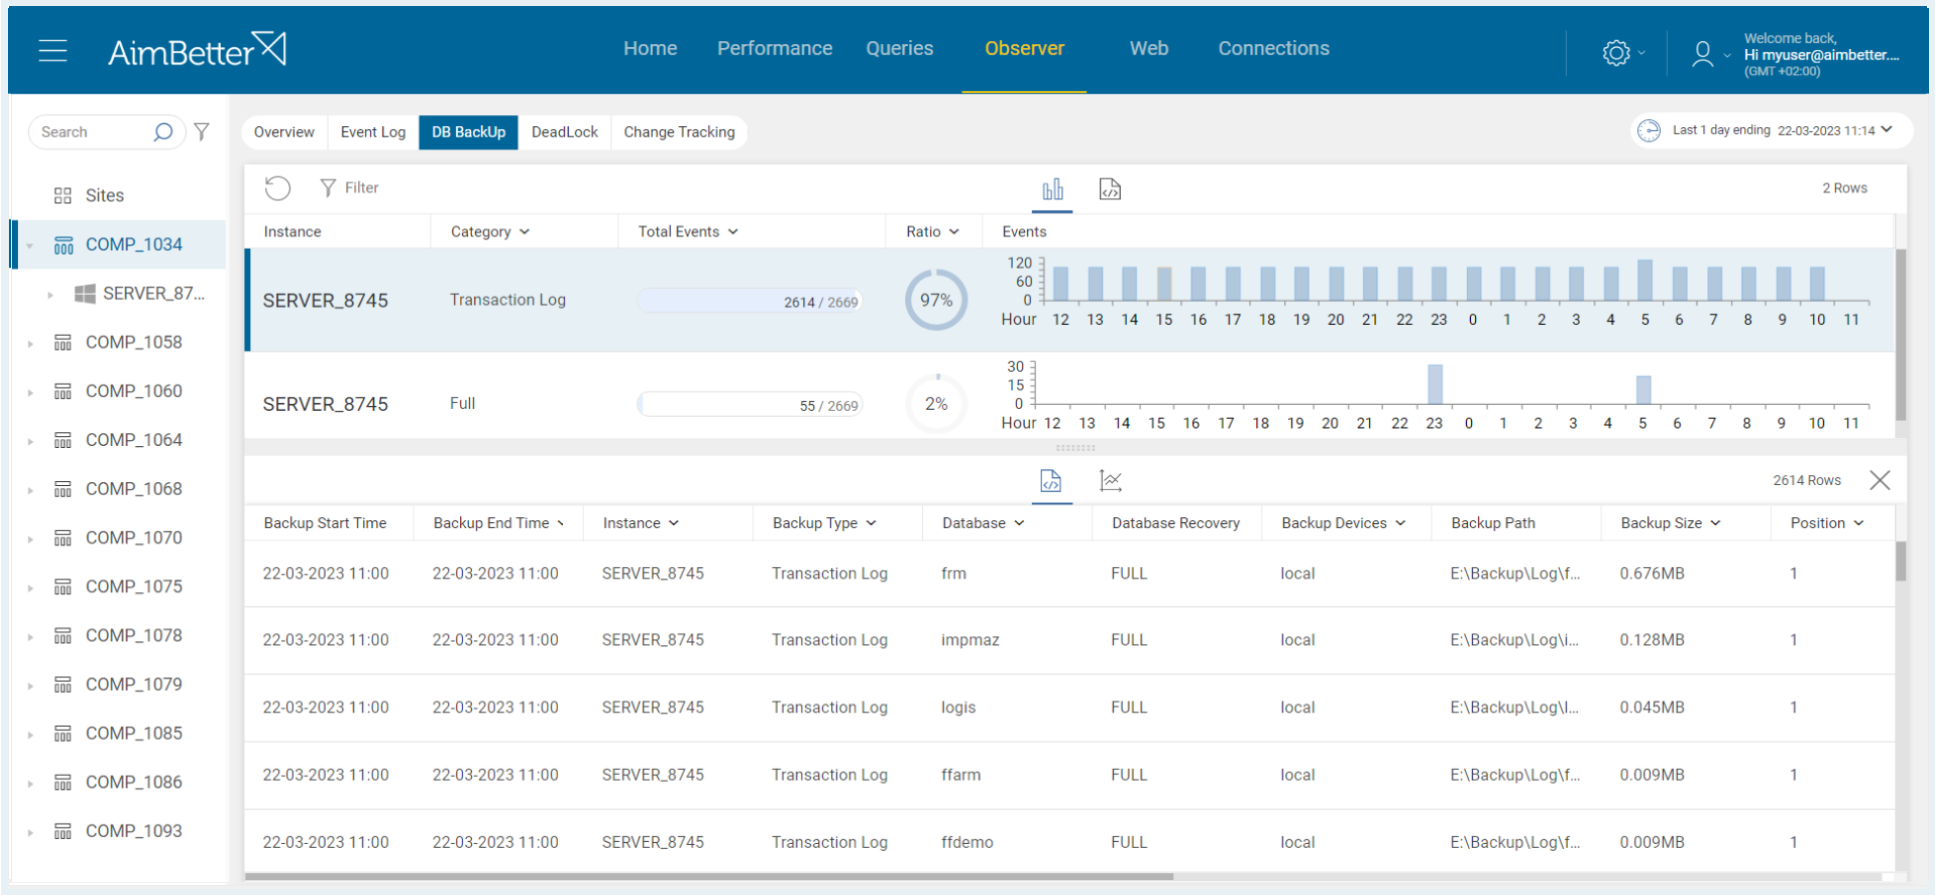
✓ Be aware of the Database backup initiatives and their rightful execution
✓ Get immediately notified if any backup has not been successfully done
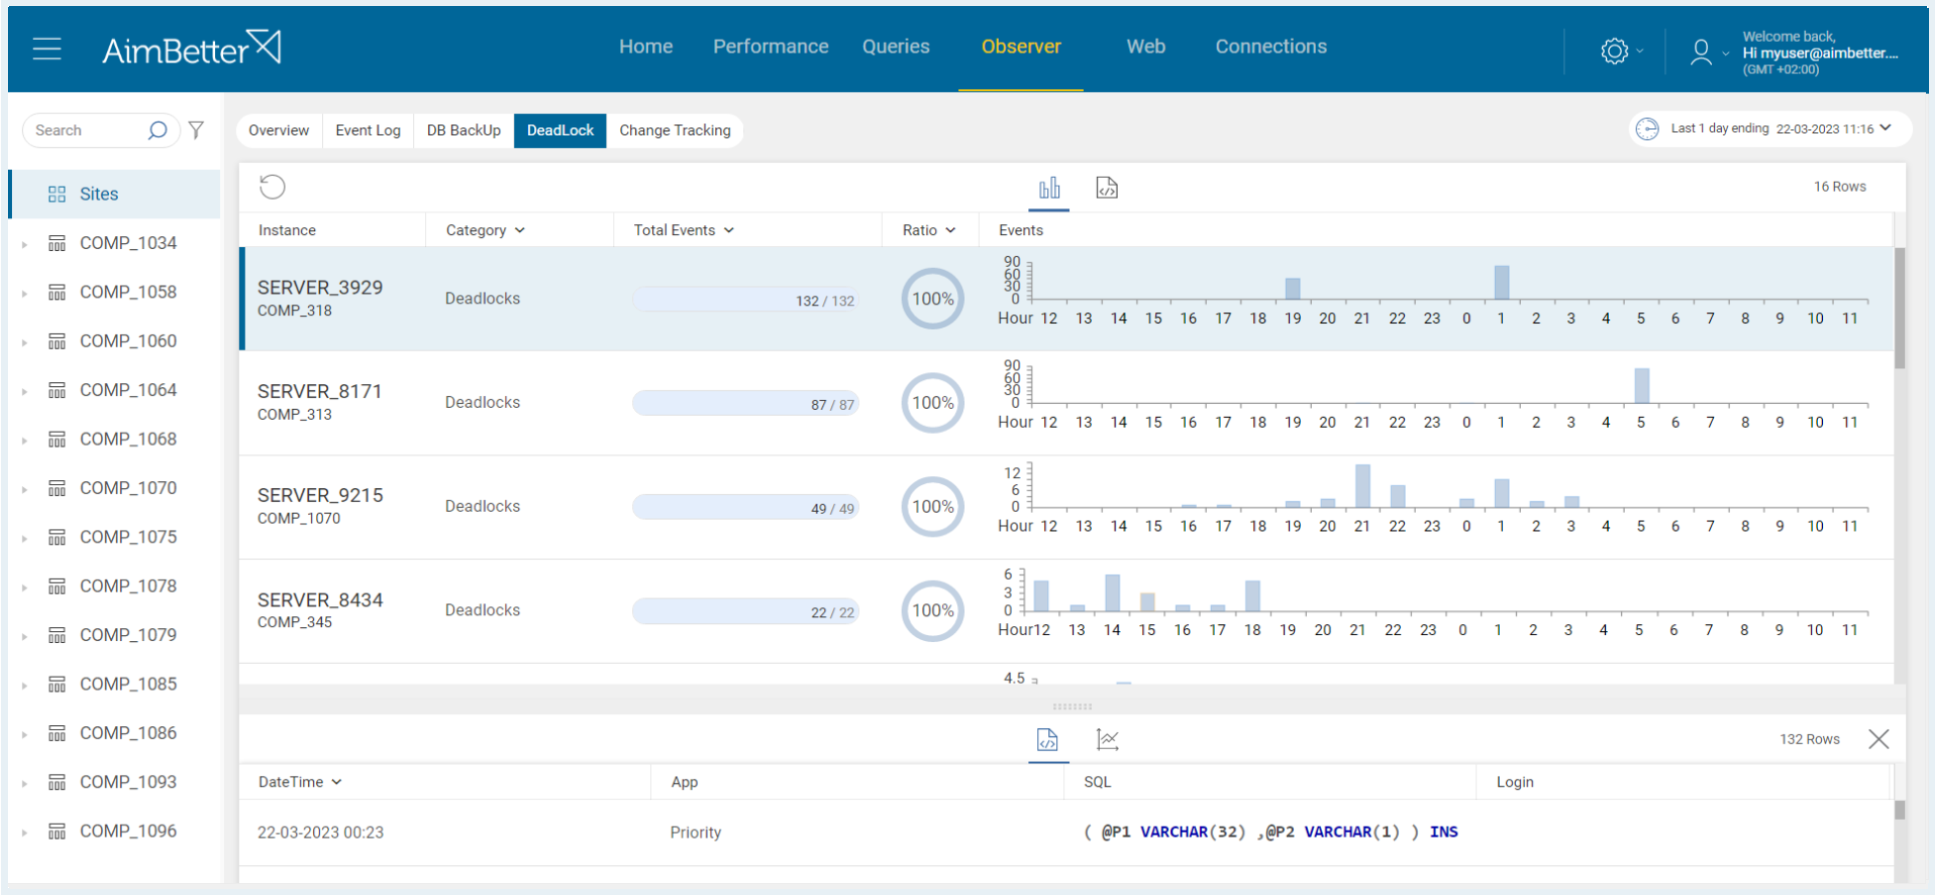
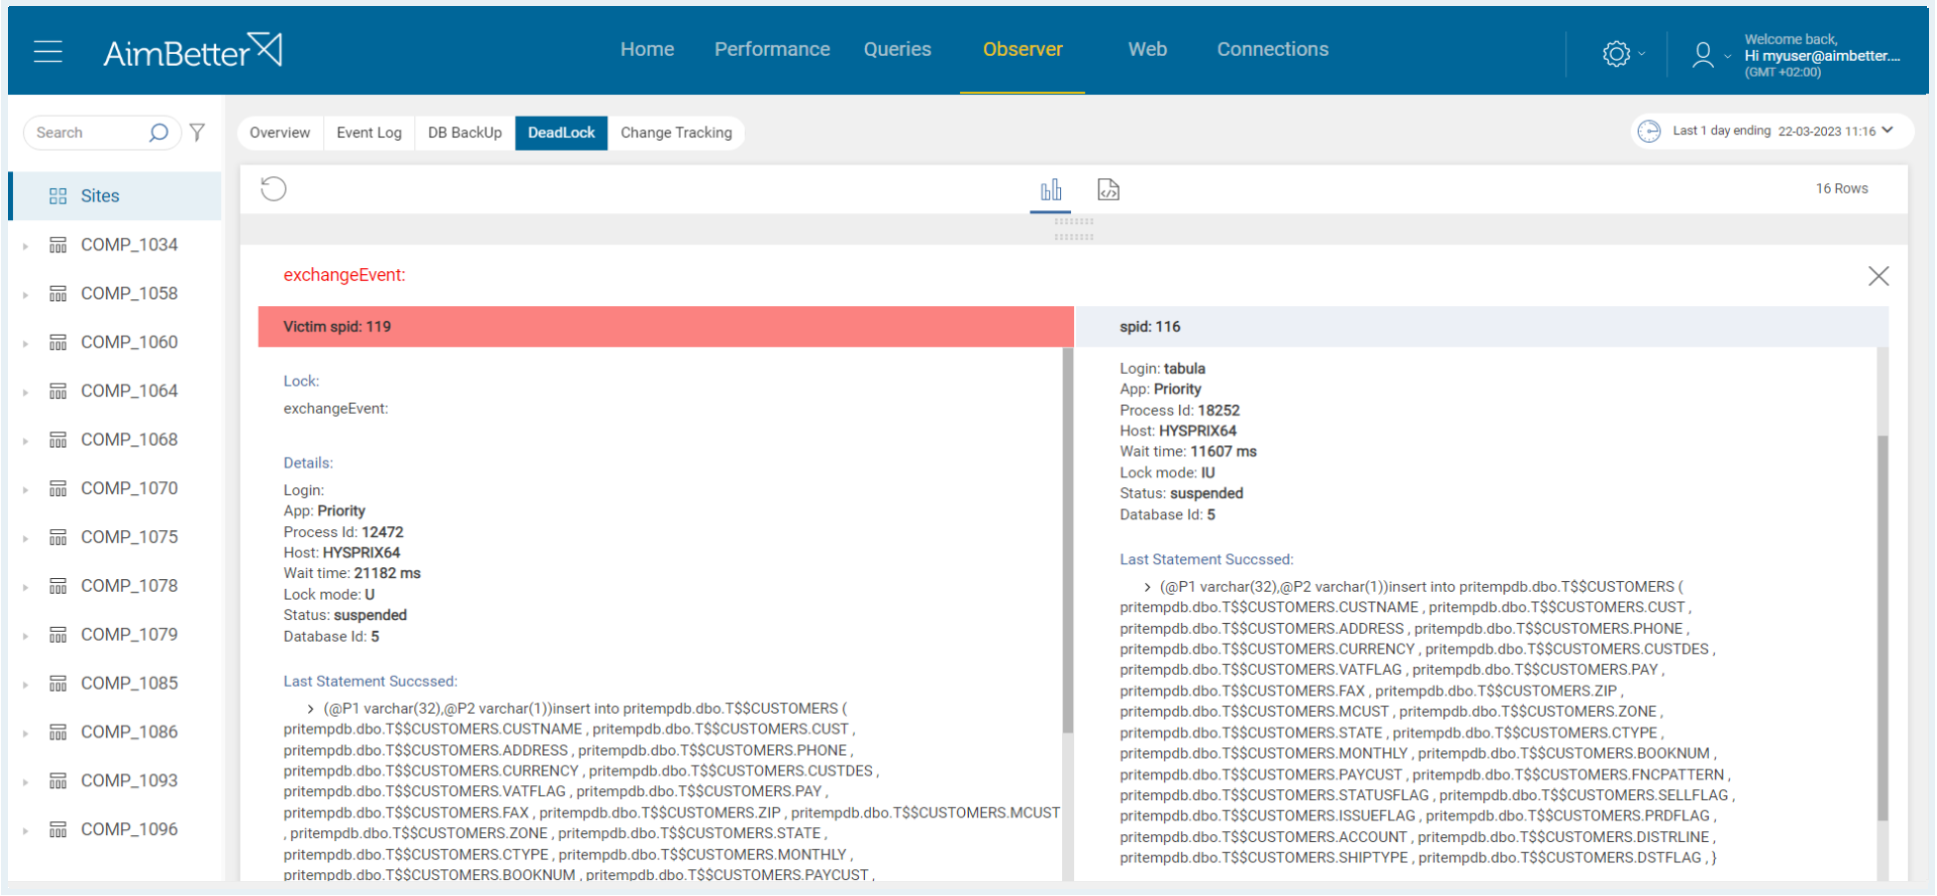
✓ See all the deadlocks that occurred over any selected period
✓ Understand all the causes and victims from deadlocks
✓ Quickly identify and address the most urgent cases.
✓ Scroll over the bars and become aware of the present challenges through labels beneath the status bars
✓ Choose which servers to focus on by selecting the hierarchical layer (All, Company, Host, or Server)
✓ Get details in seconds by clicking on the status bar of a specific server
✓ More than 400 key performance indicators, such as CPU usage, disk space, and memory usage
✓ Get notified when any of these indicators exceed pre-defined thresholds
✓ Graphical display of these metrics over any desired period
✓ Sort and filter capabilities to easily identify the critical resource
✓ Real-time comprehensive analysis of all queries
✓ Identify blocking queries with users’ details
✓ Multiple filtering options (duration, code, alert type, and more)
✓ Recommendations for missing index and plan improvements
✓ Queries’ execution plans deep analysis
✓ Resource usage analysis (CPU, memory, execution count, Disk I/O, and Cache).
✓ Keep updated on any changes like software installation and updates, database creation, service status changes, and more
✓ View all the exceptions in both OS and SQL levels with details of when they happened, who was the user, and their description
✓ Recognize abnormal behavior, such as login attempts, that may pose a serious security breach
✓ Be aware of the Database backup initiatives and their rightful execution
✓ Get immediately notified if any backup has not been successfully done
✓ See all the deadlocks that occurred over any selected period
✓ Understand all the causes and victims from deadlocks
Pricing
✓ All-inclusive
✓ No module-base
✓ No add-ons
✓ No unexpected charges
✓ Monthly subscription
✓ Affordable
✓ Straightforward
Expert DBA Support
✓ Daily checkups by DBA Team
✓ Personal reports on alerts
✓ Personal training
✓ Technical assistance
✓ DBA Services on-demand
Satisfied Customers
✓ Gain complete visibility
✓ Solve slowness and downtime
✓ Save thousands of dollars
✓ Enterprise and SMB customers
✓ Get a solution, not only a product!


