When Dynamics started to slow down, AimBetter made a quick find and fix easy.
By Henry Kaye. December 20018
Every operator of a database system such as Microsoft Dynamics wants and needs to get optimum usage. The key thing is to make sure that trying to achieve this doesn’t create a vulnerability. In other words, making sure that getting the most “bang for the bucks” is a controlled process and not a runaway explosion.
Recently, we were invited to demonstrate the capability of AimBetter in a very large enterprise that uses Microsoft Dynamics as the database engine, initially installing the application to monitor a single SQL Server instance. Within a few hours, we were called back with the report that their system had slowed down dramatically, and with the suspicion that our presence was the cause.
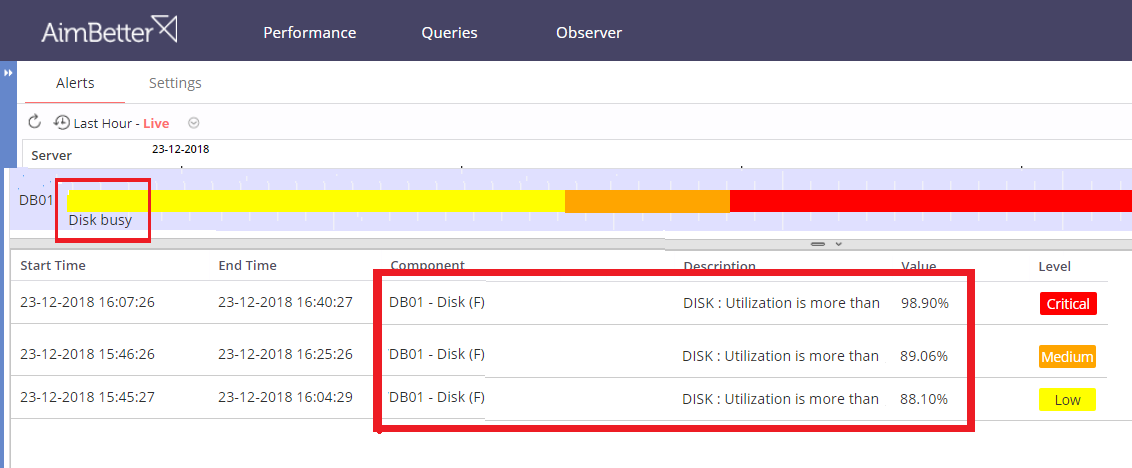
Since they were of course not fully familiar with how AimBetter works, what it does, and what it can do, we immediately opened their monitor to get a handle on what was happening, and this is what we saw.. quick escalation of disk usage, rising through the three threshold levels in just a few minutes.
The AimBetter way
Using AimBetter dashboard, you can quickly see the whole picture, going straight from the alert with one click to find which components are overheating. Since it’s clearly a hard-disk storage issue showing on the main alerts, we were immediately clicked onto the Query tab, which shows the relevant details of all the current queries:
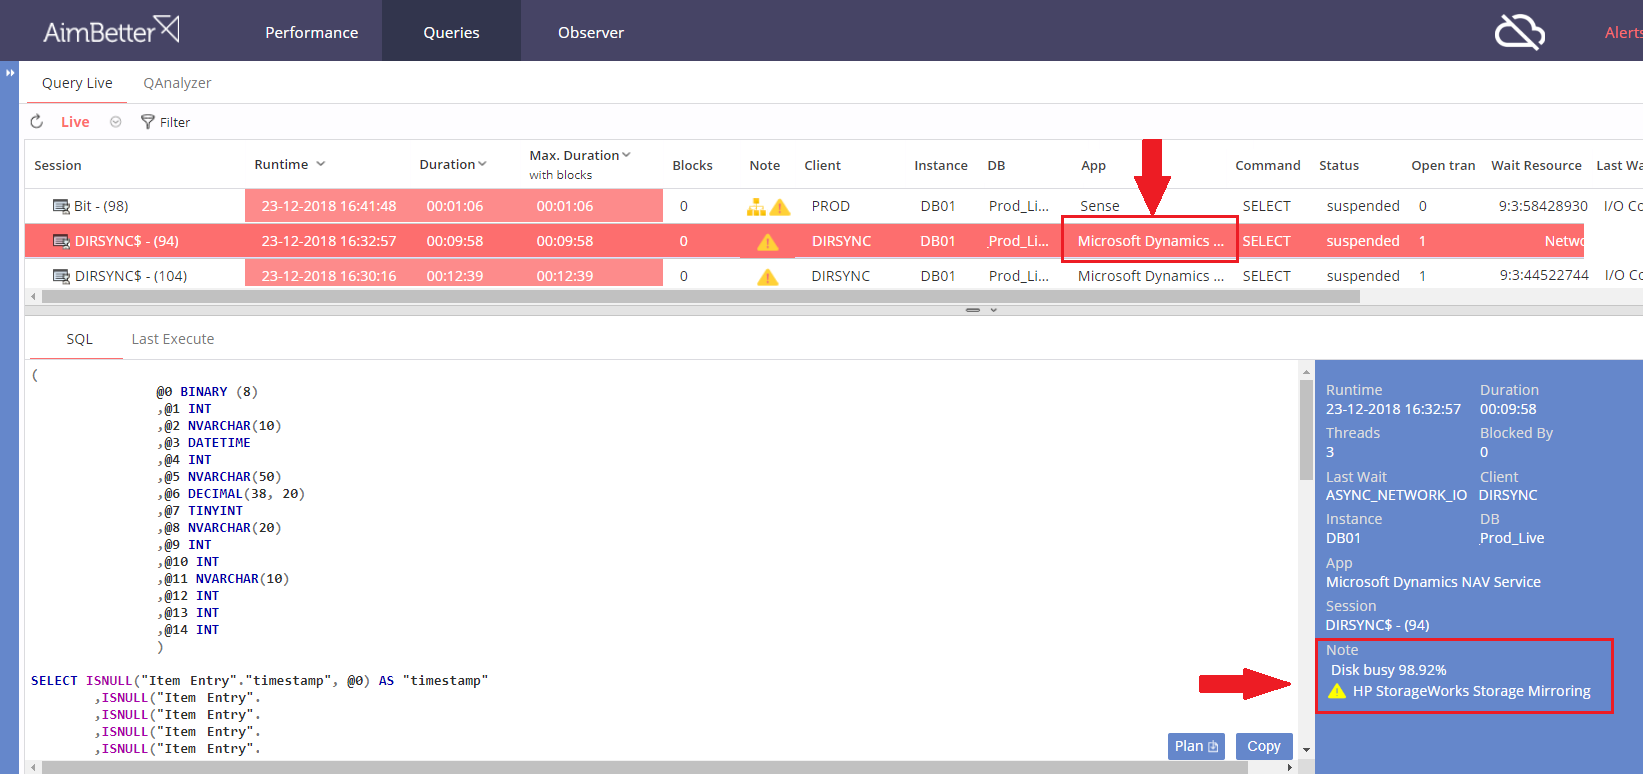
What’s immediately apparent is that this issue comes from a process that is maintaining the Microsoft Dynamics mirroring replication – involving high-volume data movement.
At first, there was some doubt about why this particular case arose, but one more screen makes it all clear – looking at the performance monitor shows that there’s a quickly rising level of usage of this disk running up to 80% starting from the moment we began monitoring with our process and jumping up to 100% at the moment the problem was reported.
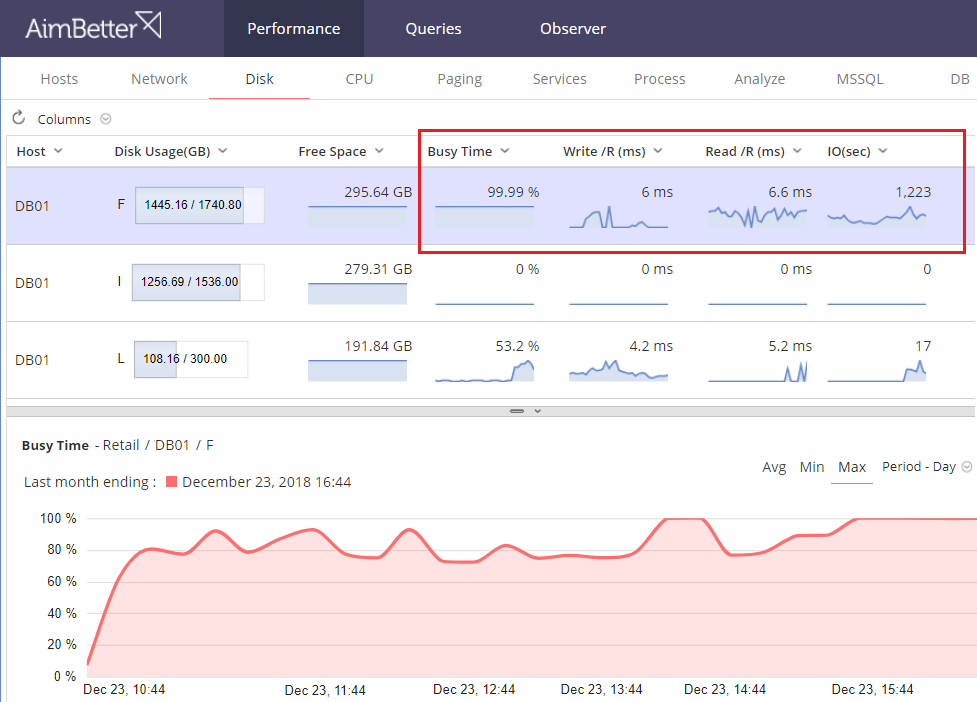
Straight away, this is a problem that we can see has nothing whatsoever to do with AimBetter itself, but instead was showing a stress condition on a physical component – disk usage on one drive climbing steadily from the moment we started to run, ending up at 99%!
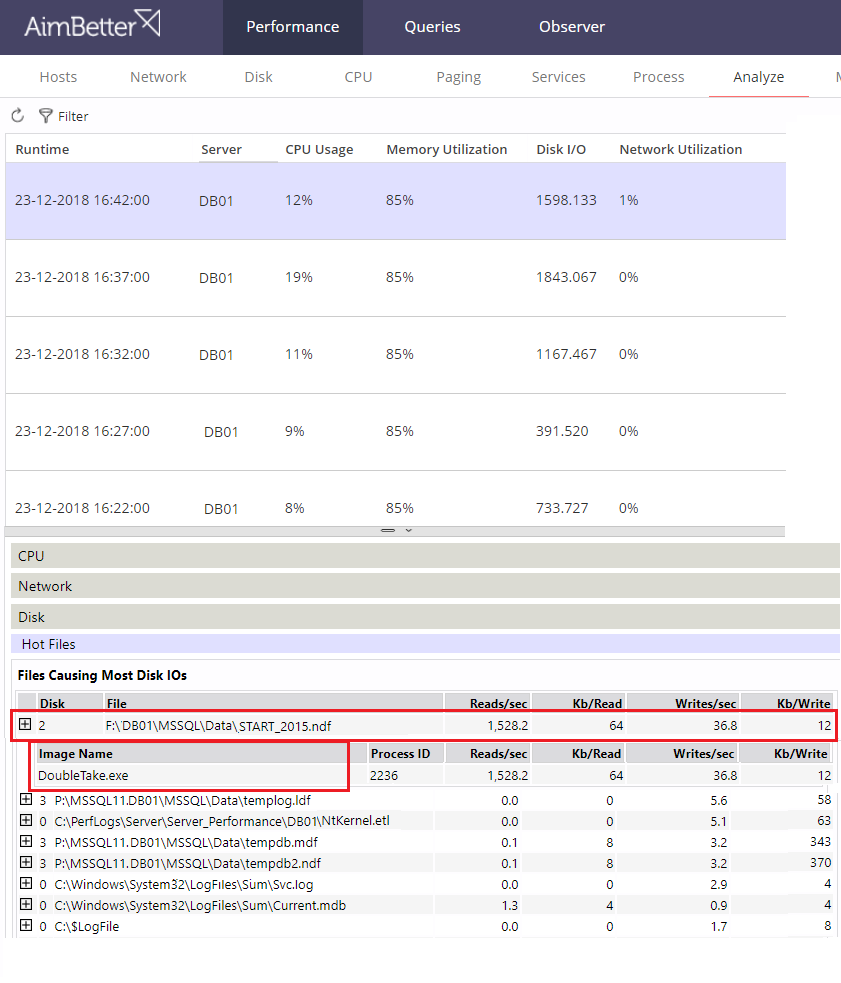
To put a final seal on how AimBetter could pinpoint the exact circumstances that caused this crisis, we looked at the results of the Analyzer reporting on storage activity. What can be seen there is the whole story -the process that was running (DoubleTake, which is a proprietary manager of replication) relates straight back to the Alert.
Where AimBetter scores
Getting through a crisis in a few minutes, without having to skip along between multiple screens and tools, we identified what was causing this condition. As we reported in many other instances of unexpected load, this was a case of a high-demand process (DoubleTake) running during normal operating time. It is important (especially where resources are being used at close to peak) to schedule high-demand activity like backups, virus scans, and replication, into low-demand time-slots so that they do not conflict with real-time activity.
AimBetter is the ideal solution for identifying such issues. Try it for yourself.