In SQL Server, every transaction is first written to the transaction log before the engine considers it committed. A log flush is the act of writing in-memory log records to the physical log file on disk.
SQL Server flushes the log to disk primarily in these situations:
- At each transaction commit
- During checkpoints
- When the log buffer becomes full
- During log-related operations such as backup or truncation
When the log cannot be flushed quickly enough, SQL Server must wait before committing transactions. This leads to increased WRITELOG wait times, longer transaction response times, blocking or slowdowns in high-throughput systems, and cascading performance impacts on OLTP workloads.
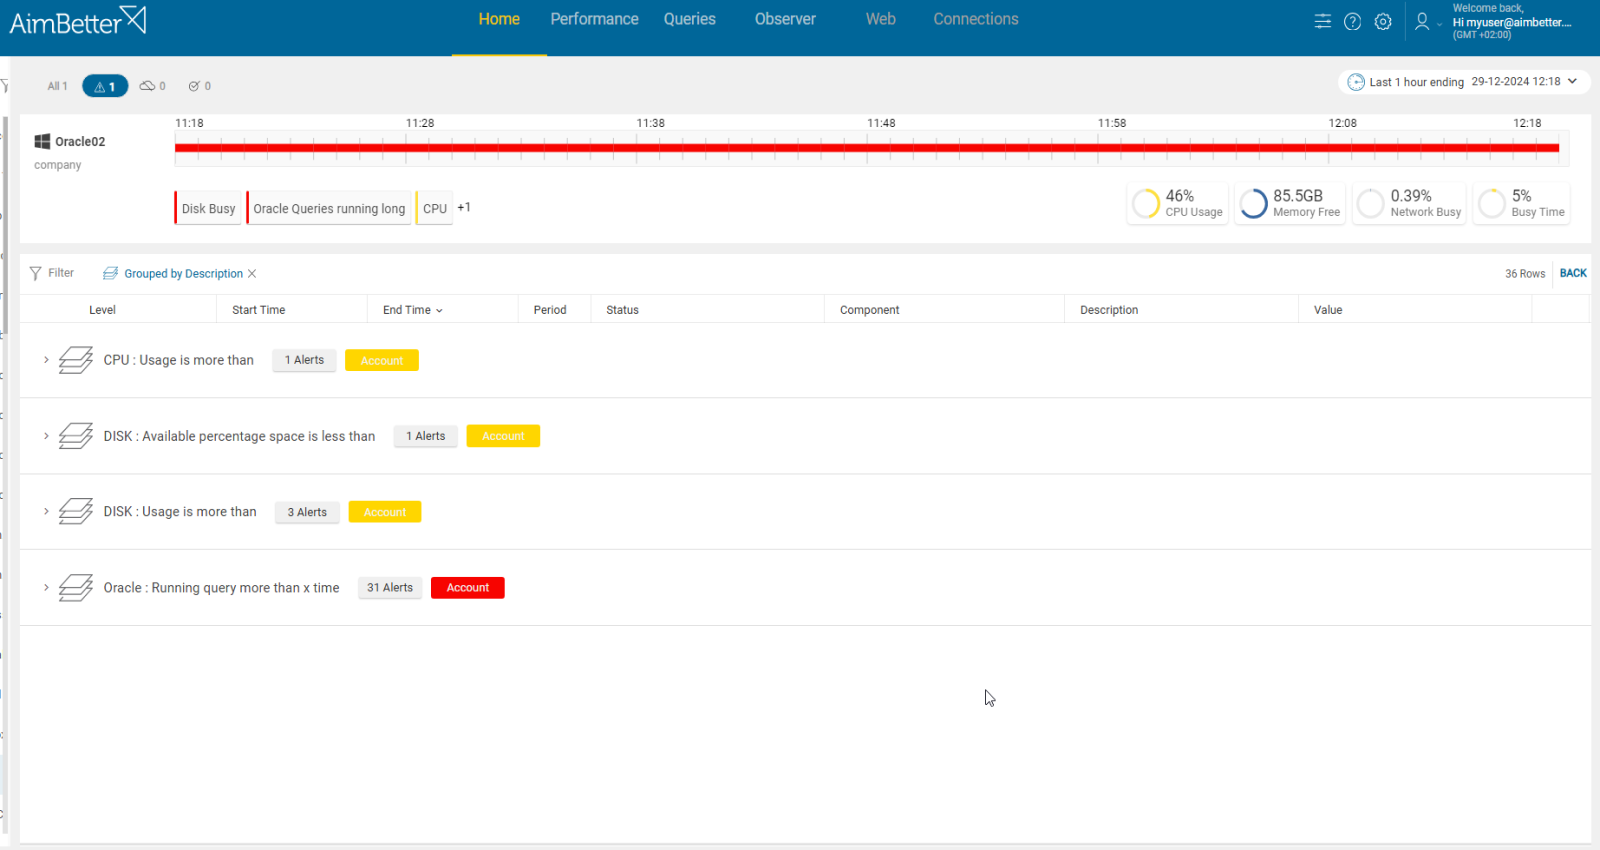
Tracking this metric allows teams to identify problems early—before applications begin to time out or queues start to build up.
Possible causes
1. Slow or Overloaded Storage (Disk Latency)
The disk hosting the transaction log cannot keep up with SQL Server’s write operations, causing delays every time the log is flushed to disk.
Problem identification:
Check for high WRITELOG wait times and elevated disk write latency, which indicate that the storage subsystem is struggling to handle log write throughput.
- In SQL Server, use Activity Monitor to detect long transactions: Query sys.dm_tran_active_transactions and sys.dm_exec_requests.
- Identify high-write operations via sys.dm_exec_query_stats.
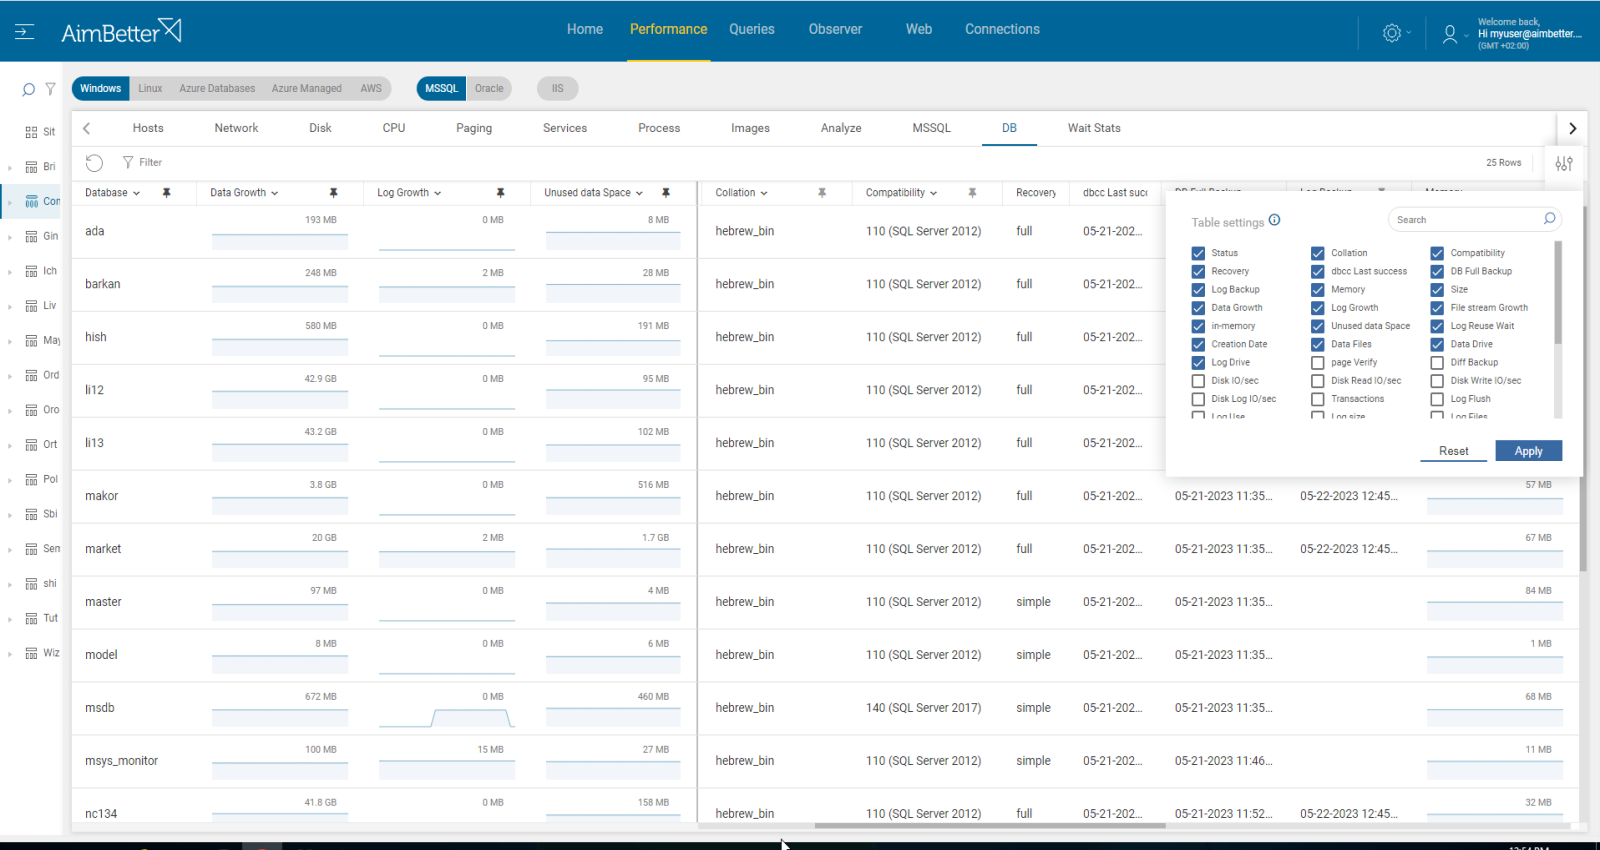
- Monitor log usage with DBCC SQLPERF(LOGSPACE).
- In Windows Task Manager / Resource Monitor, identify processes that are causing heavy writes.

Recommended action :
- Move log files to dedicated high-speed storage (SSD/NVMe).
- Ensure no other services overload the disk.
- Use fixed-size log files to avoid auto-growth delays.
- Review SAN performance or cloud storage provisioning.
2. Heavy Write Workloads or Long Transactions
Applications generate large volumes of log records or keep transactions open for extended periods, increasing the time SQL Server must wait to flush the log.
Problem identification:
Look for long-running transactions, spikes in write activity, or high log usage that coincide with increases in log flush times.
- In SQL Server, use Activity Monitor to detect long transactions: Query sys.dm_tran_active_transactions and sys.dm_exec_requests.
- Identify high-write operations via sys.dm_exec_query_stats.
- Monitor log usage with DBCC SQLPERF(LOGSPACE).
- In Windows Task Manager / Resource Monitor, identify processes that are causing heavy writes.
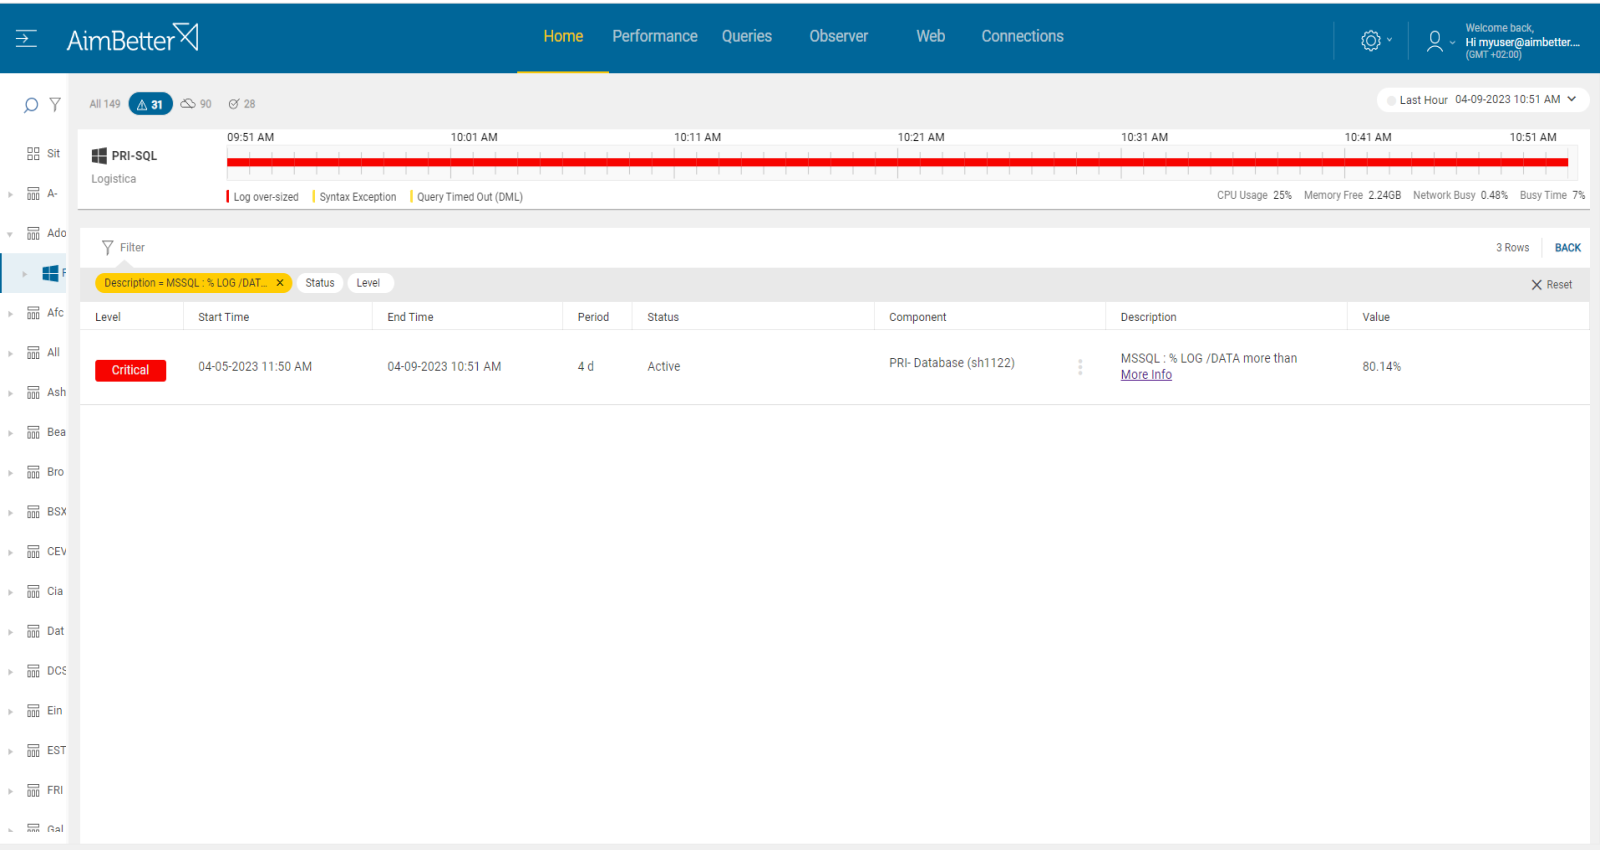
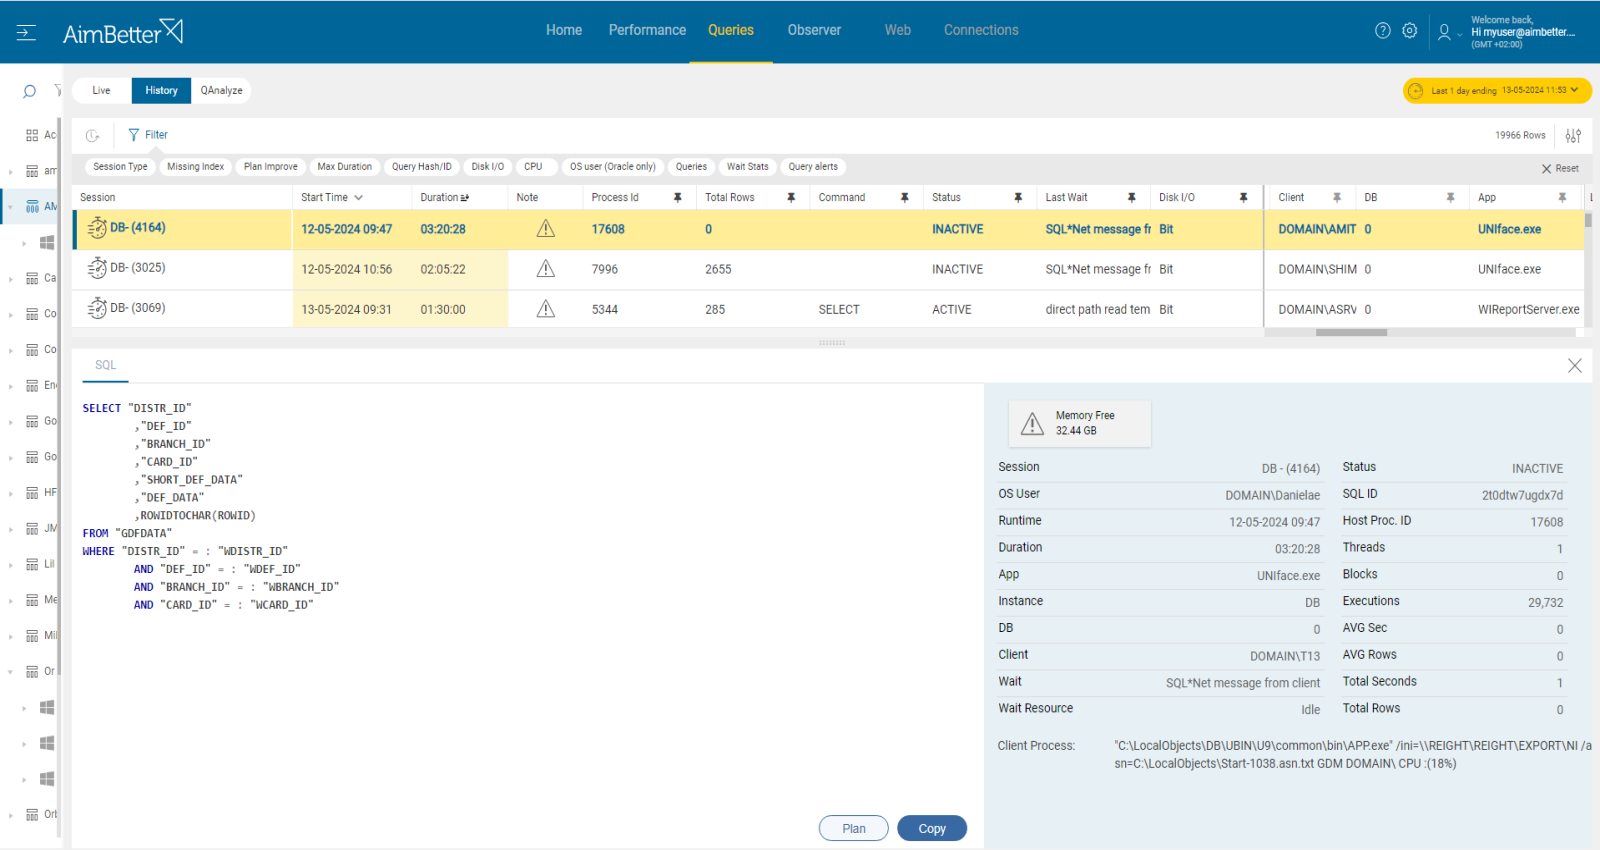
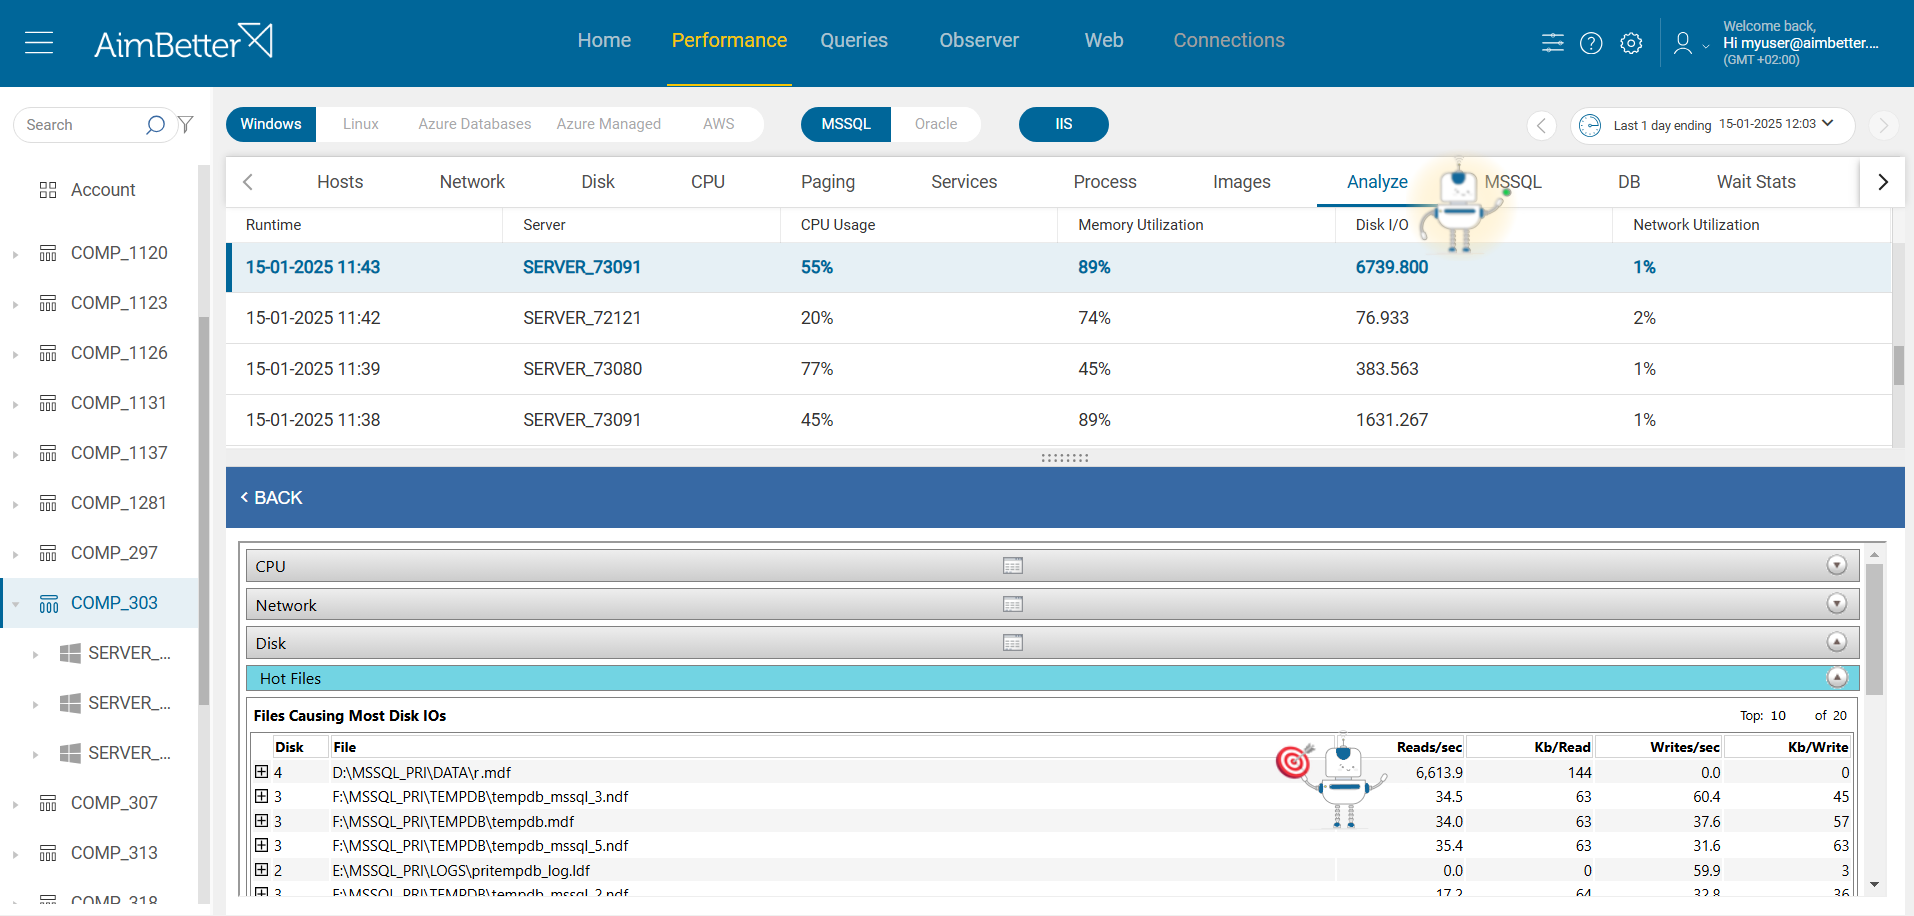
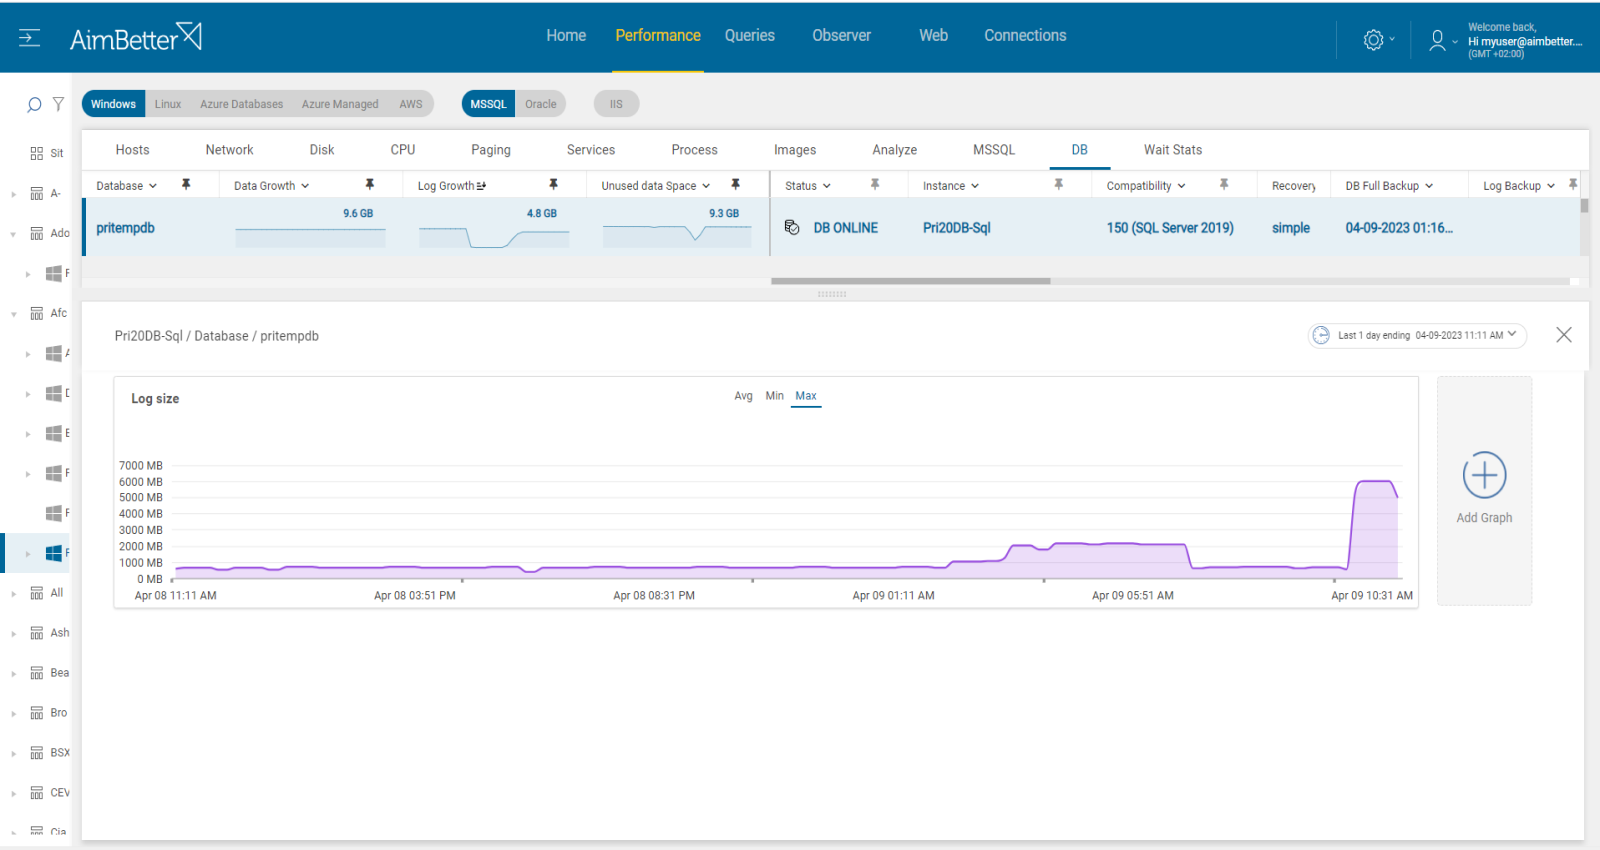
You can filter open transactions by duration to identify those that have been open for a long time, which may be preventing the log from truncating. AimBetter also alerts on long-running queries, which can be correlated with a spike in log flush time, displaying the query’s code, plan for download, and improvement recommendations. You can also see the top files in terms of read/write I/O to identify extensive writing to the log.
Recommended action :
- Optimize heavy write queries and batch operations.
- Break bulk inserts into smaller batches.
- Address blocking or stuck sessions quickly (AimBetter can show and kill them).
- Ensure regular log backups to allow proper log truncation.
3. Improper Autogrowth Configuration and Rapid Log Growth Rate
Improper autogrowth configuration and rapid log growth can cause frequent or significant expansion events that temporarily stall log writes and increase log flush times.
Problem identification:
Review the database’s autogrowth settings and check for repeated or significant log growth events in SQL Server error logs or metadata.
- Check SQL Server Error Logs for frequent log auto-growth events.
- Review the database’s log file autogrowth settings in SSMS (percent-based growth often triggers too frequently).
- Inspect current log file size and VLF count using DBCC LOGINFO or DBCC LOGFILE.
- Monitor disk performance during growth events in Windows Performance Monitor (PerfMon), especially write latency and disk queue length.
Recommended action :
- Pre-size the log file large enough to handle peak activity without growing during business hours.
- Reduce excessive VLFs by shrinking and regrowing the log in properly sized chunks.
- Continuously track log growth trends and adjust sizing proactively.


